Received: September 3, 2015
Accepted: October 3, 2015
Mediterr J Hematol Infect Dis 2015, 7(1): e2015059, DOI 10.4084/MJHID.2015.059
This article is available on PDF format at:

Gianfranco Salvi1, Idanna Innocenti2, Francesco Autore2 and Luca Laurenti2
| This is an Open Access article distributed
under the terms of the Creative Commons Attribution License (http://creativecommons.org/licenses/by/2.0), which permits unrestricted use, distribution, and reproduction in any medium, provided the original work is properly cited. |
|
Abstract This study was conducted by
contacting the population of the Italian haematology units and
collecting from 68% of them data concerning the number of patients with
chronic lymphocytic leukaemia visited over the previous 12 months, with
the aim of obtaining an overview of the treatment of this disease and
comparing the results with the prevalence estimates found in literature. The projection obtained (about 17,000 patients visited in the previous 12 months) is probably overestimated because of double-counting of patients who may have been treated at two different facilities during the year, although it is also underestimated since the internal medicine units were not involved. The balance of these two opposite factors is not known. It is important to bear in mind the approximation with which the count was performed in facilities for which no official data were available. Albeit with these limits, the results obtained are in line with some existing prevalence data and make it possible to determine the portion of patients at different Binet stages and in the various age ranges, identifying the corresponding therapeutic treatments. Use of the CIRS scale to classify patients as FIT and UNFIT was seen to be still somewhat limited. |
Introduction
Chronic Lymphocytic Leukaemia (CLL) is the most common form of
leukaemia in the Western world, with an incidence that in Italy is
estimated at between 5.0 and 5.5 cases per 100,000 men and between 3.5
and 4.0 cases every 100,000 women;[1,2,4] only the populations of Australia, United States and Ireland are characterised by a higher incidence.[7,9,10]
The risk of a diagnosis of CLL increases significantly with age: the
estimated incidence for the population over 70 years of age is
approximately 20 cases every 100,000.[3,5]
The
prevalence data available for Italy, calculated on the basis of mean
survival, are discordant: some sources talk about 20,000-22,000 cases,[3,8] others about approximately 12,000 cases.[6]
The
idea of performing a census of patients with CLL originates, on the one
hand, from the need to estimate the number of individuals with the
disease using an alternative approach and, on the other, from the need
to collect information of use for understanding the way this disease is
treated in the different parts of our country.
The census is in
itself an ambitious aim that by definition has to tackle the many
difficulties implicit to data collection. The method proposed, which is
based on the quantification of the number of patients visited in each
facility, represents a compromise that does not aim to provide exact
results, rather to offer realistic estimates of the phenomena that may
influence the choice of therapy concerning the treatment of CLL in
Italy. Since the survey was conducted in almost 70% of the facilities
defined originally, the authors believe that the data obtained and
corresponding projections, albeit with the limits that will be
discussed, constitute a very useful contribution to improving current
knowledge in this area.
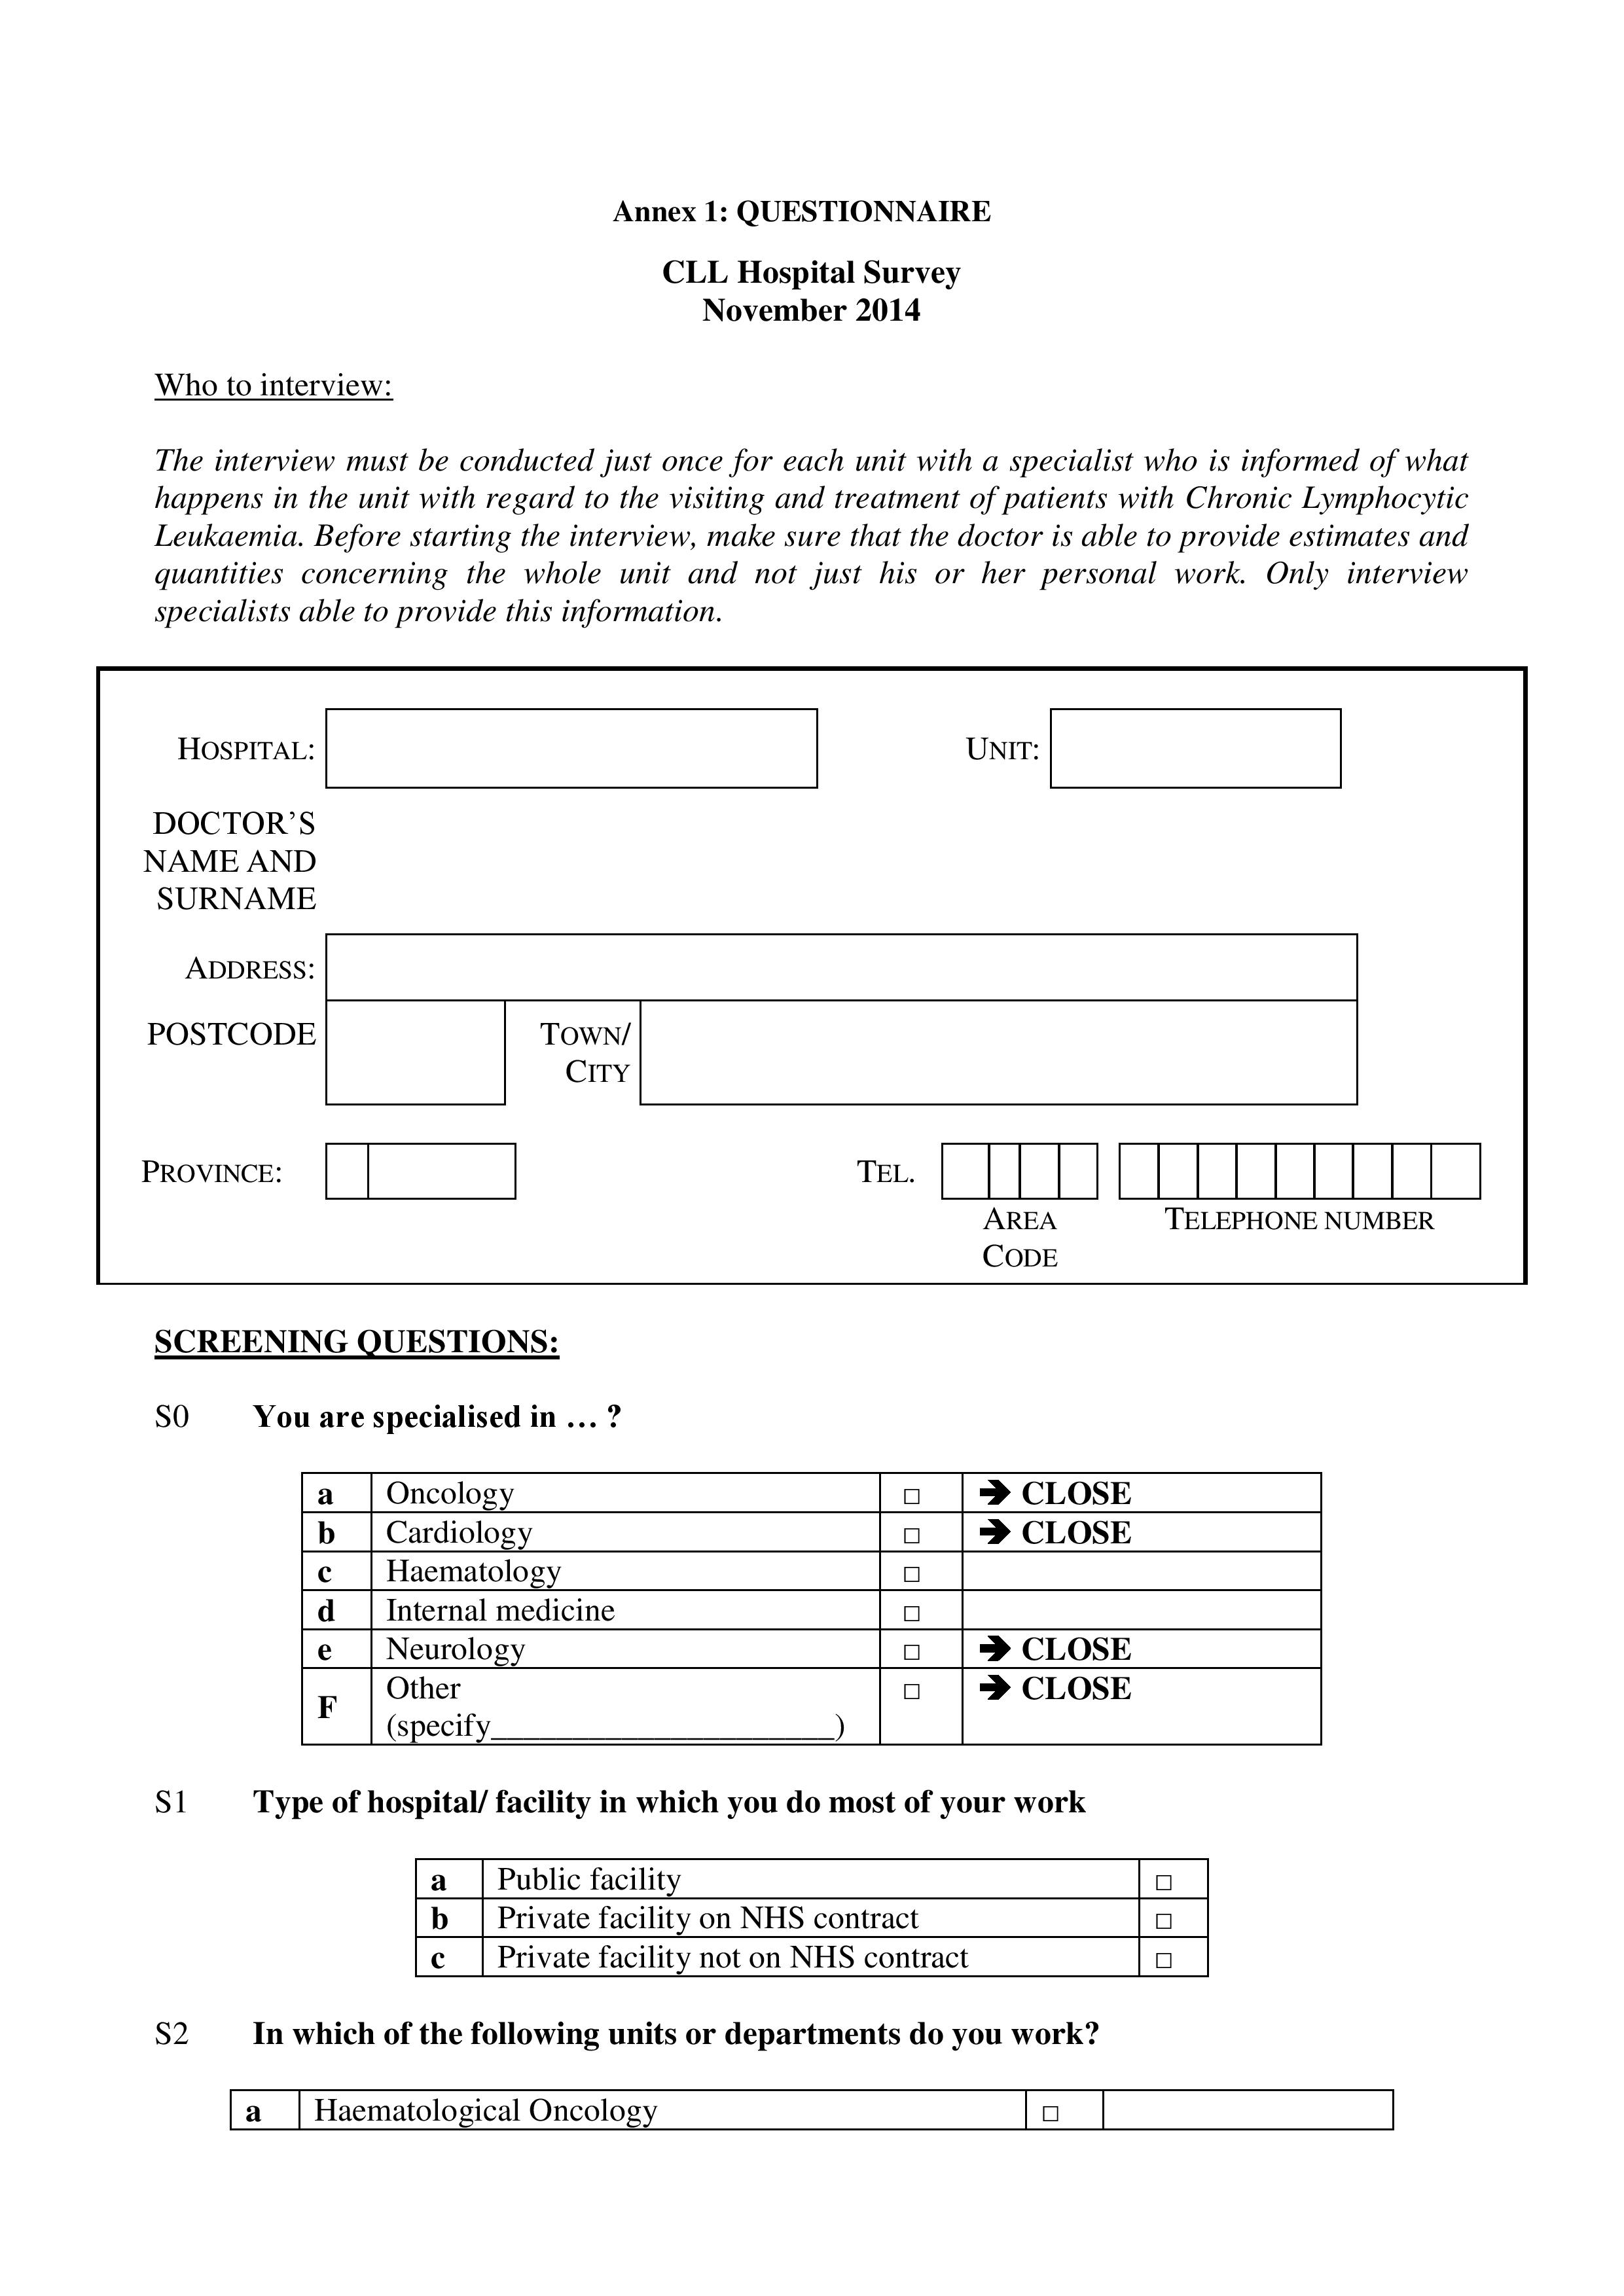
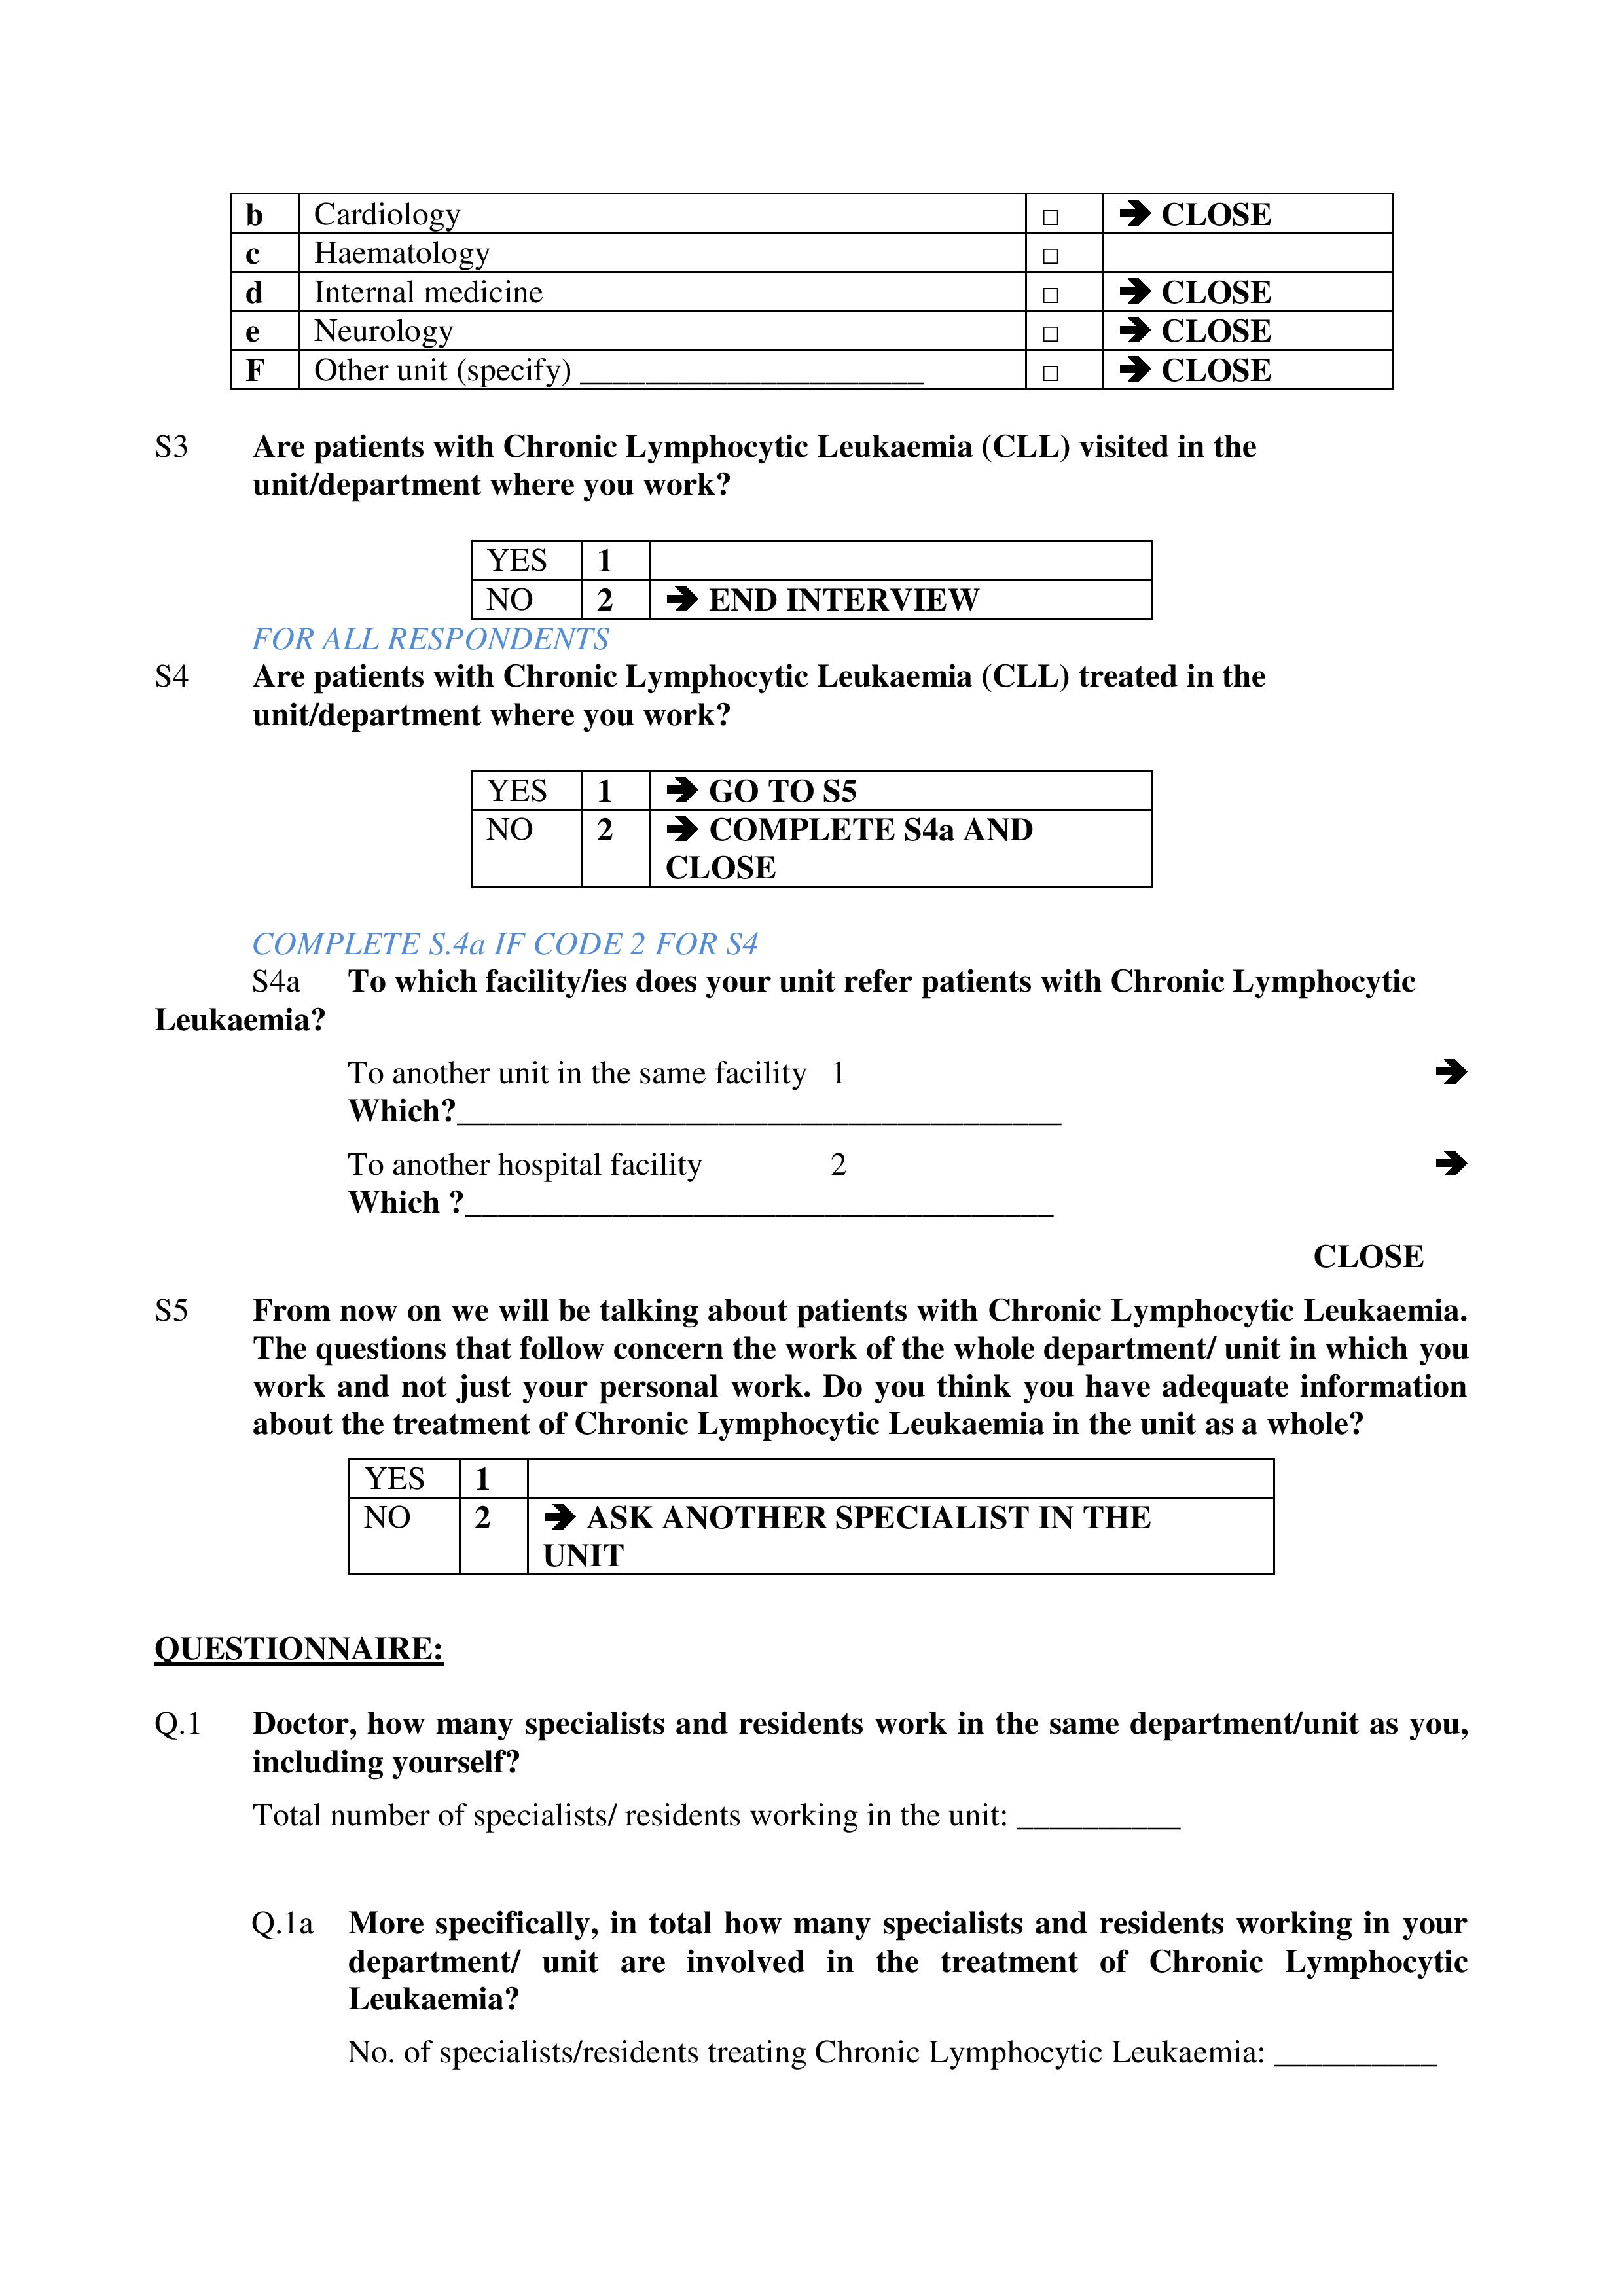
Materials and Methods
The data was collected using a questionnaire containing questions of interest (Annex 1A,1B,1C,1D,1E,1F,1G).
These questions concerned the overall numbers and percentages of
patients visited/treated, rather than specific patients. In short, the
questionnaire included the following items:
- The characteristics of the hospital facility
- The number of specialists working in the unit
- The number of specialists in the unit treating CLL
- The number of patients with CLL visited in the unit over the previous 12 months
- The number of patients with CLL visited in the unit over the previous month
- The percentage of patients diagnosed over the previous 12 months
- The percentages of patients in the various Binet stages A, B and C
- The mean visit frequency for the different Binet stages
- The percentages of patients in the different age ranges
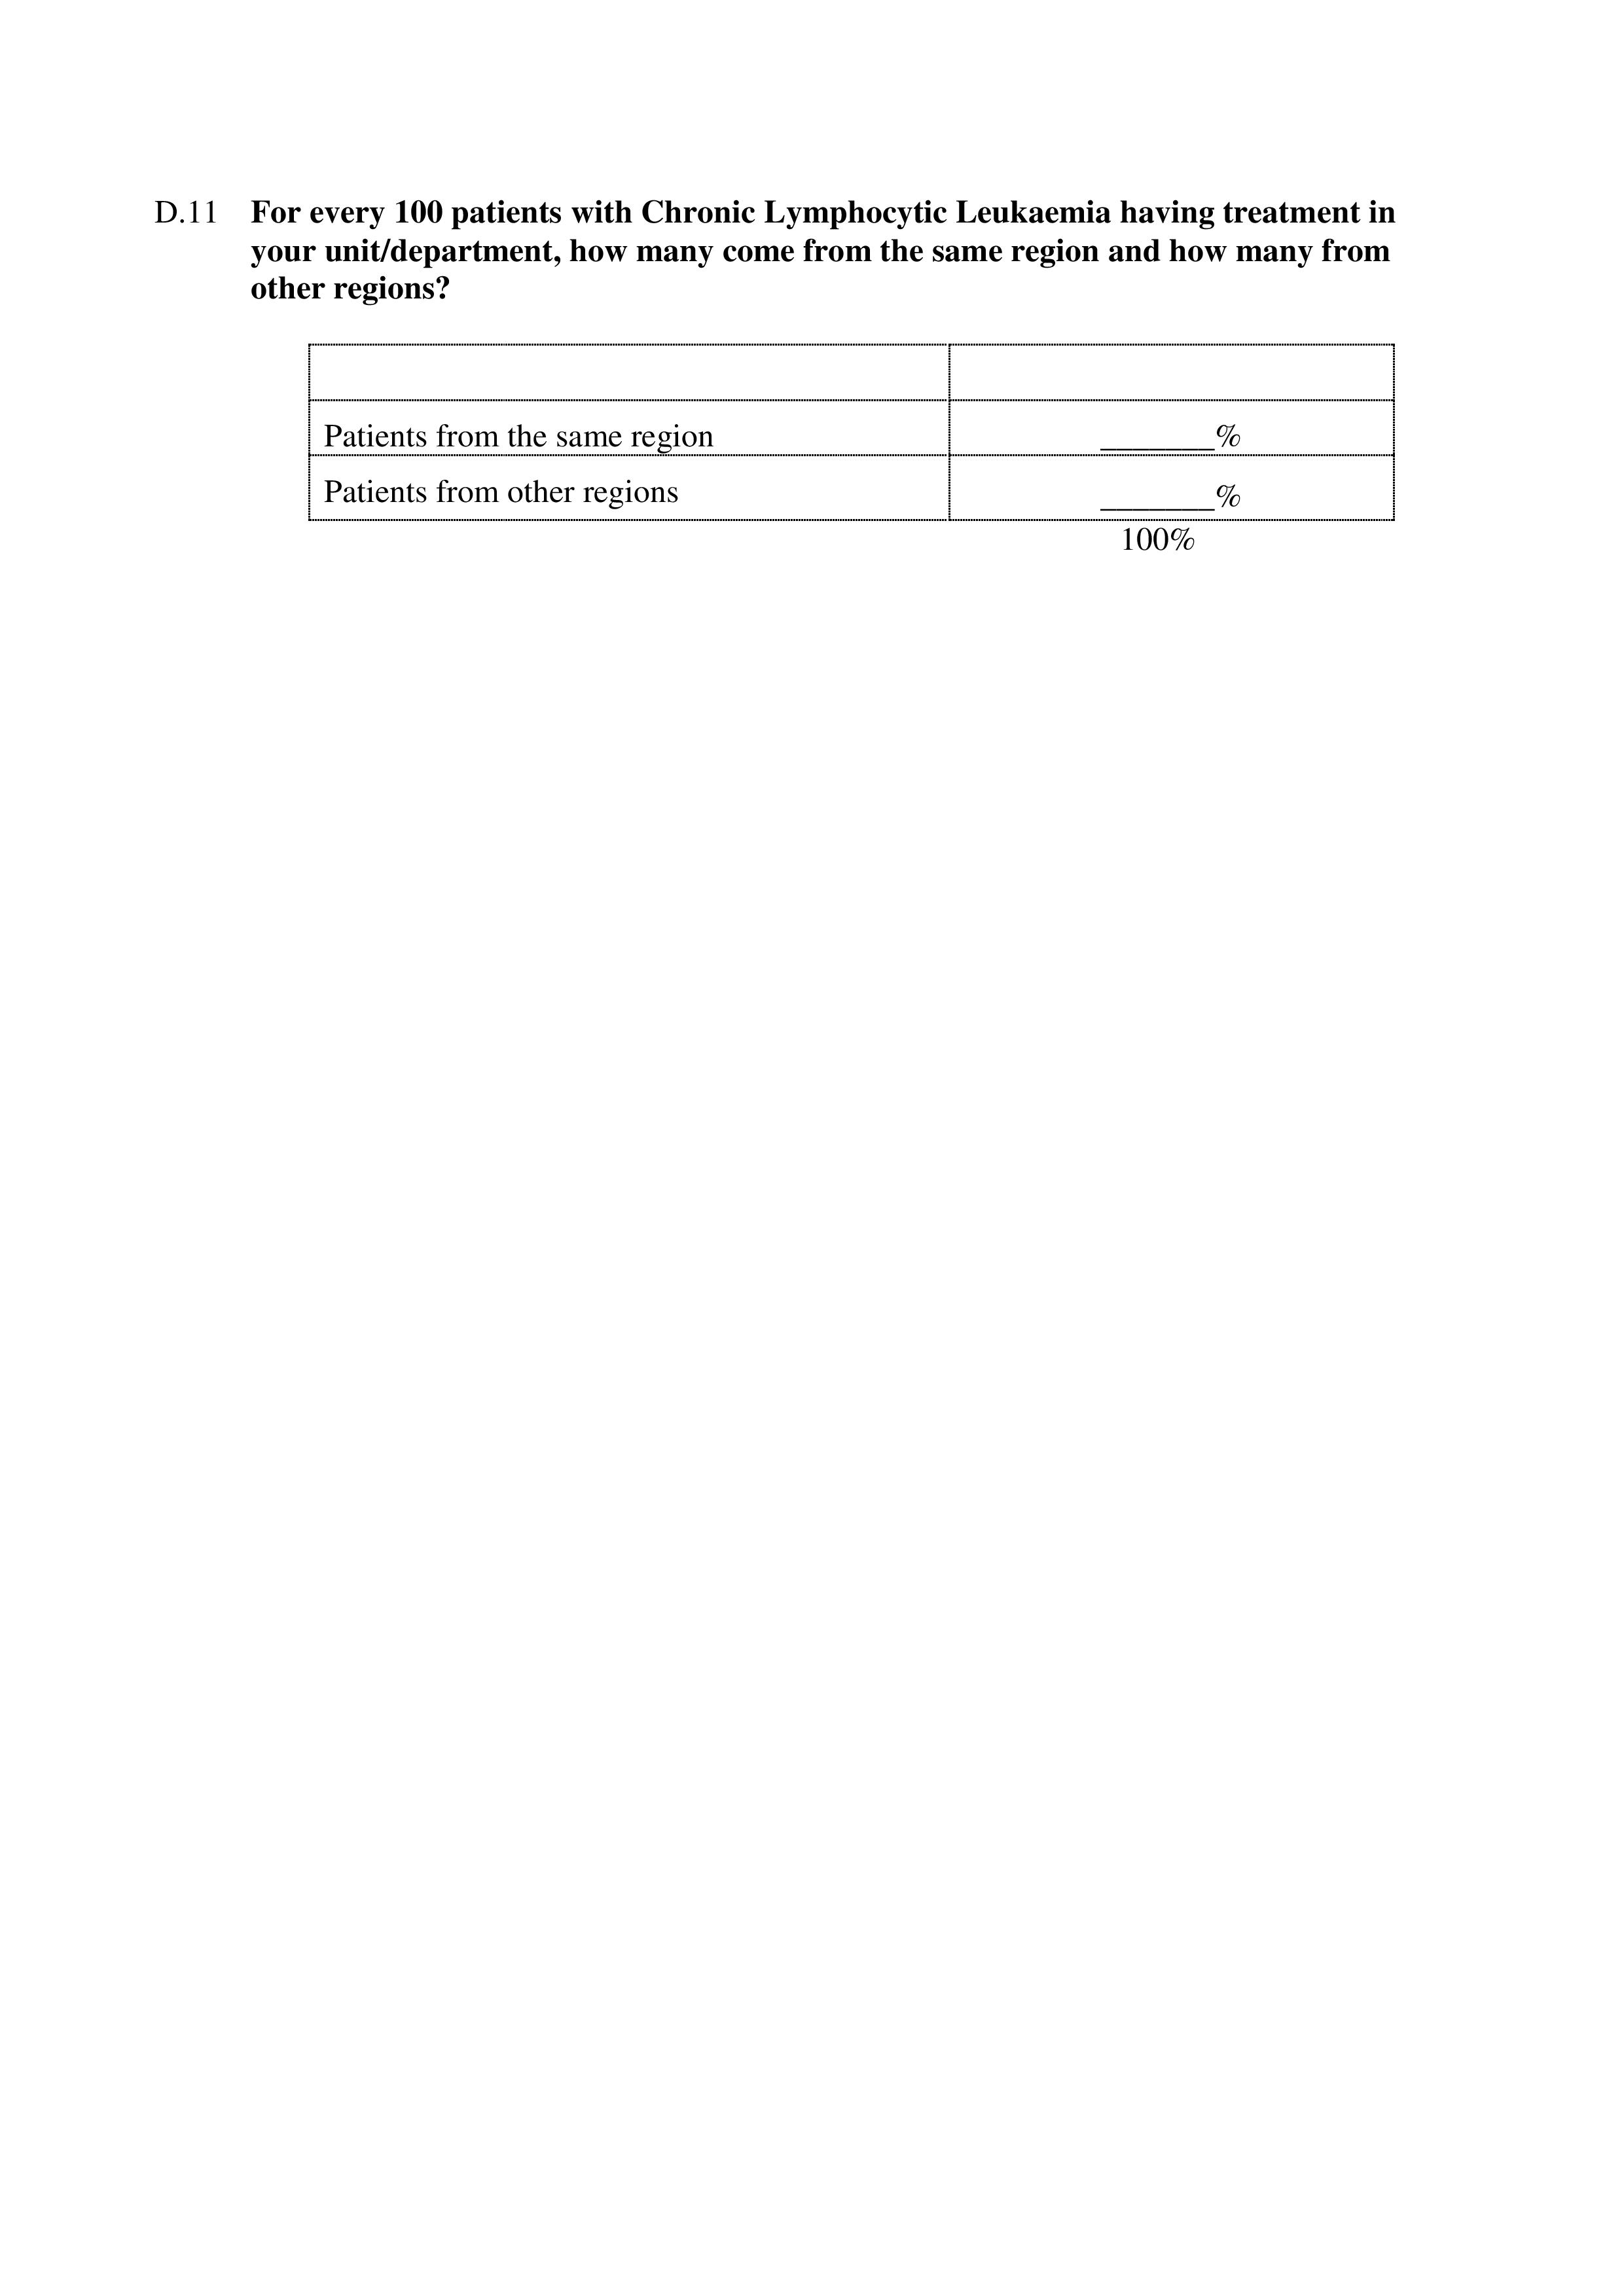
- The percentages of patients from other regions (migration)
- The percentages of patients in the different treatment lines
- The distribution of the treatments administered over the different treatment lines outside clinical studies
- The therapeutic objectives in the different treatment lines
- Use of the CIRS scale and calculation of the score obtained
The
choice of the population of facilities to be contacted focused on
Haematology units (initial list of 204 centres), excluding internal
medicine and general medicine facilities. This choice, which was due
primarily to the limited concentration of patients with CLL in these
units, most likely makes the final projections an underestimate.
In
order to collect reliable data concerning the whole unit, it was
essential to identify an appropriate contact person to be interviewed.
Consequently, the initial screening of the questionnaire included a
specific question asking whether the respondent was able to provide
data for the facility as a whole. In addition, for the haematology
units with a presumably higher number of patients, the authors used a
list of specialists who are known to be a reference point for the
treatment of CLL in their units.
The information on the number of
patients with CLL visited at the facility was sought in two different
ways: for the previous month and for the previous 12 months, specifying
which of the two values should be considered more reliable and whether
this value was based on the data available or on a personal estimate.
This made it possible to correct the values provided according to the
following criteria, in order to obtain a better estimate of the number
of patients visited over the previous 12 months:
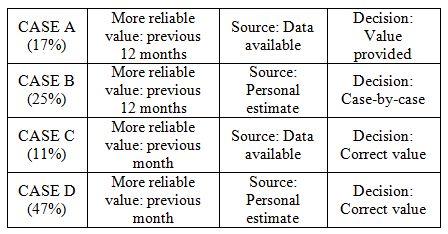 |
The facilities that provided effectively available data
(cases A+C) rather than personal estimates were a minority; however,
these facilities are concentrated amongst those treating a higher
number of patients (on average, 111 patients over the previous 12
months vs. 79 in cases B+D).
The correction was performed using an
algorithm that, starting from the number of patients visited in the
previous month (considered more simple to quantify in the absence of
other information), projects the annual value taking into consideration
the mean frequency of patient visits in each of the Binet stages (Annex 2).
It
is important to point out that the correction, in most cases, did not
significantly influence the 12-month estimates declared during the
interview and that in all produced a 7% reduction in patients.
The
B cases were examined individually because they were more uncertain;
when values provided and corrected values were discordant the centres
were re-contacted and verification interviews performed with another
contact person. More generally, the same approach was taken for
structures that had provided inconsistent or unrealistic values.
Overall, a double-check was performed on approximately 30% of
facilities.
The interview was conducted by telephone and only in a
few cases in person and always subject to appointment; during the first
contact the respondent was told about the aims of the study,
emphasising the need to collect reliable data on the treatment of CLL
at the facility. The interviews were conducted by specialised personnel
with consolidated experience in the medical field. The survey lasted
approximately 4 months, from November 2014 to February 2015.
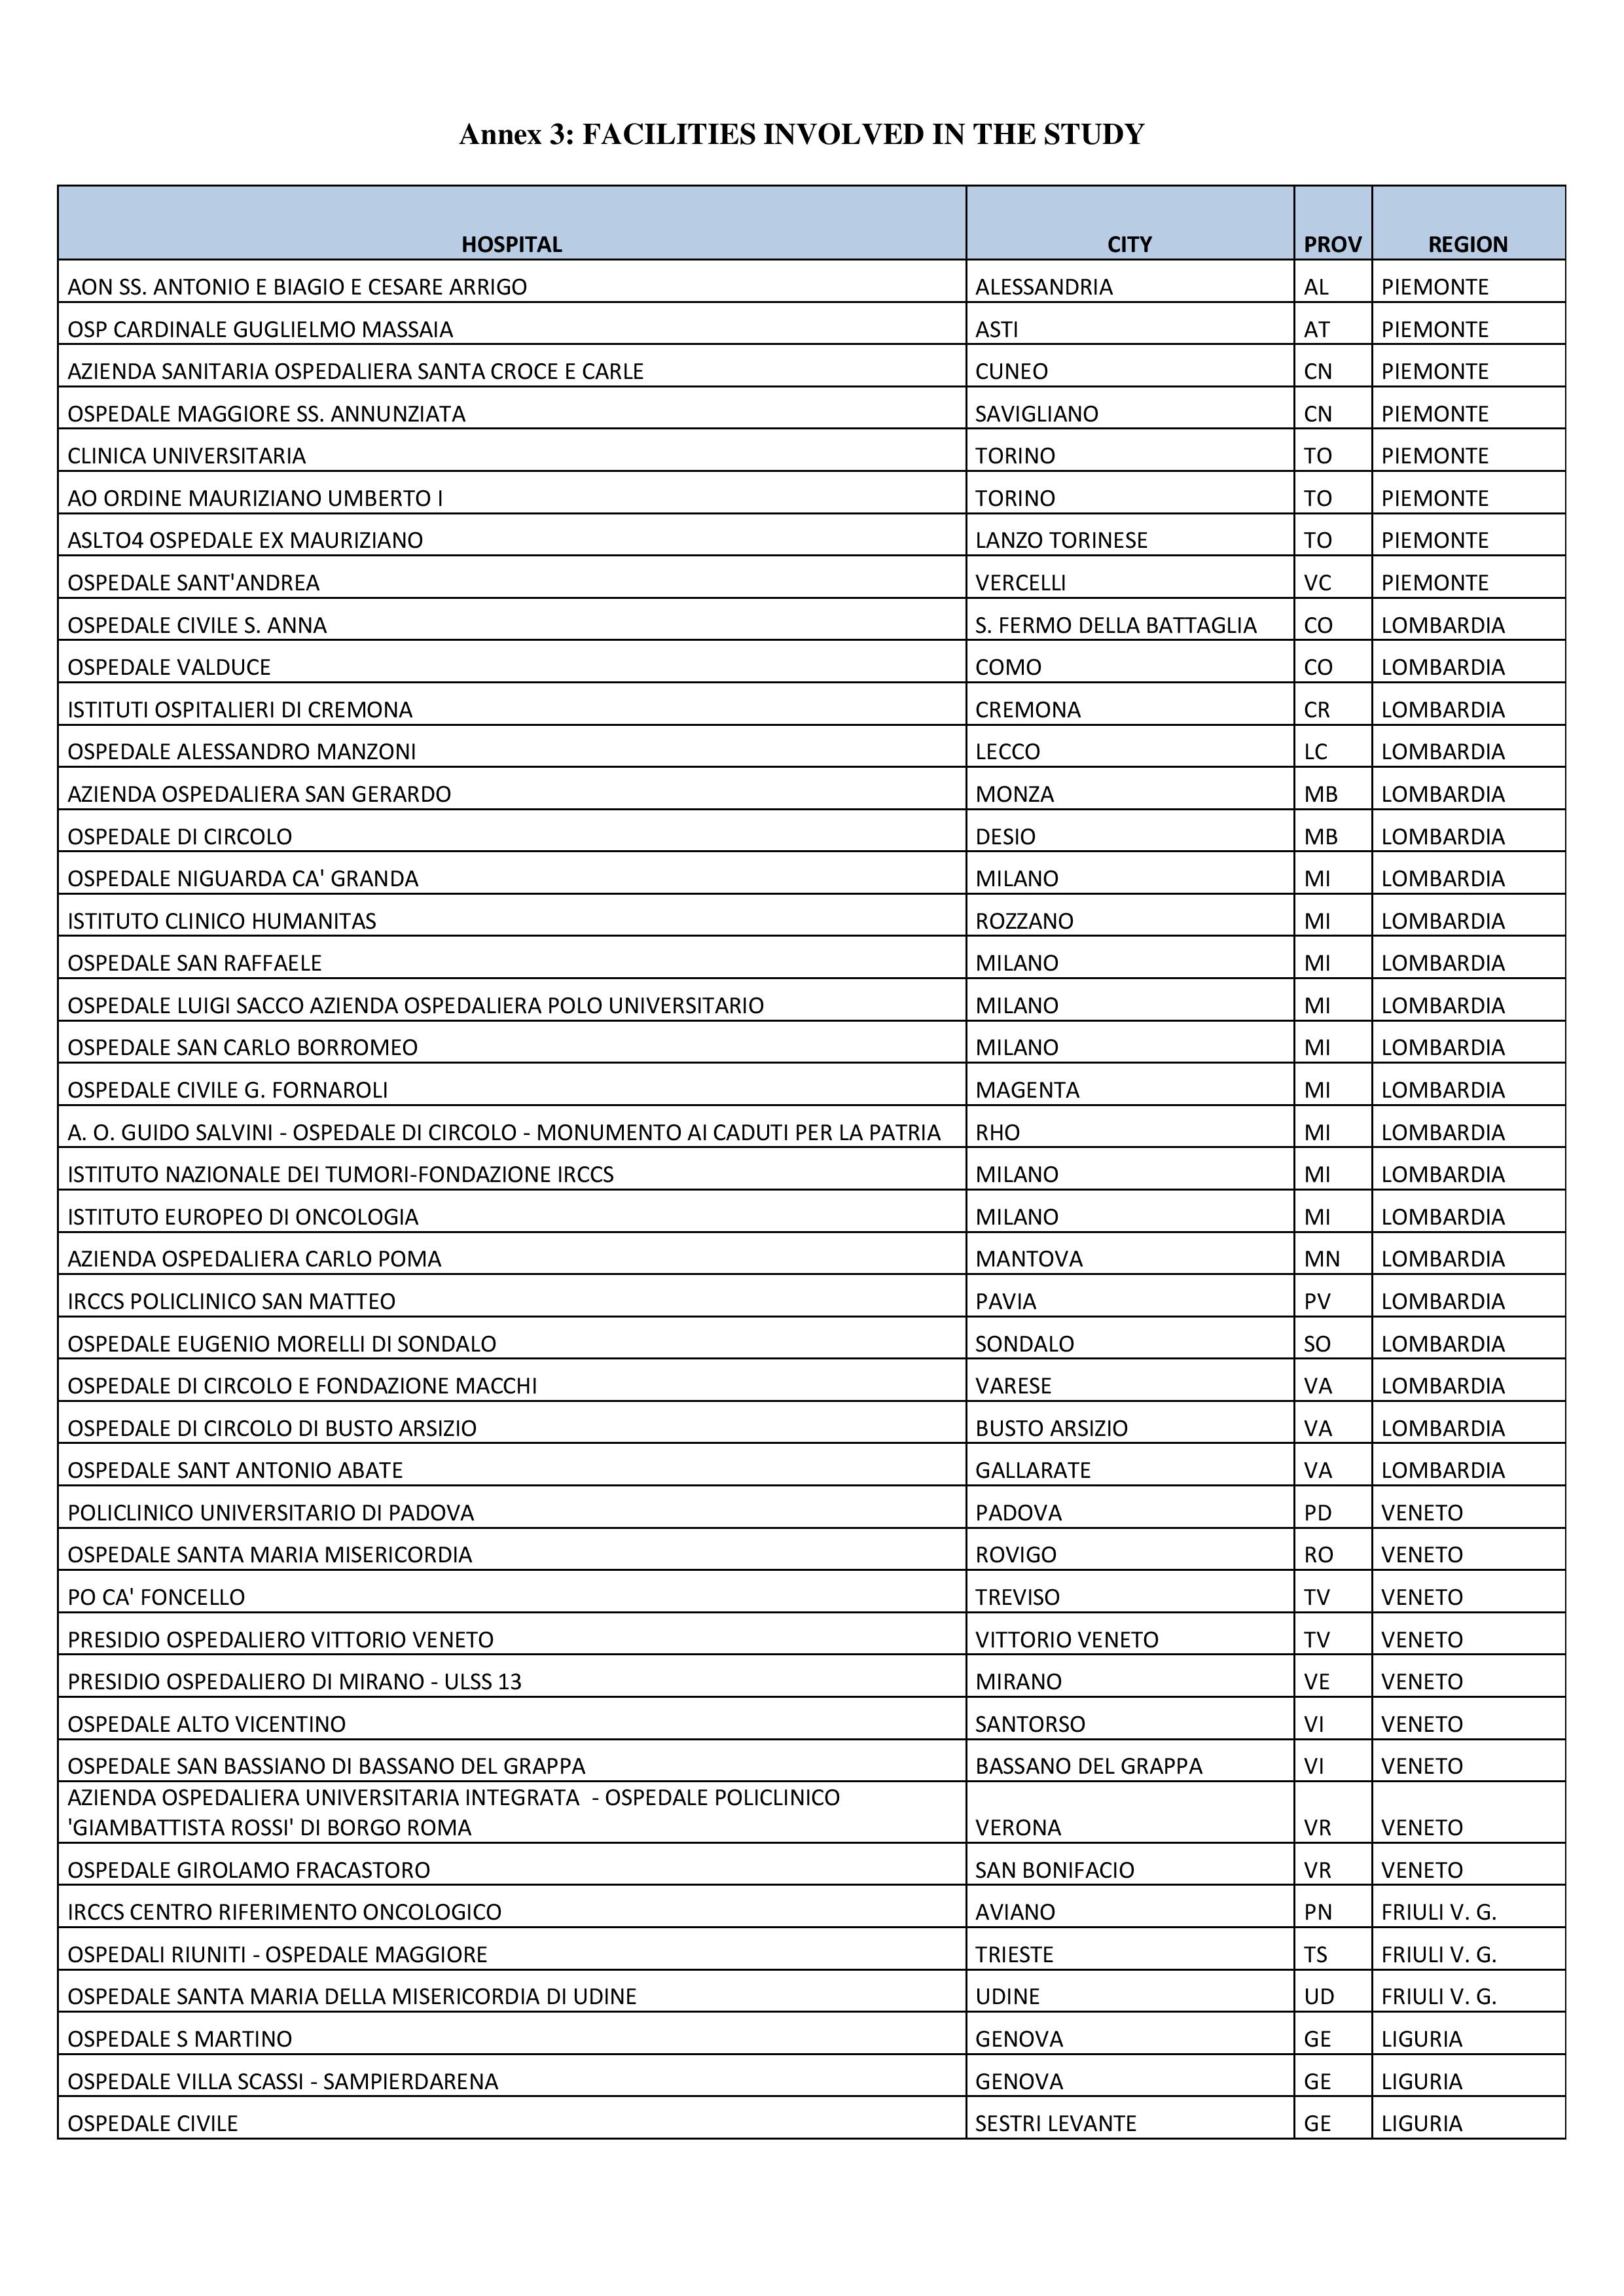
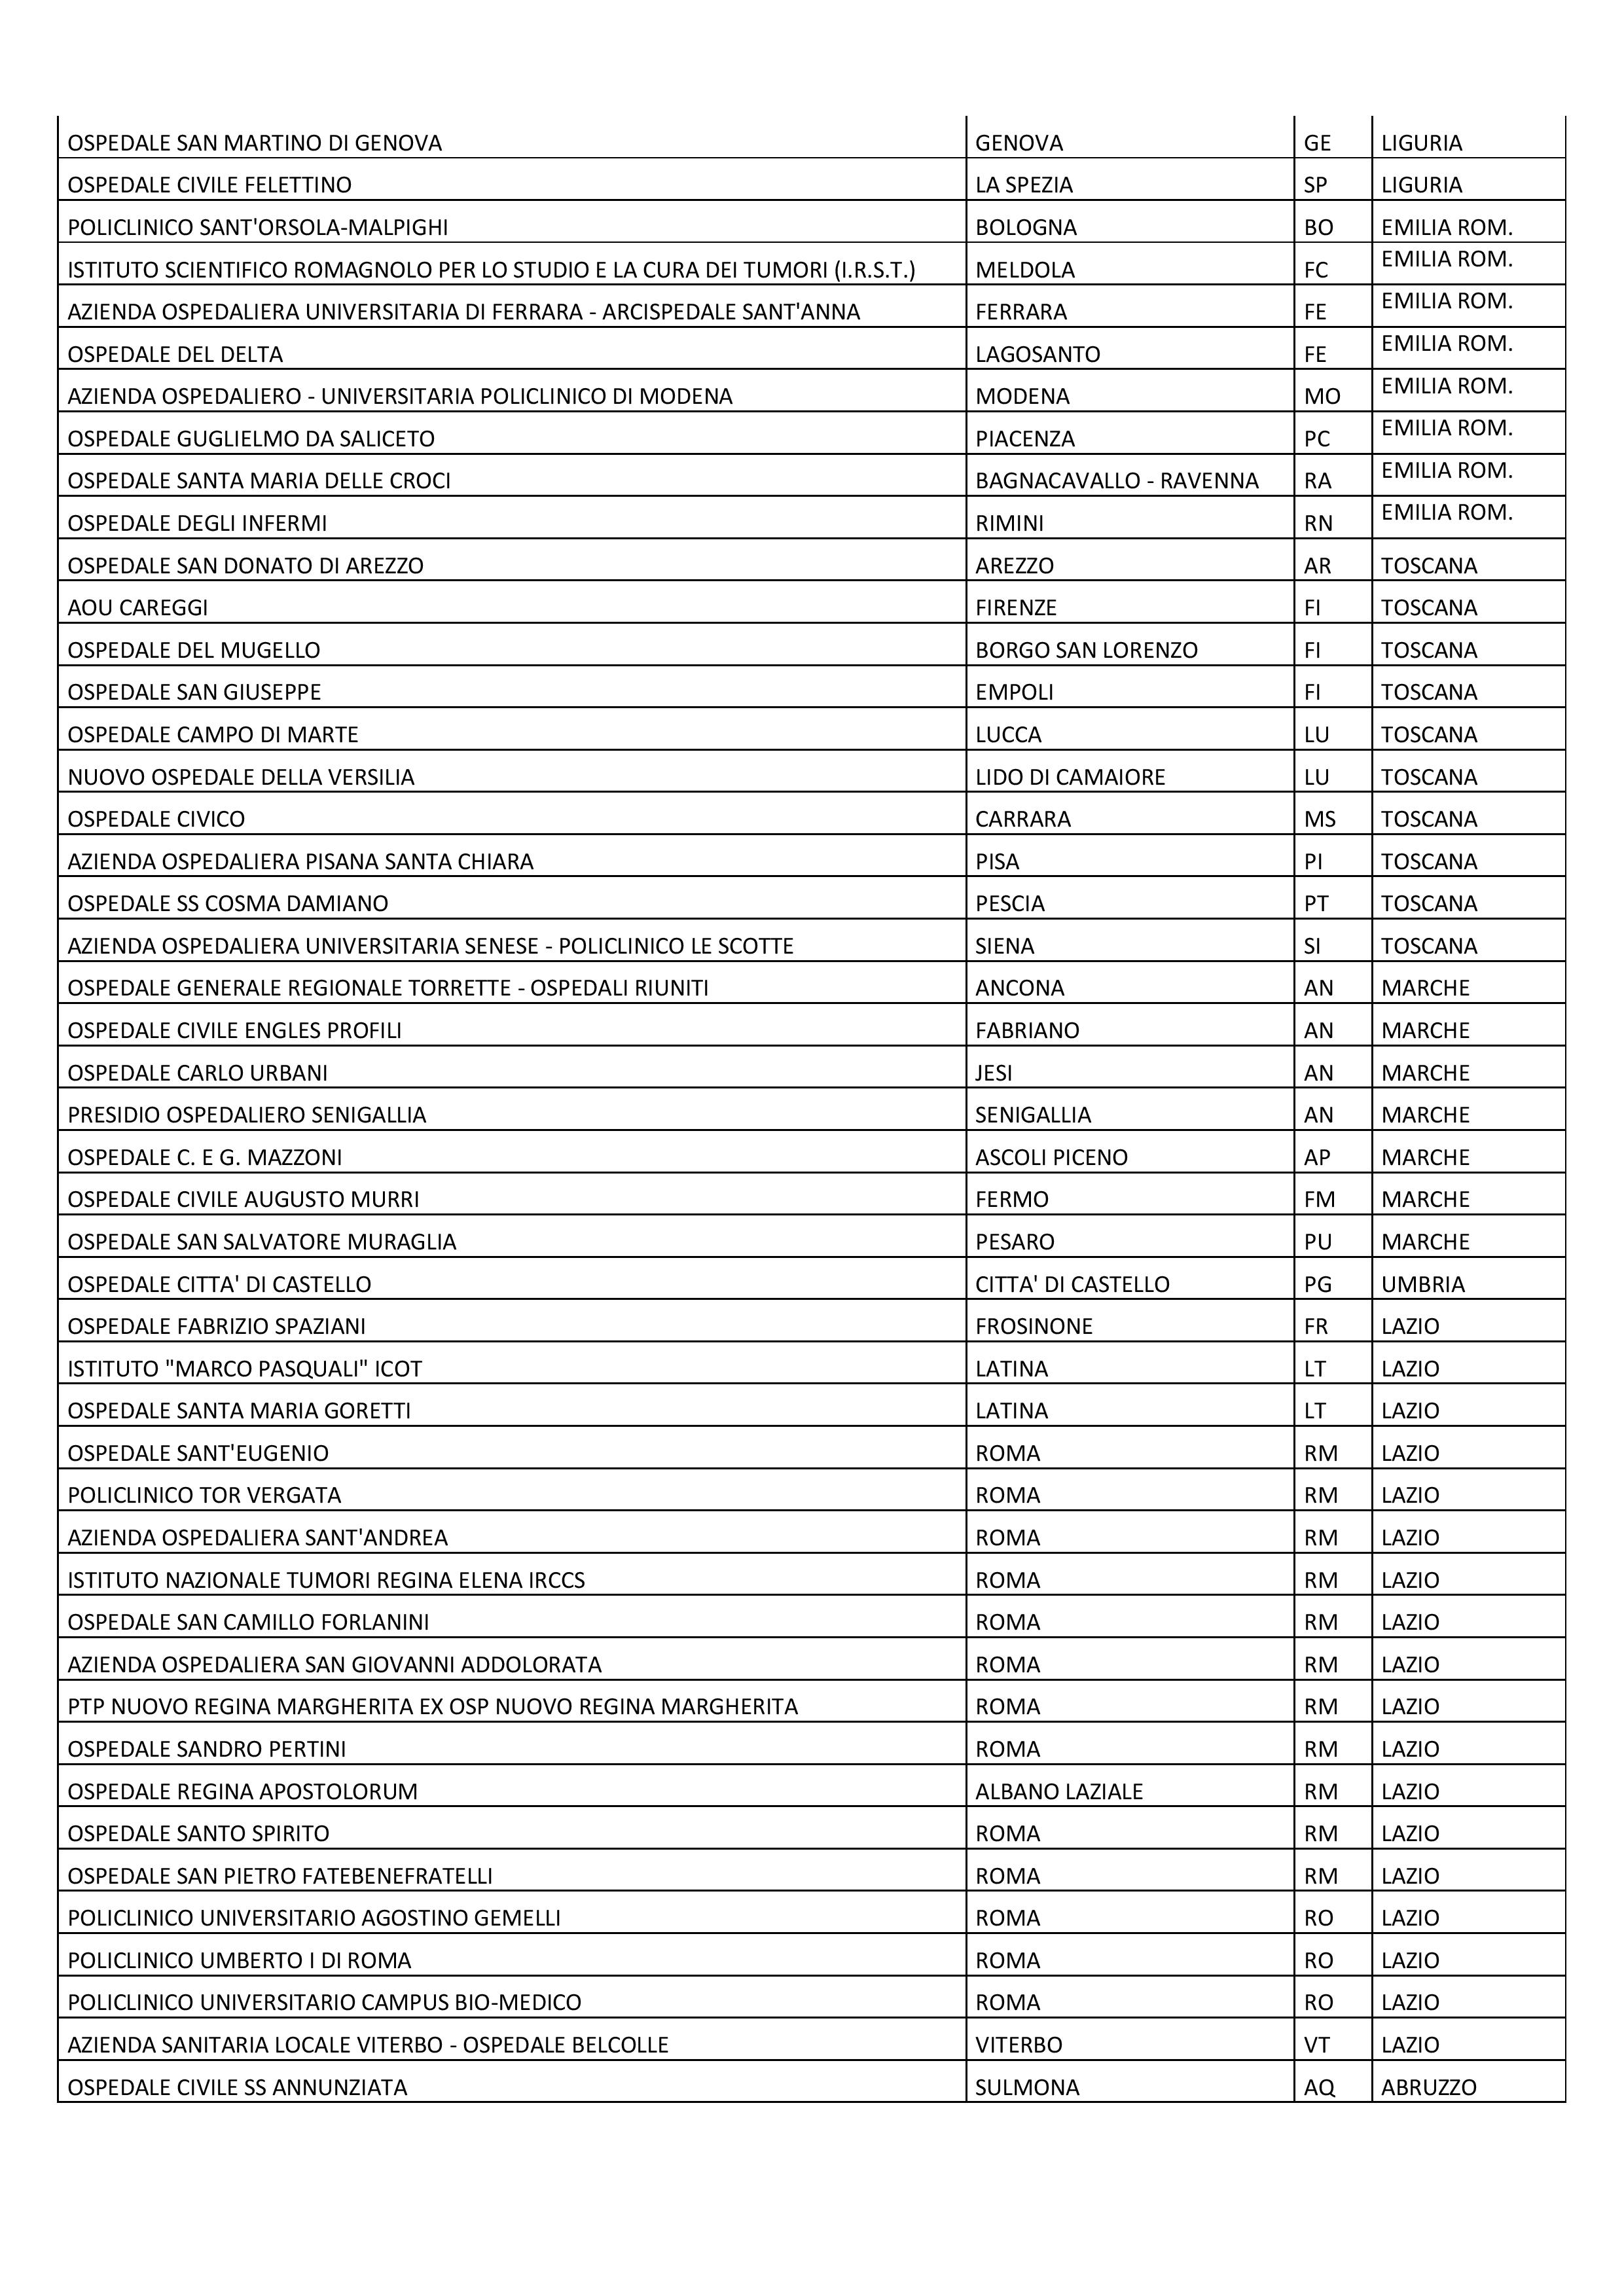
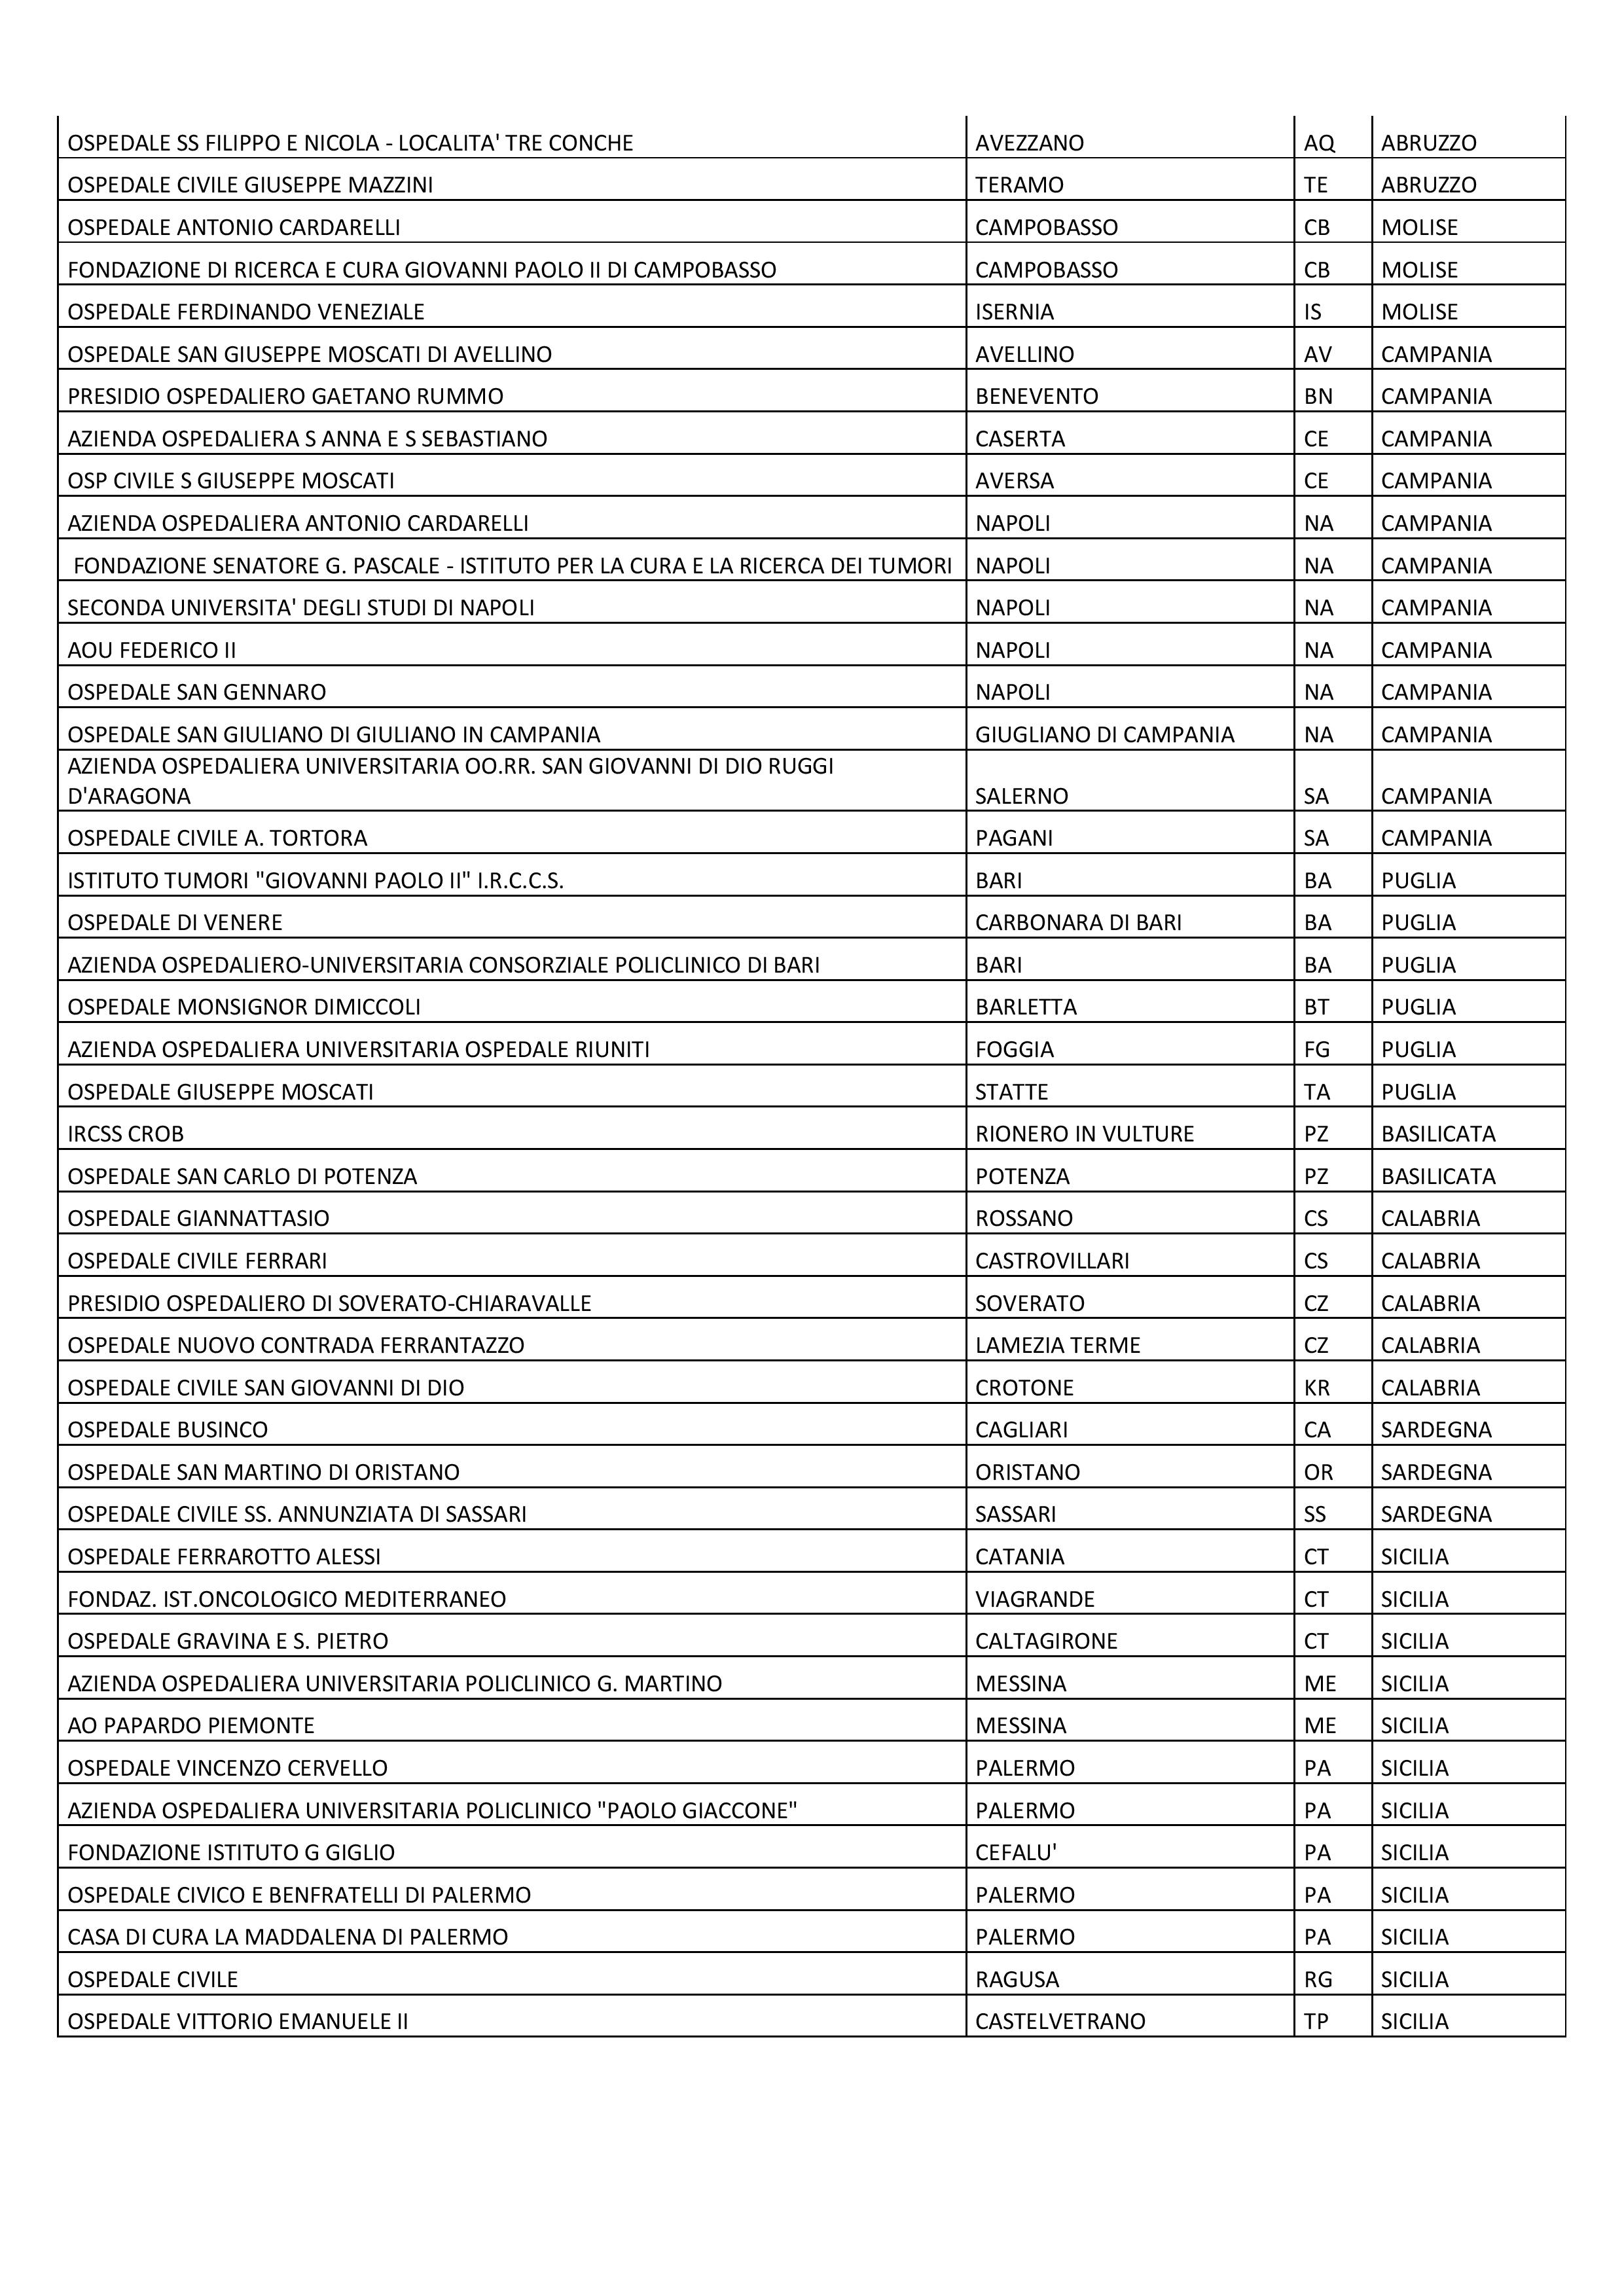
The
final projections for the universe of haematology units were performed
by considering the size of the 68 centres that refused the interview by
dividing the facilities (Annex 3A, 3B, 3C) into four ranges according to the number of
beds.
Results
Estimate of the number of patients.
Overall, in 136 out of a total of 204 facilities identified (of which 5
did not administer treatment), the number of patients with CLL visited
in the previous 12 months was 11,526 units; if this number is projected
over the entire population of haematology units, we obtain an estimate
of 17,044 patients (28 cases every 100,000 inhabitants).
In order
to evaluate this value, it is necessary to consider the possibility
that the same patient may, during the year, have been treated at more
than one centre. From this point of view the information collected
concerning healthcare mobility can be of help: on average, 15% of
patients visited in a facility lives in a different region to that in
which the unit is found. These patients are more likely to be visited
also in a centre in their home region.
The projection of the
diagnoses of CLL made in the previous 12 months was 2,966 patients (4.9
cases every 100,000 inhabitants), equal to approximately 17% of the
whole. Newly diagnosed patients are particularly prone to
double-counting, as the diagnosing facility in many cases is different
to that in which the patient is subsequently treated. We therefore
believe that the effective percentage and number of new diagnoses is in
actual fact significantly lower.
At hub centres, which see a higher number of patients, the percentage of new diagnoses was higher.
The
units contacted that treat CLL, employee an average of 8-9 specialists
and residents (median =7), of whom approximately half deal actively
with the condition (median = 3).
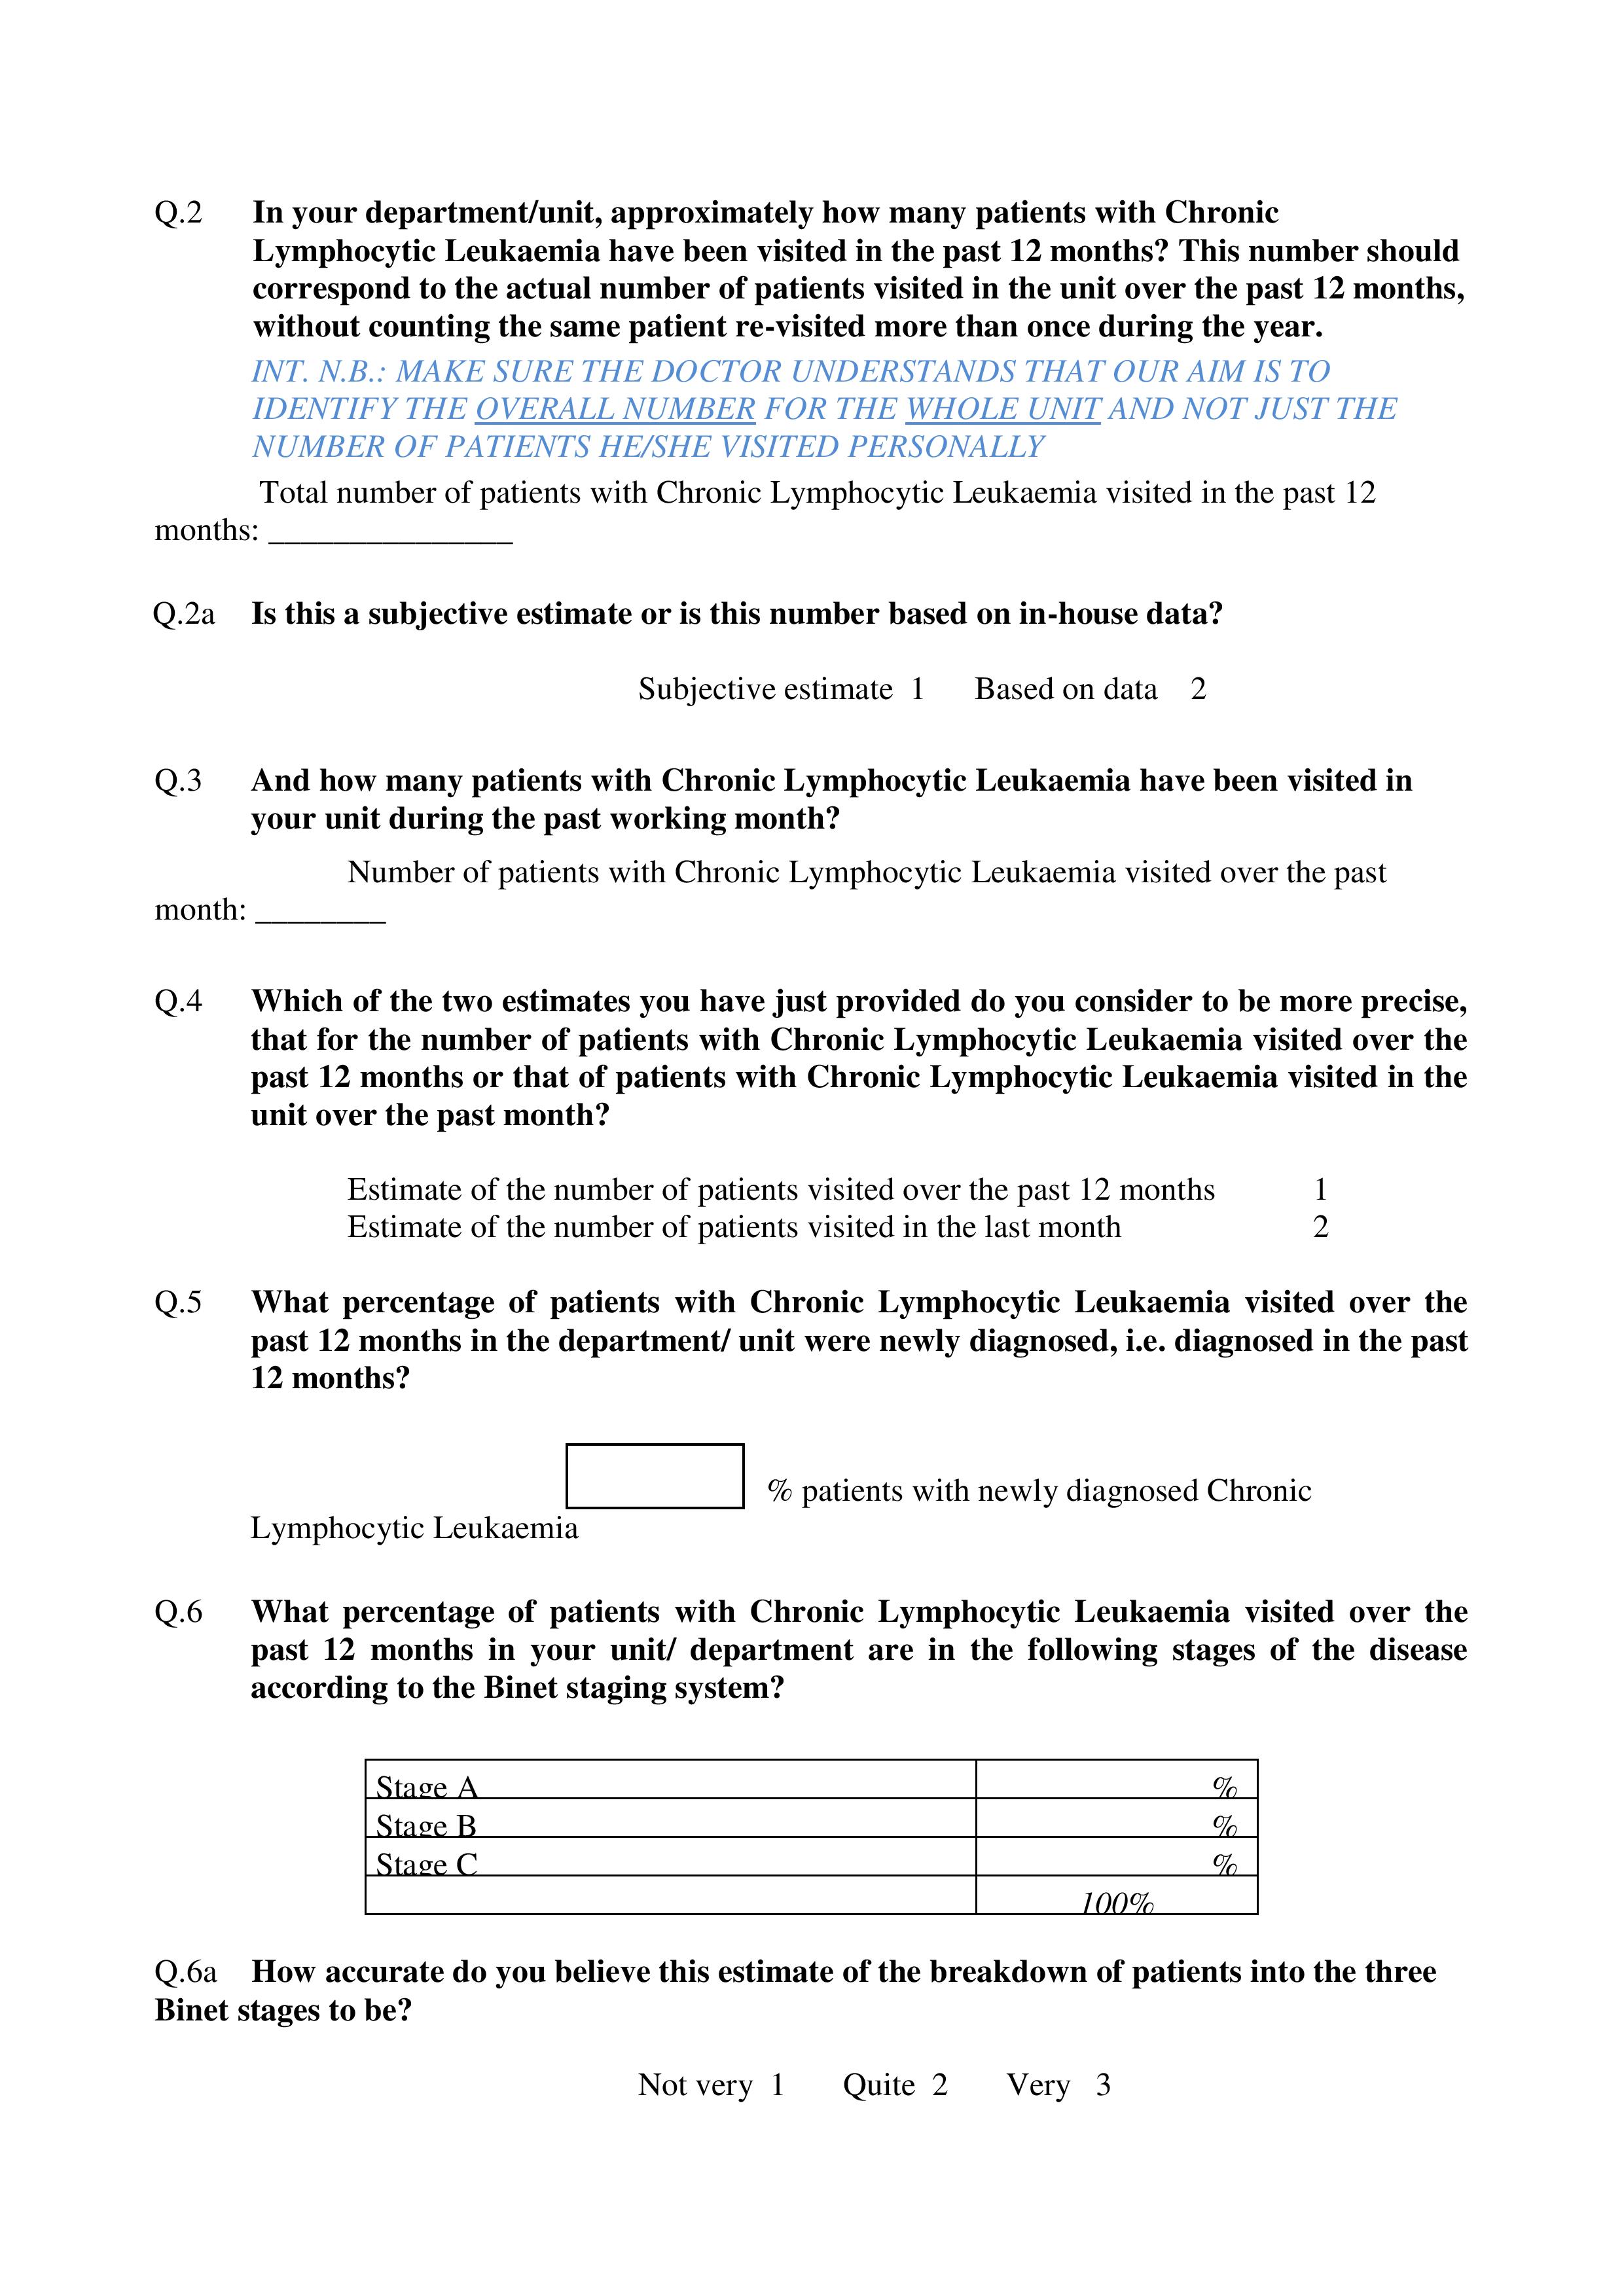
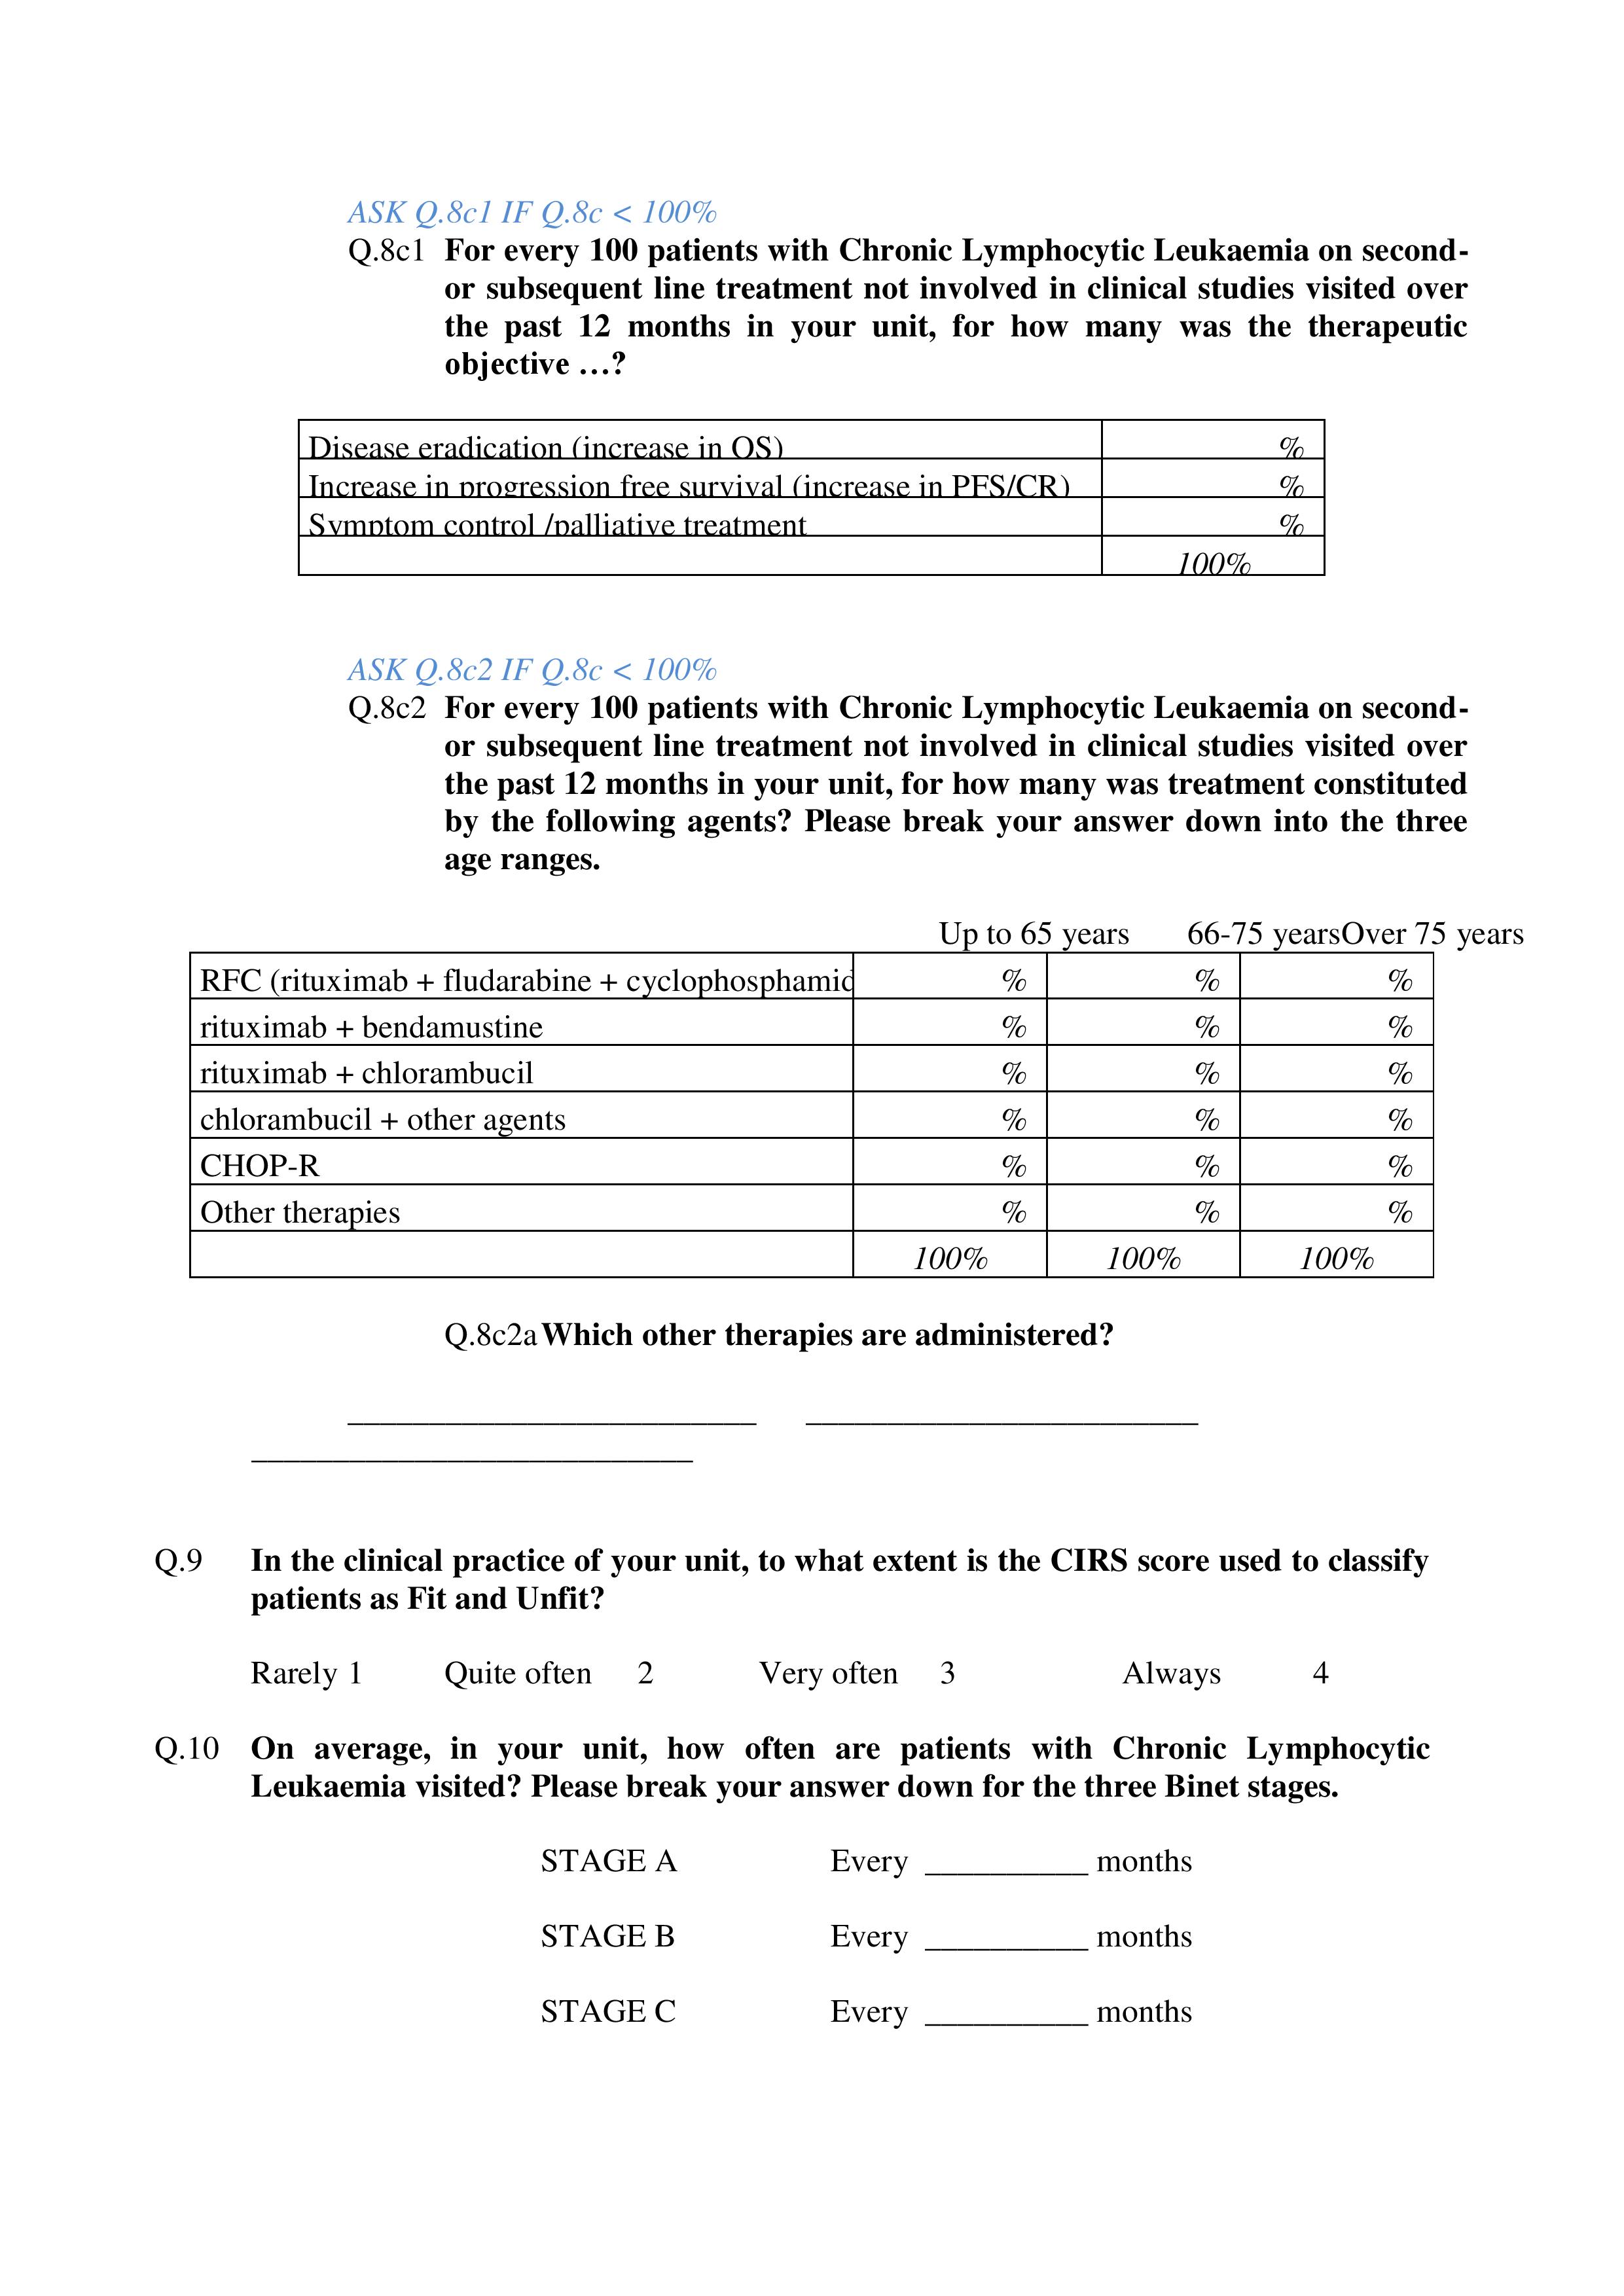
Binet stages.
The specialists interviewed were asked to break down the patients
visited over the previous year at the facility according to Binet
stage: in all (figure 1),
approximately half (53%) of the patients were in stage A (seen on
average every 5-6 months), 29% were in stage B (seen on average every
3-4 months) and 18% were in stage C (seen on average every 1-2 months).
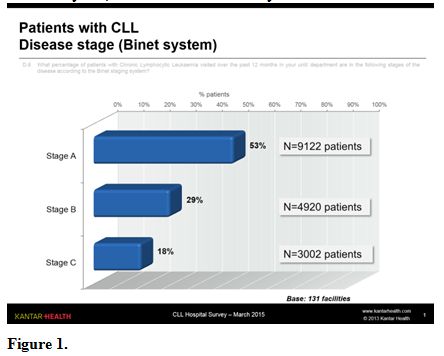 |
Figure 1. |
It is likely that, compared to the total population of patients
with CLL, the weight of patients in stage A is underestimated because
these patients, apart from the diagnosis phase, are seen even less
frequently than once a year, in which case they were not counted.
For
the same reason, the visit frequency of patients in stage A is probably
overestimated compared to the total number of patients in stage A.
Age ranges.
Age is one of the most influential variables in patient evaluation and
the choice of treatment: of the three age ranges (up to 65 years, 66-75
years and over 75 years) used in the questionnaire, the most common was
the intermediate range (41%, approximately 7000 patients). The patients
who for the treatment of CLL are usually defined “young” (up to 65
years) account for approximately one quarter (figure 2).
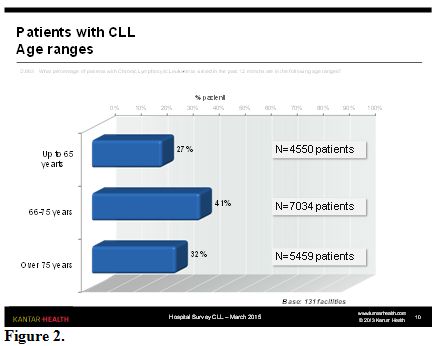 |
Figure 2. |
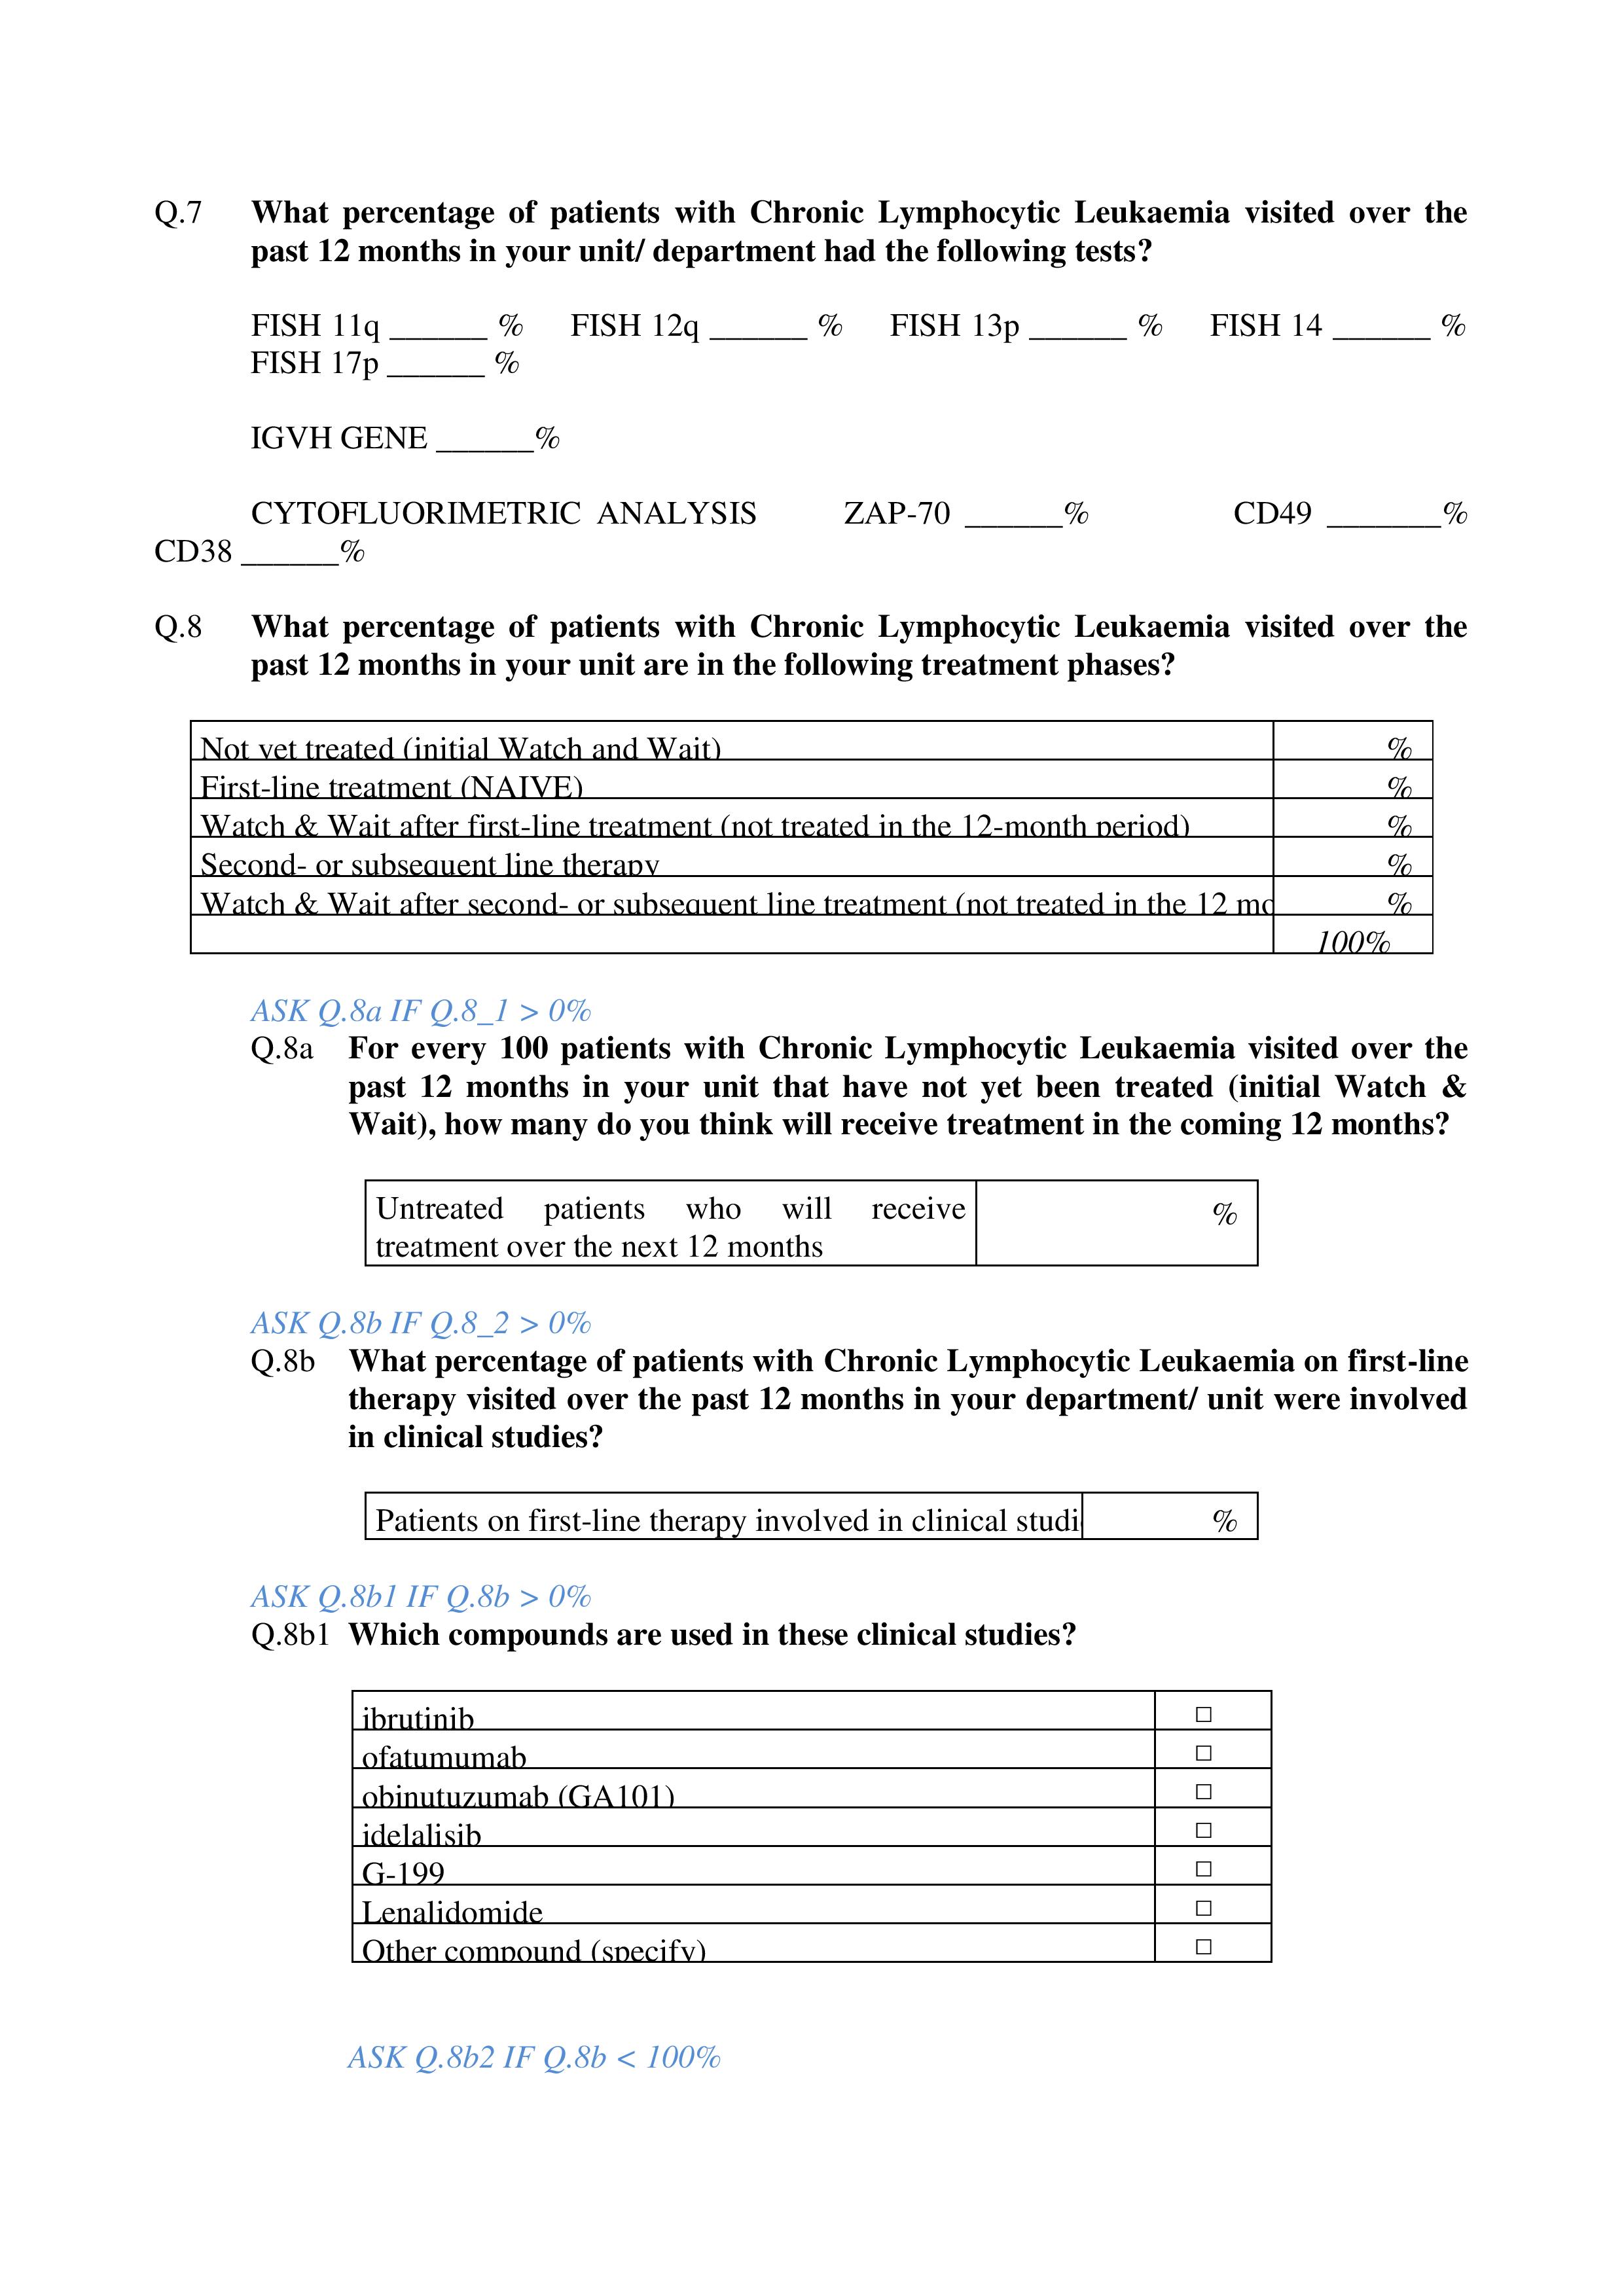
Test.
It was estimated that approximately half of the patients visited over
the previous 12 months had each of the different cytogenetic tests (figure 3),
with a slightly higher frequency only for 17p deletion, which is more
selective for therapy. GENE IGVH, with FISH +12, was the cytogenetic
test less frequently performed.
Of the various flow cytometry
tests, the conventional CD38 test was used, whereas use of the CD49d
test was still somewhat limited.
Treatment lines. 40% of patients
with CLL seen during the previous 12 months was awaiting initial
treatment (Watch & Weight); if we also exclude patients in
follow-up after first- and second-line treatment, we see that
approximately one third of patients was on treatment: in all
approximately 5,500 patients, just over half of whom on first-line
treatment (figure 4).
The
doctors interviewed estimated that, on average, approximately 20% of
W&W patients will start treatment in the next 12 months.
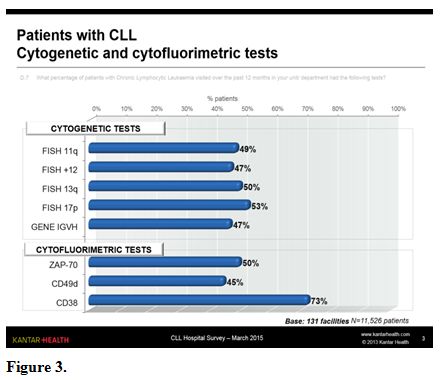 |
Figure 3. |
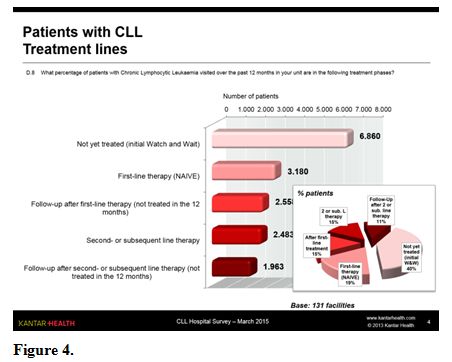 |
Figure 4. |
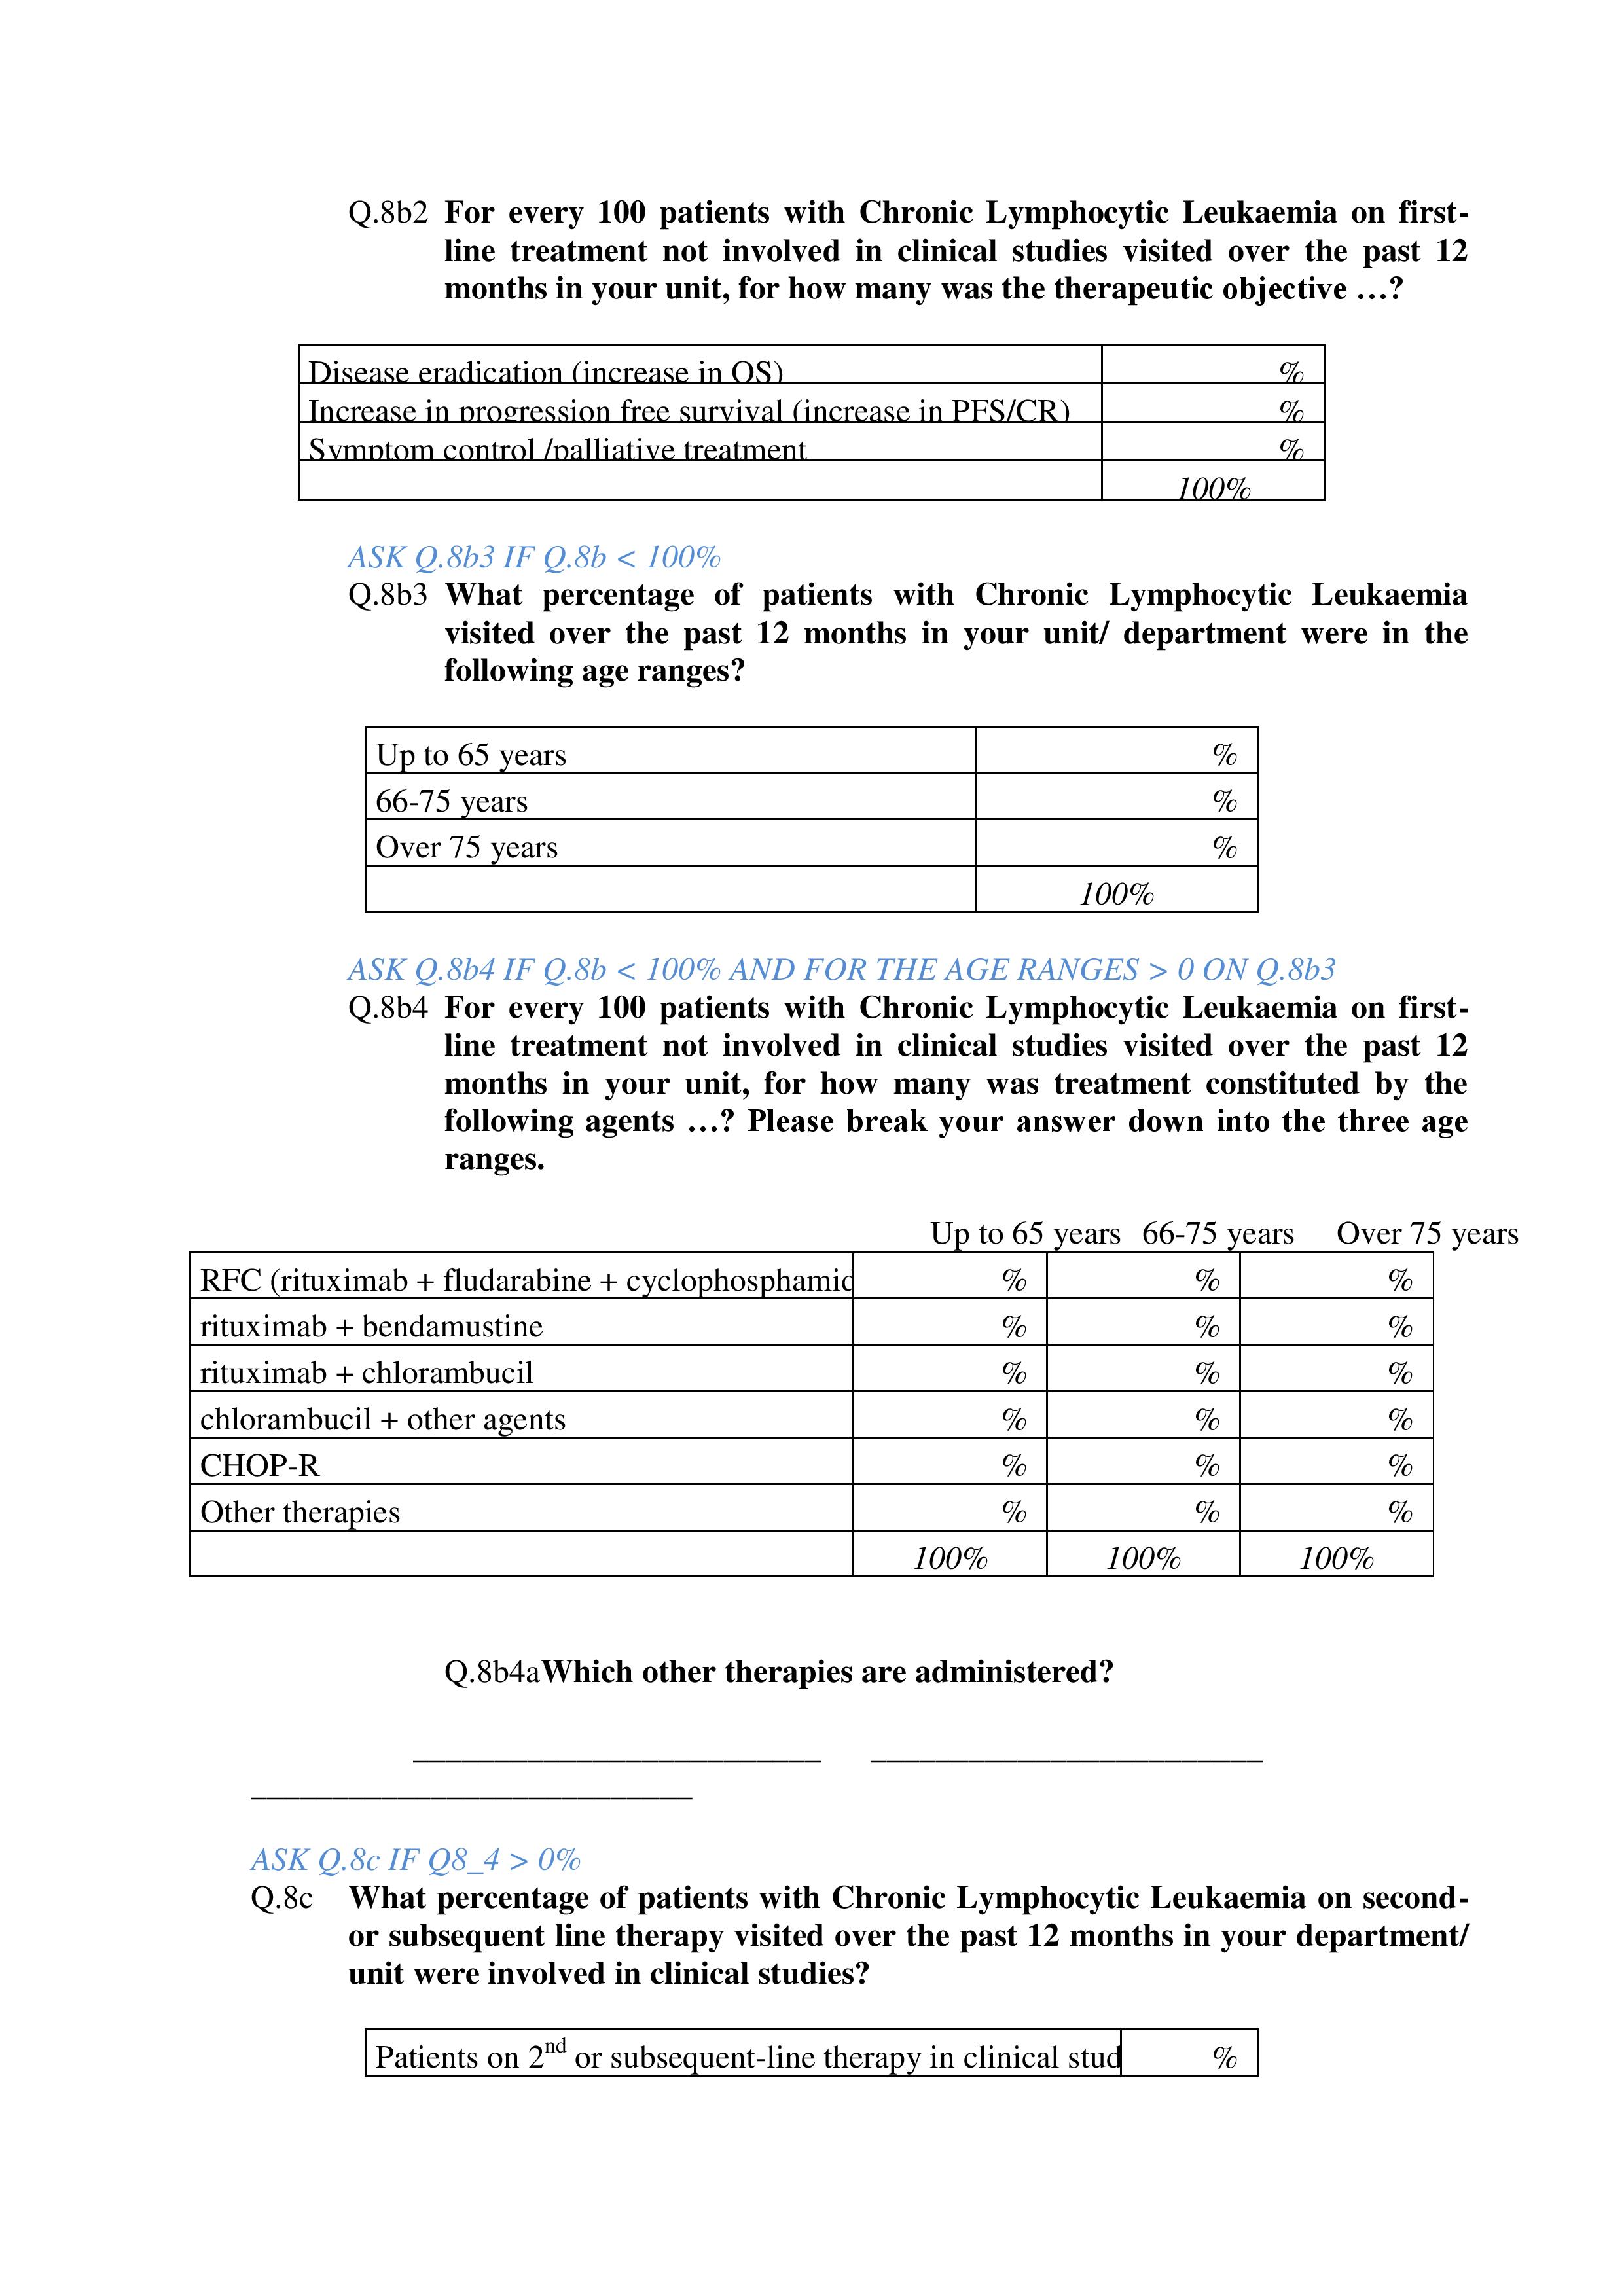
Treatments administered.
We then collected the distributions of the pharmacological treatment
administered in the unit to patients visited in the previous year,
making a distinction between the three different patient age ranges: up
to 65 years, 66-75 years, over 75 years.
First-line therapy. By
excluding the 8% of patients involved in clinical studies, the
treatments administered as first-line therapy (figure 5) are greatly
concentrated on RFC (Rituximab - Fludarabine - Cyclophosphamide) in
young patients (73%) and on R-Benda (Rituximab - Bendamustine) in
patients aged between 66 and 75 years (63%). For older patients, with
poorer general conditions, treatments with Chlorambucil (in combination
with Rituximab, but also in monotherapy and in combination with other
drugs) are very common; the percentage of patients treated with R-Benda
drops in this case to 29% (as shown in the rituximab + bendamustine
chart in figure 5).
The
therapeutic objective of first-line treatment is, with a similar
frequency (41%), increase in OS or increase in PFS / CR, whereas
symptom control/palliative care is already defined as a treatment
objective in almost 20% of cases.
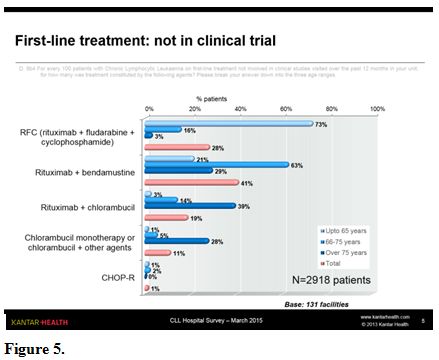 |
Figure 5. |
Second- and subsequent line therapy. Again excluding the 8% of patients involved in clinical studies, in treatment lines subsequent to the first (figure 6) the most commonly used treatment overall is R-Benda, especially in patients up to 75 years.
Chlorambucil
is very commonly used in patients over 65, in combination with
Rituximab or often in other regimens in elderly patients.
In these treatment lines (figure 7),
the most common therapeutic objective is an increase in PFS/ CR (53% of
cases), which is higher than in first-line treatment (26%). As
expected, OS is the primary endpoint for a mere 21% of patients. In
this subset of patients, the category of patients for whom symptom
control/ palliative care is the therapeutic objective is obviously
higher (26%) than was reported for patients receiving first-line
therapy.
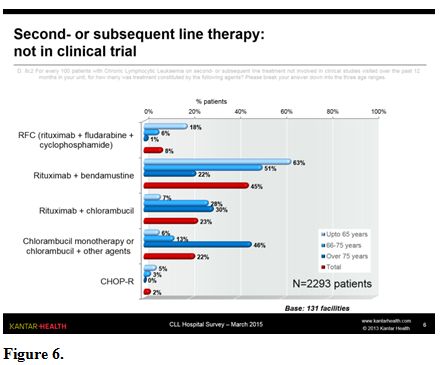 |
Figure 6. |
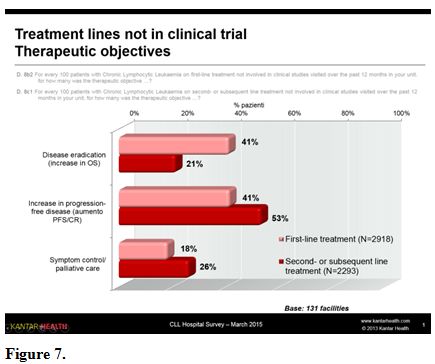 |
Figure 7. |
Cirs Scale and Score Calculation.
The CIRS score classifying patients as FIT and UNFIT (where a score of
≤ 6 is classified as fit and > 6 as unfit) is partially used in the
clinical practice of the units: 40% of respondents replied that this
happens rarely, another 38% replied “quite often”. Only a minority,
primarily in the centres treating more patients, make frequent (13%) or
continuous (8%) use of the scoring system (figure 8).
This
result may have a close relationship with the choice of treatment, as
all the most recent treatment indications refer to the CIRS score.
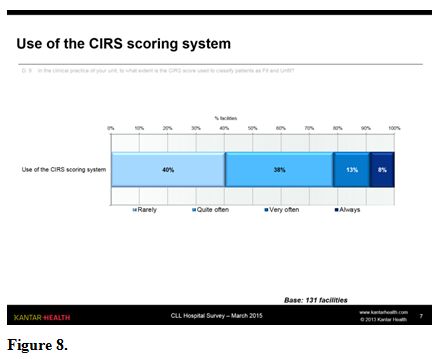 |
Figure 8. |
Discussion and Conclusion
References

[TOP]