Received: August 21, 2015
Accepted: January 19, 2016
Mediterr J Hematol Infect Dis 2016, 8(1): e2016012, DOI 10.4084/MJHID.2016.012
This article is available on PDF format at:

Peerapon Wong1, Jiranun Weerakul2 and Suchila Sritippayawan3
| This is an Open Access article distributed
under the terms of the Creative Commons Attribution License (https://creativecommons.org/licenses/by-nc/4.0), which permits unrestricted use, distribution, and reproduction in any medium, provided the original work is properly cited. |
|
Abstract Background and Objectives: In
newborns and infants during their first year of life, there is a
dynamic change in the fraction of hemoglobin (Hb). To apply Hb analysis
as a phenotypic diagnosis of thalassemia in newborns and infants, we
need normal values of each Hb fraction for reference. Methods: Seventeen cord bloods from normal deliveries were collected for analysis. One hundred and thirty-seven infants from the pediatric outpatient clinic were recruited and were categorized by their ages into a series of short periods (month±2 weeks). Both alpha and beta thalassemia carriers detected were excluded. Samples with an Hb level less than 10.0 g/dL were also excluded. The proportion of Hb A (α2β2), A2 (α2δ2), and F (α2γ2) was obtained from high-performance liquid chromatography and analyzed according to its categorized periods. Results: There were 90 (58.4%) specimens left for evaluation. The percentage of Hb A, A2, and F gradually changed with increasing age. The percentage of Hb A was 21.14±7.04% (mean±SD) in cord blood and increased substantially to 83.38±1.31% at the sixth month. The level was sustained thereafter. The incremental pattern of Hb A2 was similar to Hb A. The value was 0.32±0.19% at the beginning and reached a plateau with 2.78±0.25% at the sixth month. The percentage of Hb F started at 78.39±7.59% in cord blood and decreased rapidly in the first 6 months. Conclusions: The data possibly can be applied as quick guidance for interpretation of Hb analysis in newborns and infants during their first year of life. |
Introduction
Thalassemia is the most common genetic disorder in Southeast Asia. Screening and diagnosis for at-risk couples and performing prenatal diagnosis (PND) for affected fetuses are the practical strategies to cope with this problem. In mass screening and diagnosis in adults, hemoglobin (Hb) analysis plays a major role. By using the proportion and relative quantity of the normal Hb fraction, namely Hb A (α2β2), A2 (α2δ2), and F (α2γ2), the thalassemia phenotype can be identified leading to a further specific DNA method for final genotypic diagnosis. Besides the thalassemia prevention and control program in adults, in some special situations, parents may seek investigation for their newborn baby regarding thalassemia. Whether for finding diagnosis of anemia etiology or for reassurance of their thalassemia status after prior PND, Hb analysis is also usually undertaken. In newborns and infants during their first year of life, there is a dynamic change in the fraction of Hb, making their Hb analyzes totally different from the results for adults. Steady increment of beta (β) globin chain synthesis is inverse to the reduction of gamma (γ) globin chain production. As a result, the quantity of Hb A constantly climbs while Hb F keeps falling. In adults, the normal proportion of Hb A2 is 2.5-3.5%.[1] When this value is exceeded (>3.5%),[1,2] the diagnosis of beta-thalassemia carrier can then be established. However, since a small quantity of the delta (δ) globin chain gradually increases in newborns, the proportion of Hb A2 is constantly lower than for adults, making the diagnosis of beta-thalassemia carrier impossible when using the Hb cut-off value for adults. Therefore, when applying the Hb analysis as a screening tool to narrow down further the genotypic diagnosis in newborns and infants during their first year of life, we need normal values of the relative quantity of the Hb fraction at this age. Available information regarding newborn Hb has some limitations in clinical practice. One report provides only the proportion of Hb F by alkaline denaturation technique and has been classified only in some specific points of time.[3] Another one provides the proportion of Hb A2 by capillary isoelectric focusing technique in only 3 age groups: 5 months or younger, 6 months to 1 year, and 1 year or older.[4] However, in real life situations, the newborns may come in any specific point of time, and all fractions of Hb together are needed to help in interpreting their thalassemia phenotypes. In addition, these Hb analyzes should also be performed with a current method being used worldwide. In conclusion, our study’s objective was to provide indicative values of Hb A, A2, and F by using high-performance liquid chromatography (HPLC) and categorize the results by a series of time periods during the newborns and infants’ development.
Materials and methods
A prospective study was conducted between July 2010 and April 2011.
One hundred and thirty-seven blood specimens from infants during their
first year of life from the pediatric outpatient clinic and 17 cord
bloods from normal deliveries were consecutively collected at Naresuan
University Hospital, Phitsanulok, Thailand. Each infant attended the
clinic for any diseases which needed their blood checked. Blood
specimens were collected for the study in parallel with their needed
investigation. One hundred and thirty-seven infants consecutively
recruited were categorized by age into a series of short
periods. These were the first, the second, the third, the fourth,
the fifth, the sixth, the eighth, the tenth, and the twelfth month±2 weeks. The proportion of Hb A, A2, and F was obtained from HPLC (VARIANT™), using the β-thalassemia
Short Program (Bio-Rad Laboratories, California, USA), in each sample
and analyzed according to its categorized periods into mean±SD. Each Hb
value was directly calculated from the machine without modification.
The polymerase chain reaction (PCR) to detect the alpha thalassemia-1
(Southeast Asian and Thai deletions) and alpha thalassemia-2 (3.7 kb
and 4.2 kb deletions) genotype was also performed in every case.
Together with alpha thalassemia PCR, detection of 6 common
beta-thalassemia mutations (codon 41/42 (-TTCT), codon 17 (A-T), IVS-I
nt1 (G-T), IVS-I nt5 (G-C), codon 71/72 (+A), and codon 26 (G-A) or Hb
E) was conducted using the multiplex amplification refractory mutation
system (ARMS).[5,6] Both alpha and beta thalassemia
carriers detected were excluded from the study. Complete blood count
was performed in all specimens. Samples with an Hb level less than 10
g/dL were also excluded. Relative quantities of the Hb fraction from
the excluded thalassemia carriers were used to compare with the
indicative values created. The study was approved by the institutional
ethics committee (5302040017). Written informed consent was obtained
from all parents before entering the study.
Results
Among 154 samples, after exclusion of thalassemia carriers, there were 100 (64.9%) specimens left: 10 cord bloods and 90 samples from infants. Of these infant samples, there were 10 with Hb levels less than 10.0 g/dL and had to be further excluded. Gestational age for the 10 cord bloods ranged from 37.3 weeks to 40.1 weeks (mean 38.7±0.8 weeks). Among the 80 evaluable infants attending the pediatric outpatient clinic, there were 66 (82.5%) with infections and 14 (17.5%) with non-infectious diseases. The infectious diseases comprised 25 gastroenteritis, 19 lower respiratory tract infections, 14 upper respiratory tract infections, and 8 other infections. The non-infectious illnesses were 4 conjugated hyperbilirubinemias, 3 unconjugated hyperbilirubinemias, 3 patent ductus arteriosus, 2 hydrocephalus, and 2 other causes. The proportion of Hb A, A2, and F analyzed according to the categorized periods is shown in Table 1 and Figure 1. The sum of other non-specific minor peaks (P1, P2, and P3) is also provided (Table 1).
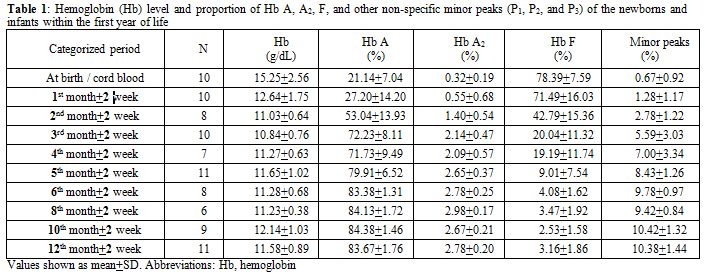 |
Table 1. Hemoglobin (Hb) level and proportion of Hb A, A2, F, and other non-specific minor peaks (P1, P2, and P3) of the newborns and infants within the first year of life. |
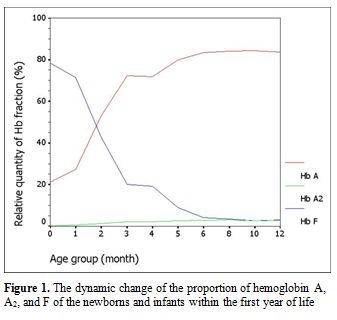 |
Figure 1. The dynamic change of the proportion of hemoglobin A, A2, and F of the newborns and infants within the first year of life. |
For the 54 thalassemia carriers excluded, there were 17
alpha thalassemia-2 heterozygotes, 13 Hb E heterozygotes, 10 alpha
thalassemia-1 heterozygotes, 7 Hb E and alpha thalassemia-2 double
heterozygotes, 2 Hb E and alpha thalassemia-1 double heterozygotes, 1
beta thalassemia and alpha thalassemia-1 double heterozygote, 1 beta
thalassemia compound heterozygote, 2 alpha thalassemia-2 homozygotes
and 1 Hb E homozygote. When we compared the Hb analyzes of these
thalassemia carriers with our indicative values according to their age
groups, some guidance for the phenotypic interpretation could be seen (Table 2). Hb A2
and Hb E are generally eluted from HPLC with the same retention time
but in different amounts. All 23 samples with Hb E related genotype had
a high proportion of Hb A2 / Hb E, out of range (> 2 SD) from each categorized period. Lower Hb F and A2
values were observed in the majority of alpha thalassemia-1
heterozygote. However, these values were still in our indicative
ranges. No phenotypic differences could be detected in newborns with
alpha thalassemia-2 heterozygote. One beta thalassemia and alpha
thalassemia-1 double heterozygote had high Hb A2
value out of our indicative range without beta thalassemia mutation
initially identified, using our multiplex ARMS. However, with further
DNA investigation, codon 27/28 (+C) was eventually detected. One beta
thalassemia compound heterozygote had high Hb F level without Hb A.
Also, beta thalassemia mutations [codon 17 (A-T) and codon 26 (G-T)]
were finally identified using DNA sequencing method.
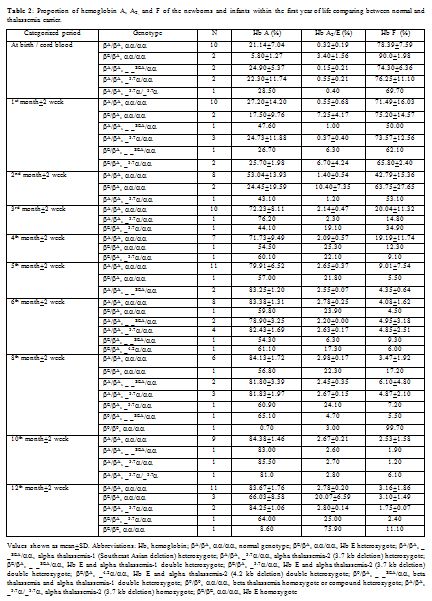 |
Table 2. Proportion of hemoglobin A, A2, and F of the newborns and infants within the first year of life comparing between normal and thalassemia carrier. |
Discussion
Because of its well-accepted high accuracy and our center’s experience, HPLC was the method selected in this study for determining the Hb value. The percentage of Hb A, A2, and F gradually changed with increasing age according to normal development. Hb A and A2 kept rising with age, inverse to the proportion of Hb F. The percentage of Hb A was 21.14±7.04% (mean±SD) in cord blood and increased substantially to 83.38±1.31% at the sixth month. The level was sustained thereafter. The incremental pattern of Hb A2 was similar to Hb A. The value was 0.32±0.19% at the beginning and reached a plateau with 2.78±0.25% at the sixth month. The percentage of Hb F started at 78.39±7.59% in cord blood and decreased rapidly in the first 6 months. The lowest value was around 3% at the tenth and the twelfth month. In the first 6 months of life after birth, there is a more dynamic change in the fraction of Hb compared with the period after 6 months, reflected by high SD values in each categorized period. Age difference in weeks or even in days can affect the more relative quantity of each Hb fraction in this earlier period. Compared with available information provided in the literature,[3,4] there are some differences of values in the details, which may be due to the different techniques performed and different periods categorized. Otherwise, there could be regional and ethnic variations in the percentage of Hb. Compared with previously published values since the mid-1980s using the alkaline denaturation technique (Table 3),[3] the percentage of Hb F after 8 months of age seems higher in our study which may be due to the accuracy of HPLC used.[7] However, the major trend of Hb F reduction from previous data looks the same as ours. Compared with the other report in which the value of Hb A2 of the age group from 6 months to 1 year was 2.2±0.9%,[4] the percentage of Hb A2 in every categorized period after 6 months of age seems higher in our study with less variation (SD value) (Table 4). This difference may be due to the different technique performed.[8,9] The value of Hb A2 of the age group less than 5 months from the same report was 1.2±1.5% which cannot be compared with our data which had more periods categorized.
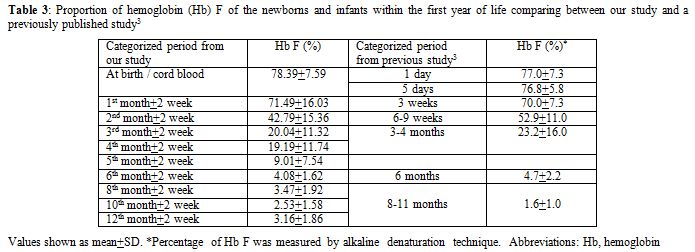 |
Table 3. Proportion of hemoglobin (Hb) F of the newborns and infants within the first year of life comparing between our study and a previously published study.[3] |
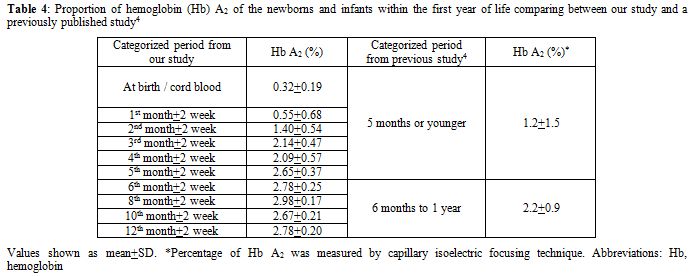 |
Table 4. Proportion of hemoglobin (Hb) A2 of the newborns and infants within the first year of life comparing between our study and a previously published study.[4] |
As we compared the
relative quantities of the Hb fraction from thalassemia carriers with
our indicative Hb values, there were some differences usable for
phenotypic interpretation, as in adults. All samples with the Hb E
related genotype could be obviously identified from each categorized
period with high Hb E level. As in adults, no apparent differences
could be detected in newborns with alpha thalassemia-1 or alpha
thalassemia-2 heterozygote, despite slightly lower Hb F and A2 values observed in alpha thalassemia-1 heterozygote. In beta thalassemia heterozygote, higher Hb A2
level could be detected as in adults. However, we still did not have
enough data to see the true differences. The clinical application of
our indicative Hb values could be more obvious when used to compare
samples with thalassemia disease. There would be no Hb A detected in
the beta thalassemia homozygote, compound heterozygote or Hb E / beta
thalassemia compound heterozygote, as indicated in one of our
thalassemia samples.
For the limitation of the study, some
possible confounders which can affect the proportion of each Hb cannot
totally be excluded. The six beta thalassemia mutations tested can
cover 91.8%, but not all of the beta globin mutations in the North of
Thailand.[6] In addition, DNA analysis to detect
alpha-Hb Constant Spring was not performed. The study did not rule out
iron deficiency which can theoretically reduce alpha globin chain
synthesis and affect the quantity of the Hb fraction, especially Hb A2.[10,11] However, more recent studies found this effect as minimal, and it might be negligible.[12-14]
Infection and underlying disease of the infants recruited can also in
part suppress the level, but not the proportion, of their Hb depending
on the severity of their illnesses.[15] This
limitation is directly due to ethical issues. It seems inappropriate to
collect blood specimens from healthy infants for research without
needed investigation or any benefit. Therefore, we chose to recruit
infants as healthy as possible from the outpatient clinic.
Nevertheless, to make sure there was no anemic condition to affect the
level of each Hb fraction, we also excluded samples with Hb levels less
than 10.0 g/dL, which is the lower limit (-2 SD) accepted for normal Hb
in the infants.[16]
The results of Hb A, A2,
and F of newborns, and infants within the first year of life, in our
study, are more practical in details for specific age, separated by
month, of an infant compared with the available information. The
thalassemia genotype of samples recruited, which was the most important
confounding factor, was substantially excluded. However, among the
limitations of the study are the relatively small number of infants and
the diversity of illnesses from the outpatient samples recruited. With
these limitations, the observed Hb percentages can only be considered
as indicative and not as reference values. Nevertheless, the data
possibly can be applied as quick guidance for interpretation of Hb
analysis in patients during their first year of life.
Acknowledgements
Source of funding: a research grant from Naresuan University.
References
