Flavia Mayer1, Laura Faglioni2, Nera Agabiti1, Susanna Fenu2, Francesco Buccisano3, Roberto Latagliata4, Roberto Ricci4, Maria Antonietta Aloe Spiriti5, Caterina Tatarelli5, Massimo Breccia4, Giuseppe Cimino6, Luana Fianchi7, Marianna Criscuolo7, Svitlana Gumenyuk8, Stefano Mancini9, Luca Maurillo3, Carolina Nobile10, Pasquale Niscola11, Anna Lina Piccioni12, Agostino Tafuri5, Giulio Trapè13, Alessandro Andriani14, Paolo De Fabritiis11, Maria Teresa Voso3, Marina Davoli1 and Gina Zini7
1 Department of Epidemiology, Lazio Regional Health Service (Italy).
2 Hematology Dep. Az. Osp. San Giovanni-Addolorata Rome (Italy).
3 Hematology Unit Tor Vergata University, Rome(Italy).
4 Dep of Cellular Biotechnology and Hematology, University “La Sapienza” Rome (Italy).
5 Hematology Unit Sant' Andrea Univ. "La Sapienza " Rome (Italy).
6 Dep. of Cellular Biotechnology and Hematology, University of Rome “Sapienza”–Polo Pontino, Latina (Italy).
7 Hematology Institute Università Cattolica del Sacro Cuore Rome (Italy).
8 Hematology and Stem Cell Transplantation Unit, Regina Elena National Cancer Institute Rome (Italy).
9 Hematology Unit Az. Osp. San Camillo-Forlanini, Rome (Italy).
10 Hematology Dep. Campus Biomedico, Rome (Italy).
11 Hematology Unit Az. Osp. Sant Eugenio Rome (Italy).
12 Hematology Unit Az. Osp. Sandro Pertini, Rome (Italy).
13 Hematology Unit Az. Osp. Belcolle Viterbo (Italy).
14 Ospedale Nuova Regina Margherita, Rome (Italy).
Corresponding
author: Laura Faglioni. Hematology Dep.
of Az. Osp San Giovanni-Addolorata, via Dell’Amba Aradam 9, 00184 Rome
(Italy), Tel. 00390677054552, Cell. +393480461505, fax 0677055326.
E-mail
laura.faglioni@gmail.com
Published: July 1, 2017
Received: February 7, 2017
Accepted: June 5, 2017
Mediterr J Hematol Infect Dis 2017, 9(1): e2017046 DOI
10.4084/MJHID.2017.046
This article is available on PDF format at:

This is an Open Access article distributed
under the terms of the Creative Commons Attribution License
(https://creativecommons.org/licenses/by-nc/4.0),
which permits unrestricted use, distribution, and reproduction in any
medium, provided the original work is properly cited.
|
|
Abstract
Data
on Myelodysplastic Syndromes (MDS) are difficult to collect by cancer
registries because of the lack of reporting and the use of different
classifications of the disease. In the Lazio Region, data from patients
with a confirmed diagnosis of MDS, treated by a hematology center, have
been collected since 2002 by the Gruppo Romano-Laziale Mielodisplasie
(GROM-L) registry, the second MDS registry existing in Italy.
This
study aimed at evaluating MDS medical miscoding during
hospitalizations, and patients’ survival. For these purposes, we
selected 644 MDS patients enrolled in the GROM-L registry. This cohort
was linked with two regional health information systems: the Hospital
Information System (HIS) and the Mortality Information System (MIS) in
the 2002-2012 period.
Of the 442 patients who were hospitalized
at least once during the study period, 92% had up to 12
hospitalizations. 28.5% of patients had no hospitalization episodes
scored like MDS, code 238.7 of the International Classification of
Disease, Ninth Revision, Clinical Modification (ICD-9-CM). The rate of
death during a median follow-up of 46 months (range 0.9-130) was 45.5%.
Acute myeloid leukemia (AML) was the first cause of mortality,
interestingly a relevant portion of deaths is due to
cerebro-cardiovascular events and second tumors.
This study
highlights that MDS diagnosis and treatment, which require considerable
healthcare resources, tend to be under-documented in the HIS archive.
Thus we need to improve the HIS to better identify information on MDS
hospitalizations and outcome. Moreover, we underline the importance of
comorbidity in MDS patients’ survival.
|
Introduction
Myelodysplastic
syndromes (MDS) are characterized by hematopoietic impairment
associated with peripheral blood (PB) cytopenias, leading to serious
morbidity, and an increased risk of leukemic transformation.[1]
In
the general population, MDS occurs in 3-5 per 100,000 people/year.
However, in individuals aged over 70 years, the incidence constantly
increases up to 40-60 /100,000.[2,3] Survival of MDS patients is poor,[4] with 2-4 years reported median overall survival (OS).[1,5,6]
Factors known to impact survival include age, the number of blasts,
cytogenetic profile, cytopenias, transfusion requirements and disease
type, according to 2008 WHO classification.[7] Some of
these parameters have been used to develop MDS prognostic indexes: the
International Prognostic Scoring System (IPSS),[8] the Revised International Prognostic Scoring System (R-IPSS)[9] and the WHO-adapted Prognostic Scoring System (WPSS).[10]
The introduction of new treatments in the last decade, including
hypomethylating and immunomodulating agents, improved supportive care
measures and the more frequent use of allogeneic stem cell
transplantation (HSCT) are changing the natural history of these
diseases.[11]
Results on MDS from
population-based studies are rare, and these data are under-reported by
cancer registries. Underreporting is likely a result of inadequate
infrastructure of reporting to cancer registries or by under diagnosis
of MDS (i.e. no bone marrow examination performed to confirm the MDS
diagnosis).
The reasons why an extensive epidemiological analysis has not been conducted are:
i)
the use of the code International Classification of Disease, Ninth
Revision, Clinical Modification (ICD-9-CM) does not specify MDS
subtypes,[12] and a complete international
classification of diseases for oncology ICD-O-3 is not usually adopted
in Italian medical claim databases;
ii) the inaccuracy of case reporting because diagnosis and management are performed by different medical service.
In
the last decades, in several countries, many registries have been
created as the “Surveillance and epidemiological and End Results”
(SEER) from the National cancer Institute,[5] the “Dusseldorf registry” started in 1986,[6] the “Netherlands Cancer Registry”, established in 19892,[13] or the “Victorian Cancer Registry”,[14] which provided a basis for epidemiological and clinical studies in MDS.
The
incidence of MDS in Italy is not well documented because large
population-based studies are scarce, since oofficial statistics on
morbidity and mortality is not available on a national basis, but
derives from some regional cancer surveys and hospital-based registries.
The only registry active in Italy was the Piedmont one[15]
created in 1999, which started as a regional database, and has been
recently expanded to other regions, in the FISM (Federazione Italiana
Sindromi Mielodisplastiche), but does not include the whole Italian
territory.
In the last decades, information from large
administrative datasets, like hospital or drug registries, has been
widely used to describe the epidemiological impact of chronic
diseases through standardized methodologies.[16-20] In the case of MDS epidemiological figures from population-based studies using linked health information systems are lacking[13] and no study exists in Italy to test the quality of claims data in this field.
Based
on the experience of international epidemiological surveillance, the
Gruppo Romano-Laziale Mielodisplasie (GROM-L) gathered in 2009 to
encourage the cooperation between the hematological departments in the
area, to promote the harmonization of clinical and diagnostic pathways
in MDS.
It has been built a registry and patients with a confirmed
diagnosis of MDS are enlisted in the GROM-L registry by a hematologic
center of the Lazio Region, and the database is regularly updated.
The study reported here had two main aims:
1) to
evaluate MDS-miscoding in medical claims, through the analysis of the
concordance between the diagnosis of the MDS patients enrolled in the
GROM-L registry, considered as gold-standard, and the diagnosis
reported by the physician in-charge in the claims recorded during the
hospitalization episodes in any regional hospital, following the MDS
diagnosis;
2) to conduct an 11-year mortality follow-up
of the MDS cohort enrolled in the registry using data from the Lazio
region mortality registry.
Patients and Methods
Data sources.
a) Clinical dataset: the GROM-L registry
Our
study enrolled patients diagnosed with MDS in 12 Hematology Centers in
the Lazio Region, between 2002 and 2010. Individual data were collected
in a homogeneous electronic platform. About 40% of patients were
enrolled because of hematologic counseling in a ward different from
'hematology', 20% accessed through the emergency room and 40% due to an
outpatient visit required by their physician. After diagnosis, 45% MDS
patients were monitored through the outpatient clinic, while the
remaining patients were followed in day-hospital since they received
transfusions or other treatments. In addition, some outpatients needed
to access the emergency room for severe anemia and were admitted to
internal medicine wards. The information on MDS type according to
2008 WHO classification was available for each patient.
b) Healthcare Information Systems
The following Lazio region healthcare databases were used:
-
The Hospital Information System (HIS) database for every
hospitalization in any hospital of region Lazio, containing information
on patients’ personal data, diagnose of discharge, and the procedure
performed, encoded according to the ICD-9-CM.
- The regional
Mortality Information System (MIS) database, including information on
demographic characteristics, as well as date, place, and cause of death
(codified by ICD-9-CM codes).
Data available in the regional
Healthcare Information Systems are routinely collected for
administrative purposes. The Department of Epidemiology of the Lazio
Regional Health Service is authorized to manage these databases within
the rules of the National Privacy Policy. Linkage among different
information systems is possible using an Anonymous Unique Patient Code
(AUPC) for every citizen enrolled in the regional healthcare service.
Standardized
procedures of deterministic record linkage are applied to connect the
archives, to build the clinical history of patients for the evaluation
of epidemiological studies.[1-5] The high quality of
individual data is the basic requirement for epidemiological studies,
based on the Healthcare Information Systems.
Statistical analysis. A retrospective cohort study was conducted. Only patients with a valid AUPC were linked to the Healthcare Information Systems.
About
the first aim of the study (to evaluate MDS-miscoding in medical
claims), the HIS for the years 2002-2012 was linked to the MDS cohort.
The ICD-9-CM code used to identify MDS is 238.7 (neoplasm of uncertain
behavior of other lymphatic and hematopoietic tissues). Only patients
who had at least 1 hospitalization between the date of MDS diagnosis by
the Hematology Center and the end of 2012 were considered. We
calculated the proportion of patients where the 238.7 ICD-9-CM code or
sub-classification, were reported at least once in any principal or
secondary diagnosis. In patients who had a concordant MDS diagnosis,
specific ICD-9-CM code recorded for MDS in HIS claims were explored.
Specific ICD-9-CM code registered in the principal diagnosis in HIS
claims were examined for patients who did not have a concordant MDS
diagnosis.
About the second aim of the study (to conduct a
mortality follow-up), the MIS for the years 2002-2012 was linked to the
MDS cohort. Mortality follow-up started on the day of the MDS diagnosis
until 31 December 2012, or the date of death if it occurred before.
Thus, potentially, each patient had a minimum of 2 years and a maximum
of 11 years observation time. The main causes of death were examined.
Time
to death was examined using the Kaplan-Meier curve, stratified by MDS
subtype, according to 2008 WHO classification. These curves show the
cumulative probability of surviving during a given follow-up time
(expressed in months). End of the study period (31 December 2012) was
considered a reason for censoring. Censored patients do not contribute
to the denominator for the succeeding proportion of deaths. The
Log-Rank test was used to compare the full curves of each group to
evaluate if the seven survival curves are statistically significantly
different.
Finally, we analyzed the proportion of patients alive
stratified by year of diagnosis at one year follow up and at five years
follow up, therefore for the second aim we restricted our analysis to
patients diagnosed from 2002 to 2007. The Log-Rank test was performed. Results
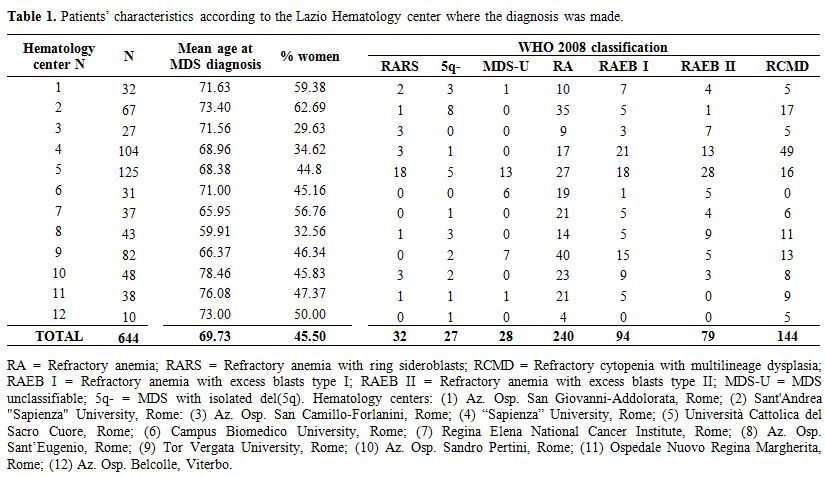
Patients’ characteristics. We enrolled 644 patients with MDS, diagnosed at 12 Hematology Centers of the Lazio Region during the period 2002-2010. Table 1
reports patient characteristics according to the Hematology Center
where the diagnosis was made. Mean patients’ age was 69.7 years, and
45.5% were female. According to the 2008 WHO classification, there were
5% RARS, 4.2% 5q- syndromes, 4.3% MDS-U, 37.3% RA, 14.6% RAEB I,
12.2% RAEB II and 22.4% RCMD.
 |
Table
1. Patients' characteristics according to the Lazio Hematology center where the diagnosis was made
|
MDS miscoding in HIS medical claims. The analysis of MDS miscoding in HIS medical claims and the Mortality follow-up was limited to 556 patients with a valid AUPC.
The
data of patients with a correct AUPC enrolled by the GROM-L registry
per year had to be linked with administrative databases. Patients who
were hospitalized at least once during the period 2002-2012 are
reported in Table 2. Of the 442 patients, 92% had a maximum of 12 hospitalizations for any cause.
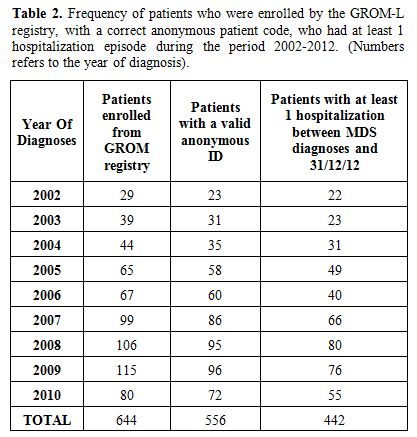 |
Table 2. Frequency of patients who
were enrolled by the GROM-L registry, with a correct anonymous patient
code, who had at least 1 hospitalization episode during the period
2002-2012. (Numbers refers to the year of diagnosis).
|
According to the
cause of hospitalization reported in the principal and secondary
diagnoses, the 442 patients have been divided into 2 groups:
1) 316
patients (71.5%) who had at least 1 hospitalization with the 238.7
ICD-9-CM code in any principal or secondary diagnosis.
2) 126
patients (28.5%), who had no hospitalization with the 238.7 ICD-9-CM
code in any primary or secondary diagnosis.
Patients in group 1
were hospitalized 1107 times during the study period. Of the 316
patients, 180 had the same diagnosis code 238.7 for all hospital
admissions. Table 3 shows the
distribution of code 238.7 for these 180 patients. Half of the
cases had the diagnosis “MDS unspecified” (ICD-9 code 238.75). The
remaining 136 patients had mixed diagnosis within the class 238.7 for
the various hospital admission.
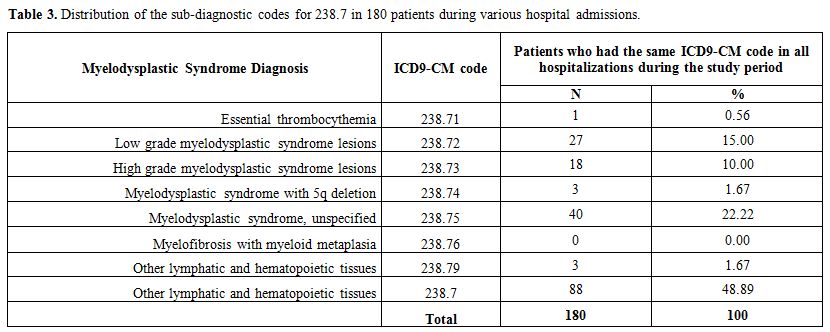 |
Table 3. Distribution of the sub-diagnostic codes for 238.7 in 180 patients during various hospital admissions.
|
Of
the 126 patients in group 2, 66 patients had at least one
hospitalization with a primary hematologic diagnosis (ICD-9-CM codes
280-289: diseases of the blood and blood-forming organs). For the
remaining 60 patients, the distribution of the main diagnosis during
their 203 hospitalization episodes is reported in Table 4. For these patients, the sum is not 60 because each patient could have been hospitalized more than once.
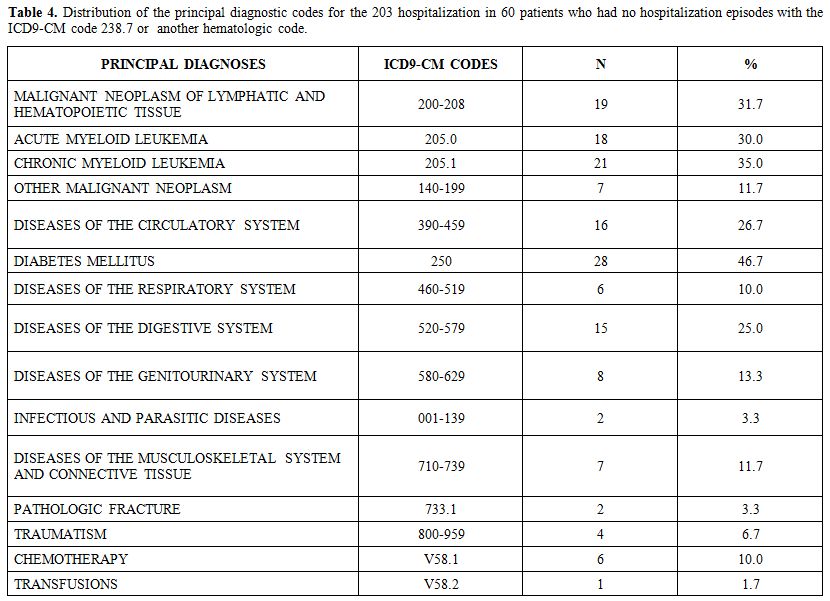 |
Table 4. Distribution of the
principal diagnostic codes for the 203 hospitalization in 60 patients
who had no hospitalization episodes with the ICD9-CM code 238.7
or another hematologic code.
|
Mortality follow-up.
The median observation time for the 556 MDS patients with evaluable
survival data was 46 months (range: 0.9 - 130 months). During the
follow-up, 253 deaths (45.5% patients) occurred. Of whom, 158 (62.5%)
were men. Figure 1A shows the OS curve expressed as months for the whole 2002-2012 period.
The
frequency distribution of survived and deceased patients along the
whole follow up period stratified by type of MDS is reported in Table 5. Figure 1B illustrates
the survival curve stratified by MDS type according to 2008 WHO
classification. The median survival of specific MDS subpopulations was:
5q- syndromes: 110 months, MDS-U: not reached, RA: 102 months, RCMD: 93
months, RARS: 80 months, RAEB I: 37 months, RAEB II: 24 months. At the
end of the follow up 58.9%, 62.5% and 57.1% of patients with RCMD, RA
and RARS were alive. Survival was 36% and 34% for patients with RAEB I
and RAEB II (Table 5). Patients
with a 5q- syndrome or an MDS-U had the best survival probability (67%
and 78%, respectively). The last observed death in MDS-U patients
occurred at 22 months, while it occurred at 112 months in 5q-patients.
The Log-Rank test confirmed a statistically significant difference
among the patient sub-groups (p-value <0.0001).
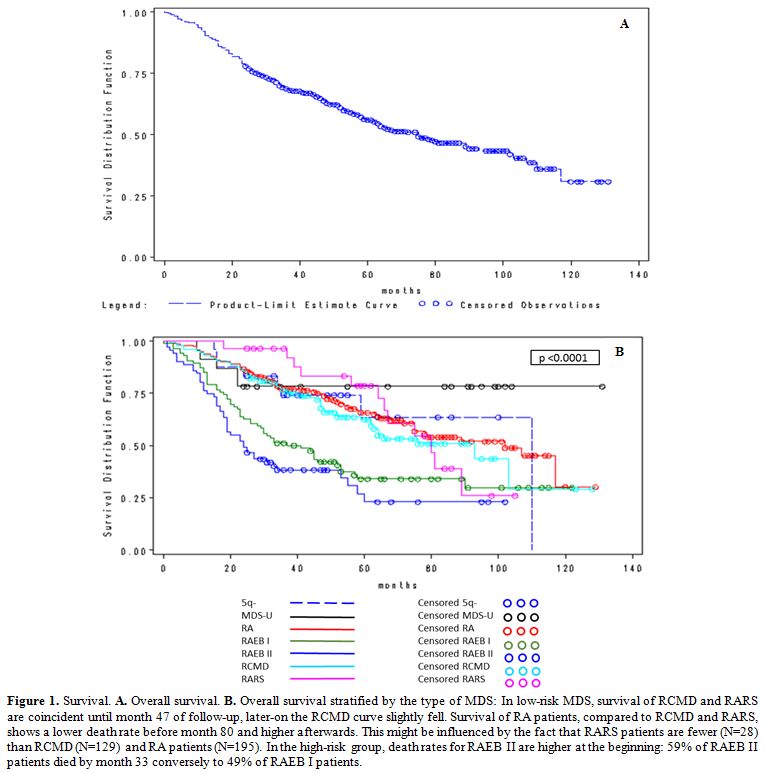 |
Figure 1.
Survival. A. Overall survival. B.
Overall survival stratified by the type of MDS: In low-risk MDS,
survival of RCMD and RARS are coincident until month 47 of follow-up,
later-on the RCMD curve slightly fell. Survival of RA patients,
compared to RCMD and RARS, shows a lower death rate before month 80 and
higher afterwards. This might be influenced by the fact that RARS
patients are fewer (N=28) than RCMD (N=129) and RA patients (N=195). In
the high-risk group, death rates for RAEB II are higher at the
beginning: 59% of RAEB II patients died by month 33 conversely to 49%
of RAEB I patients. |
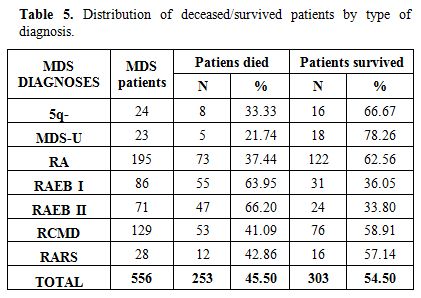 |
Table 5. Distribution of deceased/survived patients by type of diagnosis. |
The
distribution of patients alive at last follow-up, stratified by year of
diagnosis at one year and five years are reported in Table 6, no significant differences in survival according to the time of diagnosis were observed.
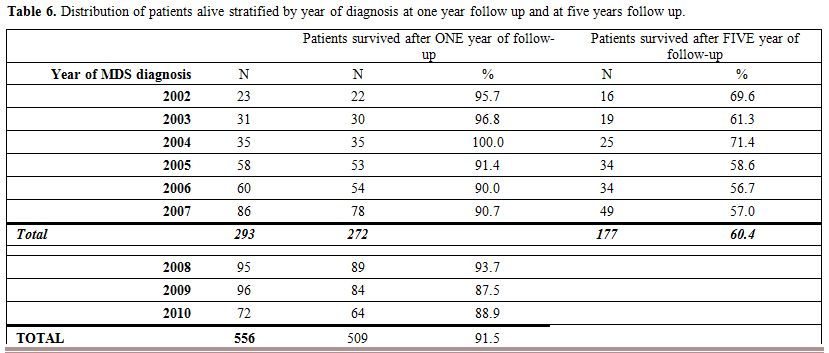 |
Table 6. Distribution of patients alive stratified by year of diagnosis at one year follow up and at five years follow up.
|
Figure 2
shows the five-year survival curve according to the year of MDS
diagnosis, no significant differences were observed among the six
curves (Log-Rank test=0.593).
The distribution of the most frequent causes of death, according to ICD-9-CM coding, is described in Table 7.
The number of fatalities from acute leukemia accounts for 41% in
high-risk MDS and 21% in low-risk MDS, respectively. Interestingly, a
relevant portion of death causes is represented by
cerebro-cardiovascular events and second tumors. The most frequent
cause of mortality was “acute myeloid leukemia” (ICD-9-CM code 2050)
which accounts for 23% causes of death (data not shown), “other
lymphatic and hematopoietic tissues” (ICD-9-CM code 238.7) was the
second cause of death, while 12% of deaths were due to other
hematologic diseases.
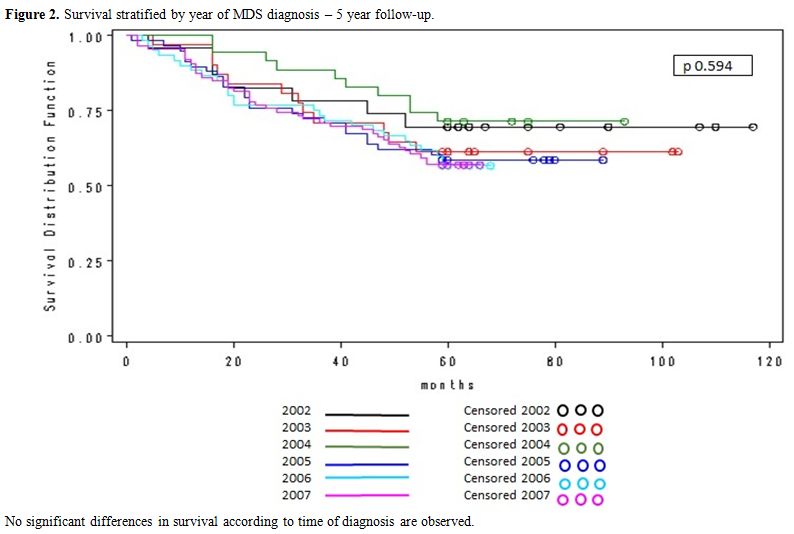 |
Figure 2.
Survival stratified by year of MDS diagnosis – 5 year follow-up. |
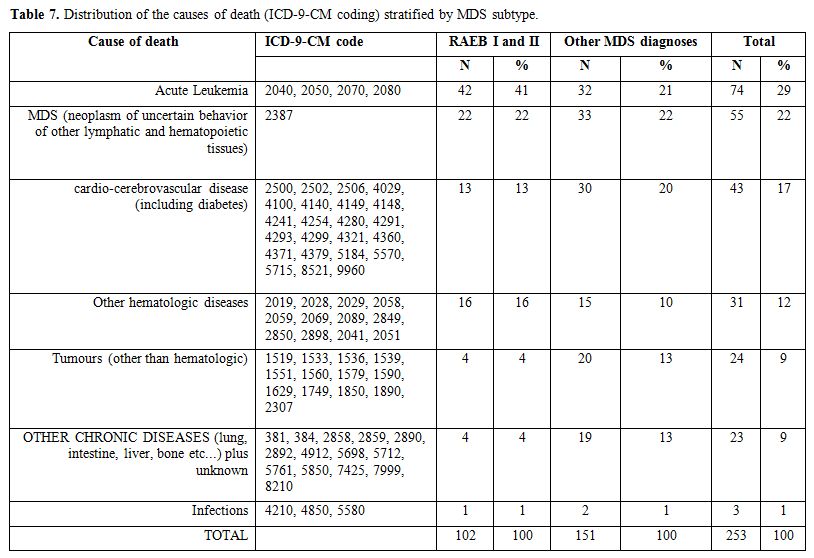 |
Table 7. Distribution of the causes of death (ICD-9-CM coding) stratified by MDS subtype. |
Discussion
Here,
we report the first regional Lazio study on diagnosis,
sub-classification, and survival of MDS patients. MDS patients are
often difficult to recognize, and diagnostic difficulties might affect
reporting frequency.[13,21,22] Our results confirm these issues in the Lazio Region.[2,23-25]
MDS are hematologic diseases whose identification and classification
criteria have undergone major changes in recent years. Although it is
difficult to recognize by the clinicians, awareness on this disease
among hematologists has increased in the last years. In particular, the
GROM-L registry required that diagnoses reported in the present study
were accurate and homogeneously assessed by all participating
hematologic centers.
Among the 644 patients enrolled, we could
evaluate only those who had a valid AUPC and a hospitalization episode
(regularly or day hospital regimen) in the period from the date
of diagnosis to December 31, 2012 (up to 11 years). Discrepancies
between the GROM-L registry and administrative databases are due to
incorrect reporting of the personal data, leading to an invalid AUPC.
Thus, health care information was retrieved for 442 patients only
(64.6%). In 71.5% of these patients, the code 238.7 (Myelodysplastic
Syndrome) was recorded at least once in one of the hospital admissions.
As in previous studies,[26] a high proportion of
non-specific MDS codes was reported. In the remaining 28.5% of
patients, the primary diagnosis was hematologic in more than half of
hospital admissions.
Our observation confirms that survival of patients with MDS is poor. The OS curve (Figure 1A) is similar to other large analysis,[1,6] although different study cohorts are not comparable, as observed in the recent report of Della Porta et al.,[27]
mainly due to different proportion of high risk patients and variable
median age. The Kaplan-Meier curve stratified by MDS subtype according
to 2008 WHO classification (Figure 1B), is similar to other studies of the same type,[28]
with shorter survival for patients with RAEB I or RAEB II. Survival was
similar in low-risk MDS (RCMD, RA, and RARS), and it reached a plateau
in high-risk MDS (RAEB I and RAEB II), similar to other registries.[1,6]
Patients with a 5q- syndrome survived the longest, followed by MDS-U
patients, although numbers are low (24 and 23 patients, respectively).
This is due to the favorable cytogenetic category and probably to the
recently introduced lenalidomide treatment.
These results confirm data from a smaller patient group (380 patients) previously analyzed by our group,[29] which was used to validate the IPSS-R, compared to IPSS and WPSS.
MDS
patients’ therapy has improved over the past decades after the
introduction of new treatment strategies. We performed a survival
analysis stratified by year of diagnosis to investigate a possible
survival gain over time, as assessed by existing literature,[30,31]
but no significant differences in survival were seen at one year and
five years follow up. These results could be due to the low proportion
of patients eligible for new treatment strategies (high risk MDS and
5q- syndrome).
During the follow up almost half of the patients died. 29% of deaths are ascribable to acute leukemia (Table 7),
in particular, acute myeloid leukemia (2050 ICD-9-CM code) is the first
cause of death; indeed it represents a natural evolution of the
disease.[32] The second cause of death is MDS (2387
ICD-9-CM code), but 12% of deaths are due to other hematologic
diseases, this could indicate mis-classification also in the causes of
death.
An important focus of our “real life” observation is the
impact of comorbidity on survival, which induced physicians to choose
the comorbidity code, instead of the MDS code, as the first diagnosis
in the hospital report. Furthermore, we observed that mortality causes
in low-risk MDS patients’ include not only hematologic diseases but
also cerebro-cardiovascular events and second tumors. In particular,
20% of low risk patients died of cerebro-cardiovascular events and 13%
of second tumors. This finding draws attention to comorbidity
assessments to increase patients’ survival and quality of life. Our
observation is in line with most recent reports on the negative
prognostic value of comorbidity not only per se but also in the context
of the different therapeutic strategies, which may increase the risk of
complications.[27,33,34]
All
these results can be interpreted in several ways including: 1)
inappropriate use of existing ICD-9-CM codes; 2) misclassification with
other blood disorders; 3) evolution of the disease over time (which
justifies the use of codes specific for different hematological
diseases).
Moreover, it is important to stress the limitations of
ICD-9-CM classification currently utilized in the HIS, as well as of
the more recent ICD-10-CM. In fact, the MDS subtypes are identifiable
only by evolving complex algorithms, based on various criteria
including symptoms, laboratory tests and molecular genetic
investigations that will further change with the application
of 2016 WHO classification.[35]
This study
highlights for the first time in the Lazio Region that diagnosis and
treatment of MDS, which require a considerable use of healthcare
resources, tend to be under-documented in the HIS archive, due to
difficulties in recognition and coding. We need instruments to improve
the HIS, increasing sensitivity and specificity in order to capture
information on MDS hospitalizations and outcome.
The strength of
our study is the existence of an updated and verified MDS regional
registry. One limit is the possible incomplete link between the GROM-L
registry and the administrative databases, which drives to the absence
of a valid AUPC with a consequent loss of patients in the examined
cohort.
The registry could be a useful investigational tool to
perform continued surveillance of MDS, effective to monitor potential
misdiagnosis and underreporting of these conditions and to
collect clinical and epidemiological data for future prevention and
treatment strategies.
Grant Support
The
study was supported by a grant of Regione Lazio: ‘Sindromi
mielodisplastiche dell’adulto nell’area di Roma e del Lazio:
epidemiologia caratteristiche diagnostiche e clinico-terapeutiche,
analisi dei costi mediante un registro onco-ematologico regionale’
(Grant 2011 - Progetti di farmacovigilanza - Area tematica 5).
References
- Pfeilstocker M, Tuechler H, Sanz G, Schanz J,
Garcia-Manero G, Sole F, et al. Time-dependent changes in mortality and
transformation risk in MDS. Blood. 2016 Aug 18;128(7):902-10. https://doi.org/10.1182/blood-2016-02-700054

- Dinmohamed
AG, Visser O, van Norden Y, Huijgens PC, Sonneveld P, van de Loosdrecht
AA, et al. Trends in incidence, initial treatment and survival of
myelodysplastic syndromes: a population-based study of 5144 patients
diagnosed in the Netherlands from 2001 to 2010. Eur J Cancer. 2014
Mar;50(5):1004-12. https://doi.org/10.1016/j.ejca.2013.12.002
- Neukirchen
J, Schoonen WM, Strupp C, Gattermann N, Aul C, Haas R, et al. Incidence
and prevalence of myelodysplastic syndromes: data from the Dusseldorf
MDS-registry. Leuk Res. 2011 Dec;35(12):1591-6. https://doi.org/10.1016/j.leukres.2011.06.001
- Nomdedeu
M, Pereira A, Ramos F, Valcarcel D, Costa D, Arnan M, et al. Excess
mortality in the myelodysplastic syndromes. Am J Hematol. 2016 Nov 14.
- Zeidan
AM, Wang R, Davidoff AJ, Ma S, Zhao Y, Gore SD, et al. Disease-related
costs of care and survival among Medicare-enrolled patients with
myelodysplastic syndromes. Cancer. 2016 May 15;122(10):1598-607. https://doi.org/10.1002/cncr.29945
- Neukirchen
J, Nachtkamp K, Schemenau J, Aul C, Giagounidis A, Strupp C, et al.
Change of prognosis of patients with myelodysplastic syndromes during
the last 30 years. Leuk Res. 2015 Jul;39(7):679-83. https://doi.org/10.1016/j.leukres.2015.04.001
- Vardiman
JW, Thiele J, Arber DA, Brunning RD, Borowitz MJ, Porwit A, et al. The
2008 revision of the World Health Organization (WHO) classification of
myeloid neoplasms and acute leukemia: rationale and important changes.
Blood. 2009 Jul 30;114(5):937-51. https://doi.org/10.1182/blood-2009-03-209262
- Greenberg
P, Cox C, LeBeau MM, Fenaux P, Morel P, Sanz G, et al. International
scoring system for evaluating prognosis in myelodysplastic syndromes.
Blood. 1997 Mar 15;89(6):2079-88.
- Greenberg
PL, Tuechler H, Schanz J, Sanz G, Garcia-Manero G, Sole F, et al.
Revised international prognostic scoring system for myelodysplastic
syndromes. Blood. 2012 Sep 20;120(12):2454-65. https://doi.org/10.1182/blood-2012-03-420489
- Malcovati
L, Germing U, Kuendgen A, Della Porta MG, Pascutto C, Invernizzi R, et
al. Time-dependent prognostic scoring system for predicting survival
and leukemic evolution in myelodysplastic syndromes. J Clin Oncol. 2007
Aug 10;25(23):3503-10. https://doi.org/10.1200/JCO.2006.08.5696
- Gangat
N, Patnaik MM, Tefferi A. Myelodysplastic syndromes: Contemporary
review and how we treat. Am J Hematol. 2016 Jan;91(1):76-89. https://doi.org/10.1002/ajh.24253
- World Health Organization. ICD website. (cited, available: http://www.cdc.gov/nchs/icd/icd9.htm)
- Dinmohamed
AG, van Norden Y, Visser O, Posthuma EF, Huijgens PC, Sonneveld P, et
al. The use of medical claims to assess incidence, diagnostic
procedures and initial treatment of myelodysplastic syndromes and
chronic myelomonocytic leukemia in the Netherlands. Leuk Res. 2015
Feb;39(2):177-82. https://doi.org/10.1016/j.leukres.2014.11.025
- McQuilten
ZK, Wood EM, Polizzotto MN, Campbell LJ, Wall M, Curtis DJ, et al.
Underestimation of myelodysplastic syndrome incidence by cancer
registries: Results from a population-based data linkage study. Cancer.
2014 Jun 01;120(11):1686-94. https://doi.org/10.1002/cncr.28641
- Epiclin website (cited, available: https://www.epiclin.it/mds_registro).
- Cascini
S, Agabiti N, Incalzi RA, Pinnarelli L, Mayer F, Arca M, et al.
Pneumonia burden in elderly patients: a classification algorithm using
administrative data. BMC Infect Dis. 2013;13:559. https://doi.org/10.1186/1471-2334-13-559
- Cesaroni
G, Agabiti N, Forastiere F, Perucci CA. Socioeconomic differences in
stroke incidence and prognosis under a universal healthcare system.
Stroke. 2009 Aug;40(8):2812-9. https://doi.org/10.1161/STROKEAHA.108.542944
- Di
Domenicantonio R, Cappai G, Arca M, Agabiti N, Kohn A, Vernia P, et al.
Occurrence of inflammatory bowel disease in central Italy: a study
based on health information systems. Dig Liver Dis. 2014
Sep;46(9):777-82. https://doi.org/10.1016/j.dld.2014.04.014
- Roberto
G, Leal I, Sattar N, Loomis AK, Avillach P, Egger P, et al. Identifying
Cases of Type 2 Diabetes in Heterogeneous Data Sources: Strategy from
the EMIF Project. PLoS One. 2016;11(8):e0160648. https://doi.org/10.1371/journal.pone.0160648
- Moretz
C, Zhou Y, Dhamane AD, Burslem K, Saverno K, Jain G, et al. Development
and Validation of a Predictive Model to Identify Individuals Likely to
Have Undiagnosed Chronic Obstructive Pulmonary Disease Using an
Administrative Claims Database. J Manag Care Spec Pharm. 2015
Dec;21(12):1149-59. https://doi.org/10.18553/jmcp.2015.21.12.1149
- Orazi
A. Histopathology in the diagnosis and classification of acute myeloid
leukemia, myelodysplastic syndromes, and
myelodysplastic/myeloproliferative diseases. Pathobiology.
2007;74(2):97-114. https://doi.org/10.1159/000101709
- Rollison
DE, Howlader N, Smith MT, Strom SS, Merritt WD, Ries LA, et al.
Epidemiology of myelodysplastic syndromes and chronic
myeloproliferative disorders in the United States, 2001-2004, using
data from the NAACCR and SEER programs. Blood. 2008 Jul 1;112(1):45-52.
https://doi.org/10.1182/blood-2008-01-134858
- Bennett
JM. A comparative review of classification systems in myelodysplastic
syndromes (MDS). Semin Oncol. 2005 Aug;32(4 Suppl 5):S3-10. https://doi.org/10.1053/j.seminoncol.2005.06.021
- Komrokji
RS, Matacia-Murphy GM, Al Ali NH, Beg MS, Safa MM, Rollison DE, et al.
Outcome of patients with myelodysplastic syndromes in the Veterans
Administration population. Leuk Res. 2010 Jan;34(1):59-62. https://doi.org/10.1016/j.leukres.2009.03.022
- Ma X. Epidemiology of myelodysplastic syndromes. Am J Med. 2012 Jul;125(7 Suppl):S2-5. https://doi.org/10.1016/j.amjmed.2012.04.014
- Polednak
AP, Phillips C. Coding of specific subgroups of myelodysplastic
syndromes in a population-based cancer registry: prospects for
improvement. J Registry Manag. 2012 Fall;39(3):107-14.
- Della
Porta MG, Malcovati L, Strupp C, Ambaglio I, Kuendgen A, Zipperer E, et
al. Risk stratification based on both disease status and
extra-hematologic comorbidities in patients with myelodysplastic
syndrome. Haematologica. 2011 Mar;96(3):441-9. https://doi.org/10.3324/haematol.2010.033506
- Ma
X, Does M, Raza A, Mayne ST. Myelodysplastic syndromes: incidence and
survival in the United States. Cancer. 2007 Apr 15;109(8):1536-42. https://doi.org/10.1002/cncr.22570
- Voso
MT, Fenu S, Latagliata R, Buccisano F, Piciocchi A, Aloe-Spiriti MA, et
al. Revised International Prognostic Scoring System (IPSS) predicts
survival and leukemic evolution of myelodysplastic syndromes
significantly better than IPSS and WHO Prognostic Scoring System:
validation by the Gruppo Romano Mielodisplasie Italian Regional
Database. J Clin Oncol. 2013 Jul 20;31(21):2671-7. https://doi.org/10.1200/JCO.2012.48.0764
- Neukirchen
J, Nachtkamp K, Schemenau J, Aul C, Giagounidis A, Strupp C, Kuendgen
A, Kobbe G, Haas R, Germing U. Change of prognosis of patients with
myelodysplastic syndromes during the last 30 years. Leuk Res. 2015
Jul;39(7):679-83. Epub 2015 Apr 15. https://doi.org/10.1016/j.leukres.2015.04.001
- MacEwan
JP, Yin W, Kaura S, Khan ZM. The value of survival gains in
myelodysplastic syndromes. Am J Manag Care. 2017 Jan 01;23(1):e10-e5.
- Polednak
AP, Phillips C. Leukemia as a cause of death among patients with
myelodysplastic syndromes (MDS) in a population- based cancer registry:
improving estimates of MDS-related mortality in the population. J
Registry Manag. 2012 Fall;39(3):115-20.
- Della
Porta MG, Malcovati L. Clinical relevance of extra-hematologic
comorbidity in the management of patients with myelodysplastic
syndrome. Haematologica. 2009 May;94(5):602-6. https://doi.org/10.3324/haematol.2009.005702
- Molteni
A, Riva M, Borin L, Bernardi M, Pelizzari AM, Freyrie A, et al. The
influence of disease and comorbidity risk assessments on the survival
of MDS and oligoblastic AML patients treated with 5-azacitidine: A
retrospective analysis in ten centers of the "Rete Ematologica
Lombarda". Leuk Res. 2016 Mar;42:21-7. https://doi.org/10.1016/j.leukres.2016.01.006
- Arber
DA, Orazi A, Hasserjian R, Thiele J, Borowitz MJ, Le Beau MM, et al.
The 2016 revision to the World Health Organization classification of
myeloid neoplasms and acute leukemia. Blood. 2016 May
19;127(20):2391-405. https://doi.org/10.1182/blood-2016-03-64
[TOP]