Marcus Ljungkvist1, Maria Berndtsson2, Margareta Holmström3, Danijela Mikovic4, Ivo Elezovic5, Jovan P. Antovic6, Eva Zetterberg1 and Erik Berntorp1.
1 Department of Translational Medicine & Centre for Thrombosis and Haemostasis, Malmö, Lund University, Sweden.
2 Department of Clinical Chemistry, Karolinska University Hospital, Stockholm, Sweden.
3 Coagulation Unit, Haematology Centre, Karolinska University Hospital, Stockholm, Sweden.
4 Hemostasis Department and Hemophilia Centre, Blood Transfusion Institute of Serbia.
5 Clinical Centre of Serbia & Faculty of Medicine, University of Belgrade, Belgrade, Serbia.
6
Coagulation Research, Institute for Molecular Medicine and Surgery,
Karolinska Institute & Department of Clinical Chemistry, Karolinska
University Hospital, Stockholm, Sweden.
Corresponding
author: Marcus Ljungkvist, BS,
PhD-student, Clinical Coagulation Research Unit, Skåne University
Hospital, SE-205 02 Malmö, Sweden. Tel: +46 40 337213, Fax: +46 40
336255, Mobile phone: +46 40 33 72 13. E-mail:
marcus.ljungkvist@med.lu.se
Published: November 1, 2017
Received: August 2, 2017
Accepted: October 9, 2017
Mediterr J Hematol Infect Dis 2017, 9(1): e2017064 DOI
10.4084/MJHID.2017.064
This article is available on PDF format at:

This is an Open Access article distributed
under the terms of the Creative Commons Attribution License
(https://creativecommons.org/licenses/by-nc/4.0),
which permits unrestricted use, distribution, and reproduction in any
medium, provided the original work is properly cited.
|
|
Abstract
Introduction: Several
thrombin-generation tests are available, but few have been directly
compared. Our primary aim was to investigate the correlation of two
thrombin generation tests, thrombin generation assay-calibrated
automated thrombogram (TGA-CAT) and INNOVANCE ETP, to factor VIII
levels (FVIII:C) in a group of patients with hemophilia A.
The secondary aim was to investigate inter-laboratory variation for the TGA-CAT method.
Methods:
Blood samples were taken from 45 patients with mild, moderate and
severe hemophilia A. The TGA-CAT method was performed at both centers
while the INNOVANCE ETP was only performed at the Stockholm center.
Correlation between parameters was evaluated using Spearman´s rank
correlation test. For determination of the TGA-CAT inter-laboratory
variability, Bland-Altman plots were used.
Results:
The correlation for the INNOVANCE ETP and TGA-CAT methods with FVIII:C
in persons with hemophilia (PWH) was r=0.701 and r=0.734 respectively.
The correlation between the two methods was r=0.546.
When
dividing the study material into disease severity groups (mild,
moderate and severe) based on FVIII levels, both methods fail to
discriminate between them.
The variability of the TGA-CAT
results performed at the two centers was reduced after normalization;
before normalization, 29% of values showed less than ±10% difference
while after normalization the number increased to 41%.
Conclusions: Both
methods correlate in an equal manner to FVIII:C in PWH but show a poor
correlation with each other. The level of agreement for the TGA-CAT
method was poor though slightly improved after normalization of data.
Further improvement of standardization of these methods is warranted.
|
Introduction
Routine
laboratory analyses used to diagnose and monitor drug administration in
bleeding disorders are primarily based on one-stage clotting assays and
more recently, chromogenic assays. The one-stage clotting assay (based
on clot forming endpoint) ends when only 3% of the total amount of
thrombin of the coagulation process has been generated.[1]
Thrombin is a key enzyme in the coagulation cascade, having both pro-
and anti-coagulant abilities, so thrombin generation tests (TGTs) are
considered to provide a more comprehensive picture of the patient’s
coagulation capability. The method has demonstrated utility in
evaluating the overall hemostatic capacity both in bleeding and
thrombotic disorders. There is at present reliable evidence that the
method highly reflects the bleeding[2-4] or thrombotic[5-10]
risk of patients with different coagulation disorders. It can also be
used to predict the response to bypassing hemostatic agents
administered to patients with hemophilia and inhibitors.[11,12]
There
are several thrombin generation tests on the market, and most of them
have not been compared to each other. The first aim of this study was
to investigate which of two tests: the thrombin generation
assay-calibrated automated thrombogram (TGA-CAT) or the INNOVANCE ETP,
correlated best with the factor VIII level in a group of persons with
hemophilia (PWH). TGA-CAT uses a fluorogenic substrate while the
INNOVANCE ETP uses a chromophore for detection of thrombin generation.
For the latter test, the plasma samples are defibrinated by its ETP
reagent containing a fibrin aggregation inhibitor.[13] With the TGA-CAT method, this is not required.
Despite
the advantages of TGTs, the TGA-CAT is used primarily in research
laboratories due to the lack of standardization of the method and the
large inter-center variability. However, in recent studies, a number of
problems have been addressed, and promising improvements have been made
in increasing the level of standardization for pre-analytical and
analytical techniques.[14-16] Several investigations
have also evaluated different standard reference plasmas’ ability to
reduce TGA-CAT inter-center variability.[14,15,17] The second aim of this study was to investigate the inter-laboratory variability of the TGA-CAT method between two centers.
Material and Methods
Research subjects.
The study material was collected at two hemophilia care centers: The
Hematology Center, Karolinska University Hospital, Stockholm, Sweden
and the Hemophilia Centre, Belgrade, Serbia. Subjects had severe
(<0.01 IU/ml), moderate (0.01-0.05 IU/ml) and mild
(>0.05-<0.40 IU/ml) FVIII:C deficiency.[18] The
samples from Stockholm were taken from 23 subjects (10 with mild, five
with moderate and eight with severe hemophilia A). Patients with severe
hemophilia from the Stockholm center were on prophylactic treatment.
Time from the last dose of clotting factor was not standardized as
samples were taken as part of routine visits. The samples from Belgrade
were taken from 17 patients with hemophilia A (six with mild, five with
moderate and six with severe disease) all of whom were on on-demand
treatment.
Written informed consent was obtained from all
subjects prior to the study. The study was approved by the Ethics
Committee, Stockholm (Dnr 01-0003; 2006/778-32; 2013/263-32).
Blood samples and plasma preparation.
Peripheral venous blood was collected into BD Vacutainer® plastic tubes
(Becton Dickinson, Franklin Lakes, NJ, USA) with anticoagulant
trisodium citrate (0.129 M, pH 7.4) (one part trisodium citrate and
nine parts blood). Plasma was prepared within 60 minutes from
venipuncture by centrifugation at 2000xG for 20 minutes at room
temperature (RT), then divided into aliquots and stored at -70° C.
Frozen samples on dry ice were transported from Belgrade to Stockholm
and then from Stockholm to Malmö, and were still frozen and in good
condition upon arrival.
Methods. TGA-CAT was measured according to the method described by Hemker et al.[19,20]
Briefly, twenty microliters of PPP-reagent LOW (1 pM Tissue Factor (TF)
and 4 µM phospholipids (Pl)(TS31.00) and twenty microliters of Thrombin
Calibrator (TS20.00) were manually pipetted into the wells of a
round-bottom 96 well-microtiter plate (Immulon 2HB, Thermo Scientific,
Rochester, NY, USA). All three reagents were manufactured by
Thrombinoscope BV, Maastricht, The Netherlands. Eighty microliters of
plasma were added to each PPP-reagent well and its corresponding
Thrombin Calibrator well.
The plate was then placed in a
Fluoroscan Ascent reader (Thermo Labsystems, Shanghai, China) for a 10
minute, 37°C incubation. Following the incubation twenty microliters of
the starting reagent, FluCa-kit (TS50.00), was automatically dispensed
into each well by the fluorometer. The wavelengths of 390 nm
(excitation) and 460 nm (emission) were used to detect the fluorescence
intensity. Thrombin generation curves were calculated by a dedicated
software program, Thrombinoscope (Thrombinoscope BV, Maastricht, The
Netherlands) version: V5.0.0.742. The TGA-CAT setup, instrumentation,
software version, method and reagents, were identical for both
laboratories. The intra-assay and inter-assay coefficients of variation
(CV) for endogenous thrombin potential (ETP) with the TGA-CAT, Malmö,
are 2.3% (n=12) and 9.5% (n=5), respectively.
The second thrombin
generation test, INNOVANCE ETP, a chromogenic ETP assay (Siemens
Healthcare Diagnostics, Marburg, Germany), was performed in Stockholm
on a BCS XP system using C-settings according to the manufacturer´s
instructions and as previously described.[21]
Dilutions of Innovin, 1:555 and actin, 1:20 are mixed in the proportion
1:2 and this mixture is used as an activator. The intra-assay and
inter-assay CV for the area under the curve (AUC) with the INNOVANCE
ETP method (C-setting) are 4,7% (n=5) and 5,7% (n=4) respectively.
The
FVIII:C was determined with a FVIII assay, Coamatic (Chromogenix,
Instrumentation Laboratory SpA, Milano, Italy) on a BCS XP Instrument
(Siemens Healthcare Diagnostics Inc., Deerfield, IL, USA) in Stockholm.
In the test of agreement, the TGA-CAT parameters were normalized[17]
by dividing the value obtained when analyzing each patient’s plasma
with that obtained when analyzing CryoCheck pooled normal plasma
(Precision BioLogic, Dartmouth, Canada).
Statistical analysis.
The associations between parameters were evaluated using Spearman´s
(non-parametric) rank correlation test. For the statistical
presentation and evaluation of the TGA-CAT inter-laboratory
variability, Bland-Altman plots, 45-degree lines, and frequency plots
were used.
Results
Correlations. The correlation between the TGA-CAT parameter ETP and the corresponding parameter for INNOVANCE ETP AUC was r=0.546.
Both
methods (ETP and AUC) showed a similar correlation to FVIII:C (r=0.734
and r=0.701). The FVIII:C values were divided according to disease
severity (severe, moderate and mild) and the results for FVIII:C to ETP
and AUC at the group level are shown in Table 1. Results grouped by severity showed lower associations compared to the total sample.
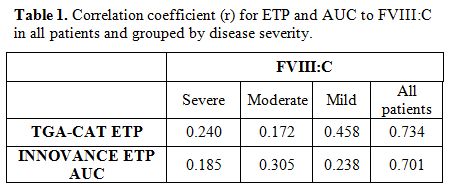 |
Table
1. Correlation coefficient (r) for ETP and AUC to FVIII:C in all patients and grouped by disease severity. |
To determine the
precision in terms of severity, FVIII levels were grouped as severe,
moderate and mild (laboratory severity) and plotted against ETP values (Figure 1).
Substantial overlap in the groups was observed with both assays,
indicating that neither of the methods was considerably better in
discriminating among categories of disease severity.
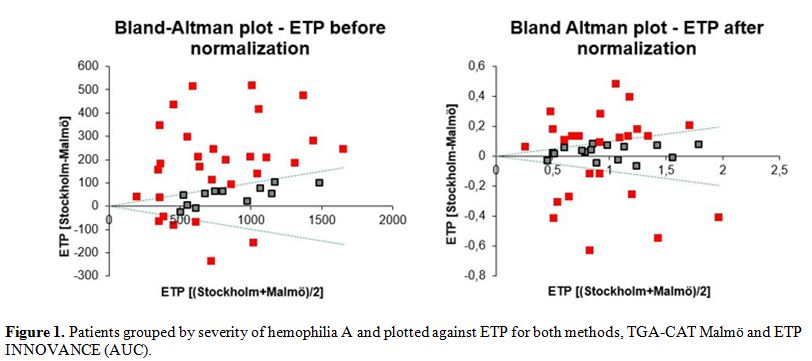 |
Figure 1. Patients grouped by severity of
hemophilia A and plotted against ETP for both methods, TGA-CAT Malmö
and ETP INNOVANCE (AUC).
|
Test of Agreement: TGA-CAT Malmö vs. Stockholm.
When performing inter-laboratory tests of agreement, a difference of
±10% is considered to be an acceptable level by most laboratories. In
most cases, 95% of the observations need to be within the ±10%
acceptance level.[22] The variability between the
TGA-CAT results performed in Malmö and Stockholm was rather extensive,
but after normalization it was reduced. The results for the ETP
parameter are presented in Bland-Altman plots, before and after
normalization (Figure 2).
Before normalization, 29% of the samples were within the ±10% cone of
acceptance. Normalization of the data improved results to 41%,
still far from the 95% acceptance level. The results for peak, lag time
(LT) and time to peak (ttpeak) are inferior to that of the ETP
parameter (Table 2).
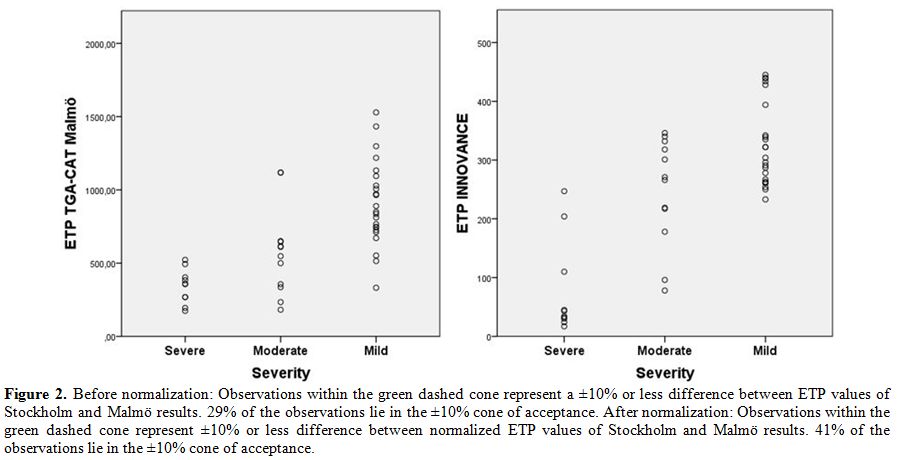 |
Figure 2.
Before normalization: Observations within the green dashed cone
represent a ±10% or less difference between ETP values of Stockholm and
Malmö results. 29% of the observations lie in the ±10% cone of
acceptance. After normalization: Observations within the green dashed
cone represent ±10% or less difference between normalized ETP values of
Stockholm and Malmö results. 41% of the observations lie in the ±10%
cone of acceptance. |
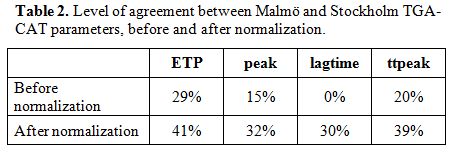 |
Table 2. Level of agreement between Malmö and Stockholm TGA-CAT parameters, before and after normalization. |
Discussion
In
this study, two thrombin generation methods (TGA-CAT and INNOVANCE ETP)
were compared. In our comparison, we choose to focus on ETP and AUC
(ETP). Our evaluation showed poor correlation for ETP between the two
TGTs. Another study comparing the two reported a good correlation;[23]
however, this result was obtained with a higher TF concentration, 10
pM. By inhibiting the intrinsic coagulation with an anti-factor VIII
antibody, Devreese et al. showed that the INNOVANCE ETP detected
extrinsic coagulation exclusively for all TF concentrations tested
(1-300 pM), while in TGA-CAT the amplification of the intrinsic pathway
was measured at low TF concentrations (1 and 2.5 pM).[13]
In our comparison, we used 1 pM TF in the fluorogenic method (CAT) and
a low TF concentration in the chromogenic method (INNOVANCE).
Since
we do not know the exact TF concentration for the INNOVANCE ETP method,
we cannot know if the difference in TF concentration had a part in the
lack of correlation between the methods.
To achieve the desired
number of samples for study, specimens from PWH in both Belgrade and
Stockholm were used. All plasma samples were single centrifuged, thus,
the chance of small amounts of platelets remaining in the plasma cannot
be excluded. According to a study by Loeffen, et al.[16]
TGA-CAT results were only affected by double centrifugation when the TF
concentration was 1 pM or lower. Since our TF concentrations for the
TGA-CAT method were 1 pM and 0.5 pM we cannot rule out the possibility
that results may have been affected by the single centrifugation.
We
did not, however, see a correlation between platelet counts and ETP
values (results not shown) which indicates that single centrifugation,
instead of the recommended double, did not have a significant impact on
the results obtained. There are numerous reports describing contact
activation as a reason for the poor reproducibility of TGA-CAT results[16,24,25]
and it has been proposed that CTI (corn trypsin inhibitor) should be
used for blood sampling. CTI was not used in this study, given the
report by Spronk, et al.[26] stating that the
addition of CTI, preventing the contact activation pathway, can only be
motivated when TF concentrations are 0.5 pM or lower.
Further,
we investigated the level of agreement when the same TGA method
(TGA-CAT) was performed at two centers (Stockholm and Malmö). The
inter-laboratory variation was decreased for all four parameters after
normalization with pooled normal plasma, where the ETP results showed
the highest concordance, 29% without normalization and 41% with
normalization (Table 2). Even
after normalization more than half of the samples did not reach the
level of acceptance. The choice of centrifugation method, blood
sampling tubes, and some other pre-analytical factors are of no concern
when conducting agreement studies. Of crucial importance is that the
characteristics of the plasma are identical for all samples at the
start of the analysis. That said, some pre-analytical factors are
influential, such as transportation, thawing, resuspension of reagents,
pipetting, and time scheme from the end of thawing to start of
analysis. In our investigation, thawing was performed identically, 37ºC
for 10 minutes. However, we did not have full control of the other
factors that may have contributed to the low level of agreement.
Interestingly enough, the factor that may have had the greatest impact
on the results is one that is out of the control of the lab technician,
that is, the analyzing temperature of the measuring equipment. In a
report by De Smedt, et al.[27] the importance of
pre-heating was shown, leading to a ten-minute 37ºC incubation step
before the start of measurement in the latest software version for the
method (version: V5.0.0.742). A post-study service the Fluoroscan
Ascent reader in Malmö showed a temperature deviation of almost three
degrees below the intended and displayed 37°C. Identical measurements
were performed at two other Swedish laboratories by the same service
engineer using the same measuring equipment. Measurements were
approximately 1ºC above and 1ºC below ours. No temperature data from
Stockholm was available, but deviation from the intended assay
temperature is one possible reason for our large inter-laboratory
variability. These divergent measurements indicate the need for
temperature calibration in laboratories participating in multicenter
studies.
The choice of using 95% of the observations within ±10%
as a quality standard for the whole measurement range of the TGA-CAT
method could be argued. In several routine coagulation assays, a wider
acceptance range is used for measurements in the outskirts of the
methods measuring capacity, with acceptance ranges of up to ±15-20% in
its high and/or low measurement ranges. It might be justified to use a
similar approach for the TGA-CAT method.
The main study limitation
is the relatively small number of samples. That might explain the poor
discrimination between the disease severity groups.
To conclude,
both methods correlate in an equal manner to FVIII:C in PWH but show a
poor correlation with each other. When dividing the study material into
disease severity groups, both methods fail to discriminate between
them. The inter-center variability for TGA-CAT method showed a low
level of agreement.
Earlier studies have shown that through
enhanced standardization of the assay and pre-analytical factors, the
inter-laboratory variability can be reduced to acceptable levels and
therefore open up the possibility of conducting multi-center clinical
studies.[13,14] Still, further improvement of standardization is warranted for this method.
Acknowledgements
This
study was supported by funds from Region Skåne and Lund University
(Regional funds and ALF). Nida Mahmoud Hourani Soutari analyzed the
Innovance ETP samples.
Grant Support
J. P. Antovic has
granted unrestricted grant from Baxter and has received lecture
honoraria from Stago, Siemens, Sysmex, Roche, Baxter and NovoNordisk.
None of the other authors declare any conflict of interest.
References
- Rand MD, Lock JB, van't Veer C, Gaffney DP, Mann
KG. Blood clotting in minimally altered whole blood. Blood.
1996;88(9):3432-45. PMid:8896408

- Dargaud
Y, Beguin S, Lienhart A, Al Dieri R, Trzeciak C, Bordet JC, Hemker HC,
Negrier C. Evaluation of thrombin generating capacity in plasma from
patients with haemophilia A and B. Thromb Haemost. 2005;93(3):475-80. https://doi.org/10.1160/TH04-10-0706
- Santagostino
E, Mancuso ME, Tripodi A, Chantarangkul V, Clerici M, Garagiola I,
Mannucci PM. Severe hemophilia with mild bleeding phenotype: molecular
characterization and global coagulation profile. J Thromb Haemost.
2010;8(4):737-43. https://doi.org/10.1111/j.1538-7836.2010.03767.x PMid:20102490
- Trossaert
M, Regnault V, Sigaud M, Boisseau P, Fressinaud E, Lecompte T. Mild
hemophilia A with factor VIII assay discrepancy: using thrombin
generation assay to assess the bleeding phenotype. Journal of
thrombosis and haemostasis. JTH. 2008;6(3):486-93. https://doi.org/10.1111/j.1538-7836.2007.02861.x PMid:18047548
- Lutsey
PL, Folsom AR, Heckbert SR, Cushman M. Peak thrombin generation and
subsequent venous thromboembolism: the Longitudinal Investigation of
Thromboembolism Etiology (LITE) study. J Thromb Haemost.
2009;7(10):1639-48. https://doi.org/10.1111/j.1538-7836.2009.03561.x PMid:19656279 PMCid:PMC2763356
- Tripodi
A, Martinelli I, Chantarangkul V, Battaglioli T, Clerici M, Mannucci
PM. The endogenous thrombin potential and the risk of venous
thromboembolism. Thromb Res. 2007;121(3):353-9. https://doi.org/10.1016/j.thromres.2007.04.012 PMid:17560633
- Haas
FJ, Schutgens RE, Kluft C, Biesma DH. A thrombin generation assay may
reduce the need for compression ultrasonography for the exclusion of
deep venous thrombosis in the elderly. Scand J Clin Lab Invest.
2011;71(1):12-8. https://doi.org/10.3109/00365513.2010.534173 PMid:21073394
- Espitia
O, Fouassier M, Hardouin JB, Pistorius MA, Agard C, Planchon B,
Trossaert M, Pottier P. Thrombin Generation Assay in Hospitalized
Nonsurgical Patients: A New Tool to Assess Venous Thromboembolism Risk?
Clin Appl Thromb Hemost. 2015. PMid:26259913
- Besser
M, Baglin C, Luddington R, van Hylckama Vlieg A, Baglin T. High rate of
unprovoked recurrent venous thrombosis is associated with high
thrombin-generating potential in a prospective cohort study. J Thromb
Haemost. 2008;6(10):1720-5. https://doi.org/10.1111/j.1538-7836.2008.03117.x PMid:18680535
- Youngwon
N, Kim JE, Lim HS, Han KS, Kim HK. Coagulation proteins influencing
global coagulation assays in cirrhosis: hypercoagulability in cirrhosis
assessed by thrombomodulin-induced thrombin generation assay. Biomed
Res Int. 2013;2013:856754. https://doi.org/10.1155/2013/856754 PMid:23555099 PMCid:PMC3595107
- Berntorp
E. Differential response to bypassing agents complicates treatment in
patients with haemophilia and inhibitors. Haemophilia. 2009;15(1):3-10.
https://doi.org/10.1111/j.1365-2516.2008.01931.x PMid:19016901
- Luna-Zaizar
H, Beltran-Miranda CP, Esparza-Flores MA, Soto-Padilla J, Berges-Garcia
A, Rodriguez-Zepeda MD, Pompa-Garza MT, Jaloma-Cruz AR. Thrombin
generation as objective parameter of treatment response in patients
with severe haemophilia A and high-titre inhibitors. Haemophilia.
2014;20(1):e7-14. https://doi.org/10.1111/hae.12309 PMid:24354488
- Devreese
K, Wijns W, Combes I, Van kerckhoven S, Hoylaerts MF. Thrombin
generation in plasma of healthy adults and children: chromogenic versus
fluorogenic thrombogram analysis. Thromb Haemost. 2007;98(3):600-13. https://doi.org/10.1160/TH07-03-0210
- Dargaud
Y, Wolberg AS, Luddington R, Regnault V, Spronk H, Baglin T, Lecompte
T, Ten Cate H, Negrier C. Evaluation of a standardized protocol for
thrombin generation measurement using the calibrated automated
thrombogram: an international multicentre study. Thromb Res.
2012;130(6):929-34. https://doi.org/10.1016/j.thromres.2012.07.017 PMid:22909826
- Dargaud
Y, Luddington R, Gray E, Lecompte T, Siegemund T, Baglin T, Hogwood J,
Regnault V, Siegemund A, Negrier C. Standardisation of thrombin
generation test--which reference plasma for TGT? An international
multicentre study. Thromb Res. 2010;125(4):353-6. https://doi.org/10.1016/j.thromres.2009.11.012 PMid:19942257
- Loeffen
R, Kleinegris MC, Loubele ST, Pluijmen PH, Fens D, van Oerle R, ten
Cate H, Spronk HM. Preanalytic variables of thrombin generation:
towards a standard procedure and validation of the method. J Thromb
Haemost. 2012;10(12):2544-54. https://doi.org/10.1111/jth.12012 PMid:23020632
- Bagot
CN, Leishman E. Establishing a reference range for thrombin generation
using a standard plasma significantly improves assay precision. Thromb
Res. 2015;136(1):139-43. https://doi.org/10.1016/j.thromres.2015.04.020 PMid:25956288
- Blanchette
VS, Key NS, Ljung LR, Manco-Johnson MJ, van den Berg HM, Srivastava A,
Subcommittee on Factor Viii FIX, Rare Coagulation Disorders of the S,
Standardization Committee of the International Society on T,
Hemostasis. Definitions in hemophilia: communication from the SSC of
the ISTH. J Thromb Haemost. 2014;12(11):1935-9. https://doi.org/10.1111/jth.12672 PMid:25059285
- Hemker
HC, Giesen P, Al Dieri R, Regnault V, de Smedt E, Wagenvoord R,
Lecompte T, Beguin S. Calibrated automated thrombin generation
measurement in clotting plasma. Pathophysiology of haemostasis and
thrombosis. 2003;33(1):4-15. https://doi.org/10.1159/000071636 PMid:12853707
- Hemker
HC, Giesen P, AlDieri R, Regnault V, de Smed E, Wagenvoord R, Lecompte
T, Beguin S. The calibrated automated thrombogram (CAT): a universal
routine test for hyper- and hypocoagulability. Pathophysiology of
haemostasis and thrombosis. 2002;32(5-6):249-53. https://doi.org/10.1159/000073575 PMid:13679651
- Antovic
JP, Mikovic D, Elezovic I, Holmstrom M, Wilkens M, Elfvinge P, Mahmoud
Hourani Soutari N, Antovic A. Two global haemostatic assays as
additional tools to monitor treatment in cases of haemophilia A. Thromb
Haemost. 2012;108(1):21-31. https://doi.org/10.1160/TH11-11-0811 PMid:22534727
- Equalis. Equalis kvalitetsmål 2014 [Available from: http://www.equalis.se/media/126588/u040_kvalitetsmaal_equalis_16.pdf
- Sonnevi
K, Tchaikovski SN, Holmstrom M, Antovic JP, Bremme K, Rosing J, Larfars
G. Obesity and thrombin-generation profiles in women with venous
thromboembolism. Blood Coagul Fibrinolysis. 2013;24(5):547-53. https://doi.org/10.1097/MBC.0b013e32835f93d5 PMid:23470648
- Dargaud
Y, Luddington R, Baglin TP. Elimination of contact factor activation
improves measurement of platelet-dependent thrombin generation by
calibrated automated thrombography at low-concentration tissue factor.
Journal of thrombosis and haemostasis: JTH. 2006;4(5):1160-1. https://doi.org/10.1111/j.1538-7836.2006.01905.x PMid:16689781
- Luddington
R, Baglin T. Clinical measurement of thrombin generation by calibrated
automated thrombography requires contact factor inhibition. Journal of
thrombosis and haemostasis : JTH. 2004;2(11):1954-9. https://doi.org/10.1111/j.1538-7836.2004.00964.x PMid:15550027
- Spronk
HM, Dielis AW, Panova-Noeva M, van Oerle R, Govers-Riemslag JW,
Hamulyak K, Falanga A, Cate HT. Monitoring thrombin generation: is
addition of corn trypsin inhibitor needed? Thromb Haemost.
2009;101(6):1156-62. https://doi.org/10.1160/TH08-10-0670
- De Smedt E, Hemker HC. Thrombin generation is extremely sensitive to preheating conditions. J Thromb Haemost. 2011;9(1):233-4. https://doi.org/10.1111/j.1538-7836.2010.04136.x PMid:21062415
[TOP]