Sanaa Kamal1,2, Moheyeldeen Mohamed Naghib1, Jamaan Al Zahrani3, Huda Hassan4, Karim Moawad5 and Omar Arrahman6.
1 Department of Medicine, Prince Sattam Bin Abdul Aziz College of Medicine, Kingdom of Saudi Arabia.
2 Department of Medicine, Ain Shams Faculty of Medicine, Cairo, Egypt.
3 Department of Family Medicine, Prince Sattam Bin Abdul Aziz College of Medicine, Kingdom of Saudi Arabia.
4 Department of Laboratory Medicine, Prince Sattam Bin Abdul Aziz College of Medicine, Kingdom of Saudi Arabia.
5 School of Biological Sciences, UCI, California, United States of America.
6 Department of Medicine, King Khaled Hospital Kharj, Kingdom of Saudi Arabia.
Correspondence to: Sanaa
M. Kamal, MD, PhD. Professor of Medicine, Department of Medicine,
Prince Sattam Bin Abdul Aziz College of Medicine, Kingdom of Saudi
Arabia. Professor of Medicine, Ain Shams Faculty of Medicine, Cairo,
Egypt. Tel.: +966115886633. E-mail:
sanaakamal@ainshamsmedicine.net;
s.kamal@psau.edu.sa
Published: January 1, 2021
Received: August 25, 2020
Accepted: December 8, 2020
Mediterr J Hematol Infect Dis 2021, 13(1): e2021007 DOI
10.4084/MJHID.2021.007
This is an Open Access article distributed
under the terms of the Creative Commons Attribution License
(https://creativecommons.org/licenses/by-nc/4.0),
which permits unrestricted use, distribution, and reproduction in any
medium, provided the original work is properly cited.
|
|
Abstract
Background & Aims:
Sickle cell disease (SCD), a genetic disorder resulting from the
presence of a mutated hemoglobin S (HbS), has a worldwide distribution
and causes significant morbidity and mortality in children and adults.
Few studies addressed the determinants of SCD severity in adults;
therefore, we investigated the impact of nutrition on the outcome of
SCD and health-related quality of life (HRQoL) in adult patients.
Methods:
In this longitudinal study, we recruited and prospectively followed 62
adults with SCD (aged ≥18 years) for a median of 93 months. At entry
and follow-up, patients provided medical and dietary history, had a
physical examination and anthropometric measurements, assessed
protein-energy intake, measurement of micronutrient levels, estimation
of SCD severity score, and determination of the HRQoL (SF-26v2). The
study outcome was a composite of hospitalization due to SCD crises or
death.
Results: At
baseline, 42 (67.74%) patients had macro and, or micro-undernutrition
(Group A), and 20 (32.26%) were well nourished. (Group B). The BMI and
most anthropometric measurements were significantly lower in SCD
patients compared to control subjects. Seventy percent of SCD patients
had vitamin D, vitamin B12, and zinc deficiencies. Thirty-six
under-nourished patients (86%) had gastrointestinal disorders. During
follow-up, 46 patients (74.19%) developed one or more vaso-occlusive
pain crises or other SCD related complications that required
hospitalization. Significant differences in most SF-36v2 domains
existed between well-nourished and undernourished SCD patients.
Protein-energy and micronutrient deficiencies were independent
predictors of severe SCD and mortality. Correction of undernutrition
and hydroxyurea therapy improved SCD severity scores and HRQoL.
Conclusions:
Patients with sickle cell disease have various degrees of macro and
micro deficiencies, which increase SCD severity and hospitalizations
and reduce the health-related quality of life. Early diagnosis and
prompt correction of macro and micronutrient deficiencies need to be
incorporated in the standard of care of SCD patients to improve the
disease outcomes.
|
Introduction
Sickle
cell anemia (SCA) is a common autosomal-recessive hemoglobinopathy
caused by mutations in the HBB gene resulting in the formation of
pathological hemoglobin S (HbS) and 'sickle' shaped erythrocytes which
deform under stress.[1] Sickle cell anemia has a
global distribution with high prevalence in Africa, Mediterranean
countries, Middle Eastern countries, and India.[2,3] In the United States, SCA is the most common inherited blood disorder among African Americans and Hispanics.[4]
Active global migration altered the epidemiology and geographical
distribution of sickle cell anemia due to increased influxes of
migrants from regions with high HbS prevalence towards Europe and North
America.[5] In the Kingdom of Saudi Arabia (KSA), 17% of Saudi adults carry the sickle-cell gene, and 3% of the population has SCD.[6] Most cases of SCD cluster in southern and eastern Saudi Arabia.[7]
Sickle
cell disease is a lifelong disorder that causes acute and chronic
symptoms and signs of variable severity. Intravascular sickling of the
red blood cells in smaller vessels vaso-occlusion leading to ischemia,
necrosis, inflammation, and multi-organ damage.[8,9]
Patients with SCD are at risk of developing life-threatening
complications requiring urgent care such as vaso-occlusive pain crisis,
acute chest syndrome, stroke, pulmonary hypertension, and aplastic
crisis.[10,11] Over the past decades, the survival of
children with SCD has improved substantially due to the early diagnosis
and the advances in the management strategies, including blood
transfusions, hydroxycarbamide, and stem cell transplantation.[1,12]
Thus, SCD is currently not restricted to children, but it became a
chronic disease that causes morbidity and mortality in pediatric and
adult populations.
Given the heterogeneity of SCD clinical
manifestations and outcomes, a consensus on a specific definition for
SCD severity has not yet been achieved. Several reports considered the
rate of acute painful vaso-occlusive episodes requiring
hospitalizations as a measurement of SCD severity. In some studies,
investigators utilized different clinical events and laboratory
parameters to generate measurable SCD severity indices and predictive
models for identifying patients at risk of developing severe
complications to initiate adequate disease-modifying therapies and
prevent organ damage.[13-16] However, the accuracy and predictive performance of the majority of the severity scores need to be validated.
The
determinants of disease severity and outcome in patients with SCD are
not well verified. Studies showed that genetic factors such as β-globin
genotype, HbF, and β-globin haplotype, the co-inheritance of
a-thalassemia, and glucose-6-phosphate dehydrogenase (G6PD) deficiency
or polymorphisms of uridine diphosphate glucuronosyltransferase A1
(UGT1A1) promoter might influence the clinical course of SCD.[17,18]
To date, few studies investigated the potential role of acquired and
environmental factors in modifying SCD progression and outcome.[19,20]
Nutrition is a critical component in the pathogenesis and course of
various chronic diseases such as diabetes mellitus, cardiovascular and
pulmonary diseases.[21,22] Macro and
micro-malnutrition, which results from insufficient food or
micronutrient intake or reduced absorption, causes alterations in the
body functions and composition and the impairment of the immune
responses.[23,24] To date, the impact of nutrition on
SCD severity and the quality of life in adults with SCD is not well
defined. Therefore, we conducted a comprehensive longitudinal
assessment of the macro and micro-nutritional patterns in a
well-characterized cohort of adults with SCD and correlated the
nutritional data with SCD severity, course, outcome, and health-related
quality of life.
Material and Methods
Study design and study population.
We conducted this prospective study in two major hospitals (Prince
Sattam Bin Abdul Aziz University Hospital and King Khaled Hospital) in
Kharj, Central region of Saudi Arabia, between November 2012 and
January 2020. The study enrolled males and females aged =/> 18 years
with HbSS genotype sickle cell disease who had no history of acute
painful crisis or recent admission to the hospital or emergency
department during at least four weeks preceding enrollment
(steady-state). Exclusion criteria included hemoglobin genotypes other
than HbSS, concomitant thalassemia, presence of active autoimmune
disorders, hematologic or solid malignancy, severe hypertension,
decompensated cardiac, liver, or kidney disease., current use of
immunosuppressants or anticoagulant drugs, or refusal to provide full
consent. Women who were pregnant at the time of screening were not
enrolled; however, women who got pregnant during follow-up were
encouraged to remain in the study. However, women who got pregnant
during follow-up were encouraged to remain in the study. We also
enrolled healthy age, gender, and province matched individuals control
subjects. All
eligible patients and control subjects provided written informed
consent before enrollment in the study and before performing
study-related investigations. The institutional review boards (IRB) in
each participating institution approved the research protocol, informed
consent forms, and study procedures that have been conducted per the
Good Clinical Practice guidelines and in conformity with the ethical
guidelines of the Declaration of Helsinki.Patients
provided a detailed medical history, including past and family history,
therapeutic history, and dietary information (48-hour dietary recall).
Whenever possible, the investigators reviewed some patients' health
records during childhood. Enrolled patients had a physical examination
and laboratory tests, including complete blood count (CBC), renal
function tests (creatinine, BUN), liver functions (serum bilirubin,
ALT, and AST, total and direct bilirubin, alkaline phosphatase), using
standard techniques. Ferritin levels were measured by a human ferritin
ELISA Kit (BioSource, San Diego, CA, USA) according to the
manufacturer's instructions. Thyroid-stimulating hormone (TSH),
triiodothyronine (T3), thyroxine (T4), growth hormone, testosterone,
estrogen, and progesterone were measured using BioSource ELISA kits
(San Diego, CA, USA) according to the manufacturer's instructions.Patients
with gastrointestinal disorders had appropriate investigations for
Helicobacter pylori (H.pylori) stools antigen, celiac disease (IgA TTG,
and IgG-deamidated gliadin), lactose intolerance test, upper and lower
gastrointestinal endoscopies, and biopsies when necessary. At study
entry, patients had hepatitis B and C screening (Human hepatitis B
ELISA Kit, and human hepatitis C ELISA kit, Biosource, kits (San Diego,
CA, USA) according to the manufacturer's instructions). Patients with
positive serology had further confirmatory testing. Patients had
baseline and annual abdominal ultrasound examinations, while patients
with viral hepatitis and, or iron overload had transient elastography
as previously described.[25]We
estimated the enrolled patients' energy and protein intake, measured
various micro-nutrients, and determined their nutritional status
(subjective global assessment). According to baseline nutritional
assessment, we classified patients into two groups. Group A included
patients with no under-nutrition evidence (well-nourished; SGA category
A and no micro-nutrient deficiencies. Group B comprised patients with
macro-and micro- nutritional deficiencies. Macro and micro-nutritional status assessments. a. Subjective global assessment (SGA).
The study utilized the subjective global assessment tool (SGA)
(validated Arabic version) to assess the patients' nutrition and some
parameters of body composition.[26] Briefly, SGA
is a validated nutrition assessment tool that combines patient history,
recent nutrient intake, weight alterations, gastrointestinal symptoms,
functional capacity, and metabolic requirements. Physical examination
includes evaluating somebody's composition parameters such as fat,
wasting of muscle, and water retention. The SGA assessment classifies
the patients' nutritional status into three categories: A
(well-nourished), B (moderately malnourished), and C (severely
malnourished).[26]
b. Micronutrients measurements.
according to the manufacturer, Vitamin B12 and vitamin D were measured
using Diazyme vitamin B12 and 25-OH vitamin D assay kits, respectively
(Diazyme Laboratories, Inc., Poway, CA, USA) 's instructions. Plasma
folate levels were determined with a commercial automatic
electrochemical immuno-analyzer (Roche E170, Hoffman La Roche, Basel,
Switzerland) and electrochemiluminescence immunoassay (ECLIA). We used
standard procedures to measure calcium, sodium, potassium, zinc,
magnesium, phosphorous.
Anthropometric measurements.
At study entry and bi-annual follow-up visits, patients had
anthropometric measurements with measurement of the weight, height, and
BMI estimation (by dividing weight in kilograms by the square of height
in meters). Based on the BMI patients' measurements, patients with BMI
values below 18.5, between 18.5-24.99, between 25.0 – 29.9, and above
30 were considered underweight, average weight, overweight, and obese,
respectively.[27] Other measurements included
triceps, abdominal folds thickness, middle-upper arm circumference
(MUAC), calf circumference (CC), waist circumference (WC), and hip
circumference (HC) assessments. The waist-hip ratio (WHR) and the
waist-circumference-to-height-ratio (WHtR) were calculated by dividing
WC to hip circumference and height, respectively.[28,29] The body fat % was measured by a Tanita TBF-400 Total Body Composition Analyzer (Tanita, Tokyo, Japan).
Assessment of SCD severity. Through the study, we used the "Sickle Cell Disease Severity Calculator" online tool available at: http://www.bu.edu/sicklecell/downloads/Projects
to assess SCD severity. This model predicts a 5-year mortality risk and
assesses disease severity. This composite model includes several 25
clinical and laboratory variables such as age, gender, frequency of
blood transfusion, systolic blood pressure, hemoglobin genotype, white
blood cell count, reticulocyte and platelets count, clinical
manifestations including pain, acute chest syndrome, priapism, sepsis,
stroke, in addition to the laboratory data: bilirubin and LDH. The
generated score is between 0.1 to 1 and stratifies disease severity
into mild, intermediate, or high.[13]
Outcome measures.
The study endpoint was a composite of admission to hospital with SCD
related events that occurred during follow-up or death from all causes.
Severe SCD constituted patients with severity scores 0.7 or more and
patients who died during the study. Mild and intermediate SCD patients
with severity scored 0.6 and less and survived the study.
Interventions.
Patients received blood transfusion in acute hemolytic, painful
vaso-occlusive crises or acute chest syndrome, stroke, or acute
priapism. Some study patients received hydroxyurea (HU) before
enrollment, and others initiated HU during the study, as previously
indicated [30]. Patients with proven micronutrient or
hormonal abnormalities detected during the study received the
appropriate replacement therapies.
Health-related quality of life assessment. Patients completed the Arabic version of the Short form-36 Health Survey version 2 (SF-36v2)[31]
questionnaire at study entry, every six months, and in the occurrence
of complications, The SF-36 questionnaire consists of eight scales
yielding two summary measures: physical and mental health. The physical
health measure includes four scales of physical functioning (10 items),
role-physical (4 items), bodily pain (2 items), and general health (5
items). The mental health measure is composed of vitality (4 items),
social functioning (2 items), role-emotional (3 items), and mental
health (5 items).[32] The investigators conducted the scoring according to the RAND health care instructions available at https://www.rand.org/health-care/surveys_tools/mos/36-item-short-form/scoring.html.
Statistical analysis.
Continuous variables were expressed as mean ± SD or median (range) as
appropriate. Categorical variables were compared by Fisher's exact test
or Chi-square test as appropriate. We used Student's t-test,
Mann–Whitney U, Kruskal–Wallis tests, or analysis of variance (ANOVA)
for comparing numerical variables. The incidence rate (person-time
rate) is calculated by dividing the number of new events during
follow-up by the sum of person-years of observation. Correlation
between variables was performed by Pearson correlation for parametric
and Spearman for non-parametric testing. Kaplan–Meier curves were
generated to assess the association between malnutrition and the study
outcomes (hospital admission due to severe SCD related complications or
death). The attributable risk was calculated by subtracting the
non-exposed group's risk from the exposed group's risk. To assess the
impact of the various factors on the severity of SCD, we conducted the
multivariable logistic regression analysis in which data were presented
as ORs with 95% Cis and P values for the were two-sided. P<0.05 was
considered statistically significant. We defined statistical
significance as a P-value of less than 0.05. The statistical analysis
was carried out using SPSS for Windows, version 22, and MedCalc
Software Ostend, Belgium).
Results
Demographics and clinical presentations.
Sixty-two SCD patients (34 males, 28 females, mean age 24.21±3.926; 95%
CI: 23.21 to 25.21 years) fulfilled the inclusion criteria and provided
informed consent to enroll in the study and perform the required
investigations. Initially, we enrolled 62 control subjects to achieve a
case/control ratio 1:1; however, only fifty age, gender-matched and
province of origin healthy individuals (27 males and 23 females; mean
age: 24.94± 4.01; 95% CI: 94.14 to 95.89) provided consent to join the
study as a control group. The median follow-up for the entire cohort
was 93 months (95% CI of the median: 92 to 94 months). At study entry,
20 patients had no macro-or micro-undernutrition (Group A), and 42
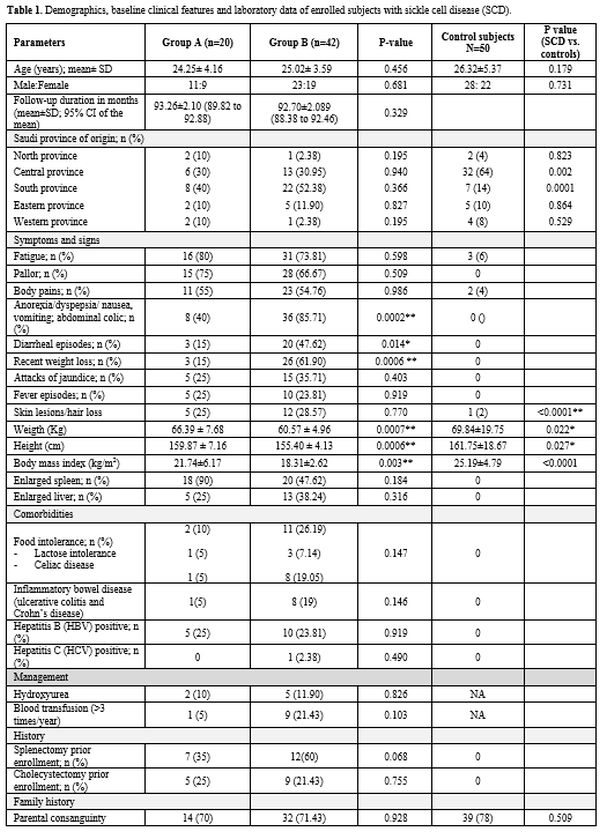
patients had under-nutrition (Group B). Table 1
summarizes the patients' demographics, baseline clinical
characteristics, and laboratory data. Although the participating
centers were in the central region of KSA, 21 (33.87%), 18 (29.03% ), 2
(3.23%), and 2 (3.23%) patients were initially from the Southern,
Eastern, North, and Western KSA provinces respectively (Table 1).
Forty-four (70.97%) patients reported parental consanguinity, and 20
patients (32.26%) reported that more than one family member had SCD.
Enrolled patients presented with diverse clinical manifestations (Table 1).
Significant differences in weight, height, and BMI existed between
Group A and B patients. Hematologic parameters were comparable between
the two patients' groups. Abdominal (gastrointestinal) symptoms were
significantly higher among undernourished patients (Table 1).
 |
Table
1. Demographics, baseline clinical features and laboratory data of enrolled subjects with sickle cell disease (SCD).
|
 |
|
Thirteen
patients (20.97%) had food intolerance (9 cases with celiac diseases
and 4 cases with lactose intolerance). Ten patients with food
intolerance did not comply with gluten-free or lactose-free diets and
presented with bloating and diarrhea episodes. Fifteen patients
(24.19%) had chronic hepatitis B (HBV), and one patient had chronic
hepatitis C. Six patients with chronic viral hepatitis (37.5%) had
liver stiffness scores exceeding 14 kPa with Metavit fibrosis scores of
F3, suggestive of hepatic fibrosis with the expansion of most portal
zones, marked bridging and occasional nodules. Five patients with
chronic HBV also had iron overload. Patients received anti-viral
treatment for both conditions (Table 1) with a virologic response in 11 (73.33%) and 1 (100%) patients with chronic HBV and HCV, respectively (data not shown).
Twenty-seven SCD patients (43.55%) had hypothyroidism (Table 1). Growth hormone and testosterone levels differed significantly between undernourished patients and control subjects (Table 3). Estradiol did not differ between well-nourished and undernourished patients.
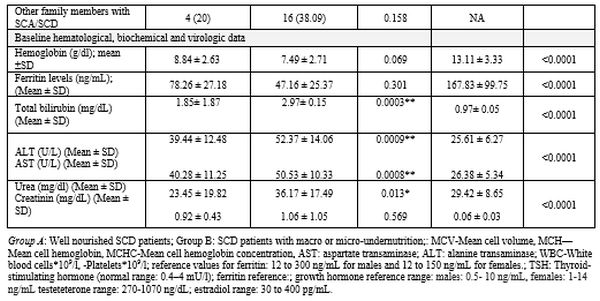
Macro and micro- nutritional status and anthropometric assessments.
Overall, SCD patients had significantly lower energy and protein intake
than control subjects, and Group B patients showed significantly lower
levels than patients in Group A (Table 2).
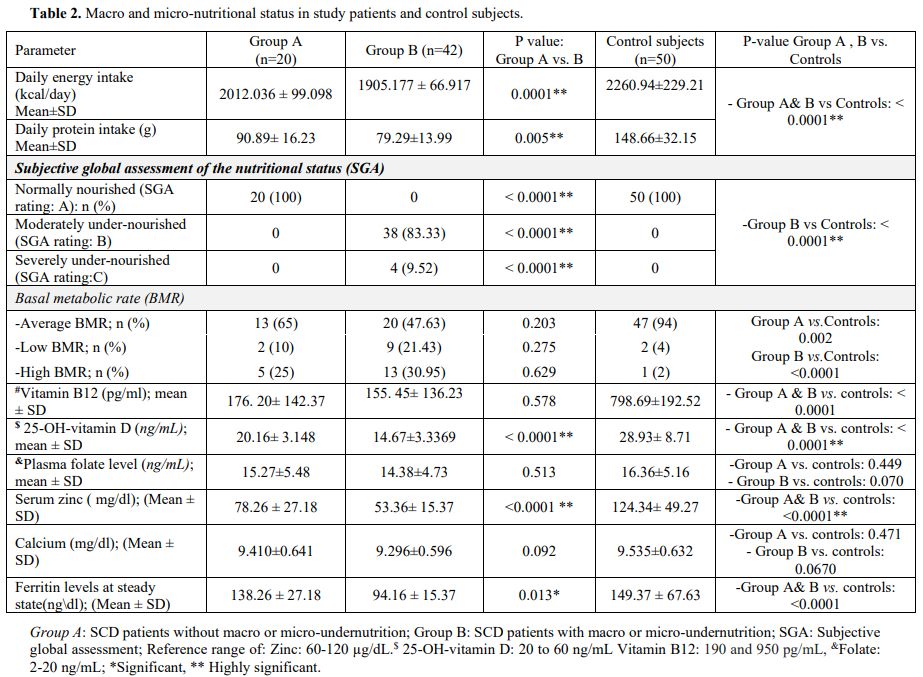 |
Table 2. Macro and micro-nutritional status in study patients and control subjects..
|
Among
Group B patients, 38 (83.33%) and 4 (9.52%) patients had moderate and
severe undernutrition (SGA rating B and C), respectively (Table 2).
The BMR was within average (-15%-+5% in 43 (69.35) patients, below
average in 7 (11.29), and above average in 12 (19.35) patients with a
significant difference between patient groups and control subjects (Table 2).
In most under-nourished patients, sub-optimal food intake resulted from
gastrointestinal complaints, including anorexia, dyspepsia, nausea,
vomiting, diarrhea, and food intolerance frequent hospital admissions
due to VOC attacks (data not shown).
At
baseline, patients showed significantly low serum zinc, vitamin B12,
and vitamin D levels than control subjects (P<0.0001). Within SCD
patients, zinc and vitamin D levels were significantly lower in Group B
patients compared to Group A (P= <0.0001 for both) (Table 2).
Patients with zinc deficiency suffered from reduced appetite and
diarrhea, which further deteriorated the undernutrition in such
patients. Through the study, patients received vitamin B, vitamin D,
and zinc supplementation with subsequent improvement. However, a
decline in vitamins B, D, and zinc levels occurred with the onset of
vaso-occlusive-related complications (data not shown).
Folate and calcium levels did not differ significantly between patients
and control subjects or well-nourished and undernourished patients (Table 2).
At
study entry and through follow-up, anthropometric measurements were
significantly lower in SCD patients than control subjects (Supplementary Table 1). The BMI, MUAC, and body fat values were lower in Group B than Group A patients (Table 1 and Supplementary Table 1).
Males with SCD tend to have shorter stature (defined as s a standing
height more than two standard deviations (SDs) below the mean (or below
the 2.5 percentile for sex) compared to control subjects (Table 1).
SCD course, complications, survival, and outcomes during follow-up.
During the year preceding enrollment, Group B patients had more
frequent VOC episodes compared to Group A patients. At study entry, the
baseline SCD severity scores were significantly higher in
under-nourished (Group B) patients compared to well-nourished
individuals (Group A) (Table 3).
During follow-up, 42 undernourished and 4 well-nourished patients
(74.19%) developed one or more vaso-occlusive pain crises and other SCD
related complications that required hospitalization or emergency
management (Table 3). The major
events that required hospitalization were vaso-occlusive pain crises,
acute chest syndrome, stroke, pulmonary hypertension, cardiomyopathy,
acute cholecystitis, acute sickle hepatic crisis, and priapism (Table 3).
Two patients in Group B developed acute cholestasis with elevated
hepatic transaminases (3 times upper normal) during an acute VOC pain
crisis. Renal involvement occurred in 21 (33.87%) SCD patients in the
form of proteinuria, microalbuminuria (30–300 mg/g creatinine) and
macroalbuminuria (>300 mg/g creatinine), in 10/21 (47.62%), 7
(33.33%) and 3 (14.29%) SCD patients respectively (Table 3).
During
follow-up, seven patients (11.29%) died in Group B, and no mortalities
occurred either in Group A or the control group. The relative risk was
14.43 (95% CI: 0.846 to 46.2664; P= 0.05). The causes of mortality were
myocardial infarction (2 patients), stroke (2 patients), pulmonary
embolism (one patient), acute chest syndrome (one patient), and a
patient who died in a traffic accident (Table 3; Figure 1a).
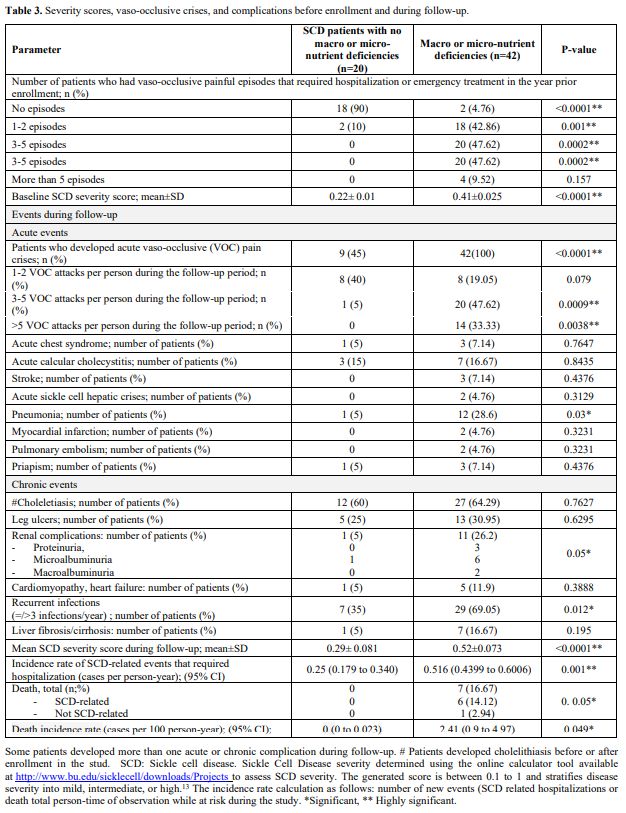 |
Table 3. Severity scores, vaso-occlusive crises, and complications before enrollment and during follow-up. |
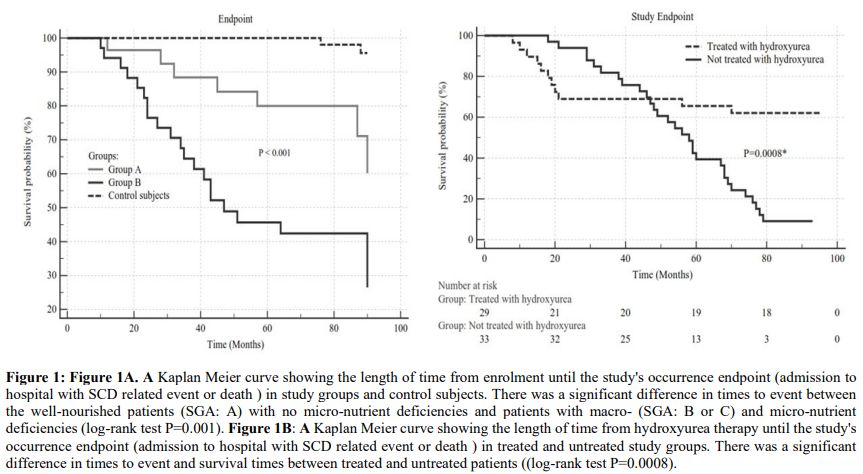 |
Figure 1. Figure 1A. A
Kaplan Meier curve showing the length of time from enrolment until the
study's occurrence endpoint (admission to hospital with SCD related
event or death) in study groups and control subjects. There was a
significant difference in times to event between the well-nourished
patients (SGA: A) with no micro-nutrient deficiencies and patients with
macro- (SGA: B or C) and micro-nutrient deficiencies (log-rank test
P=0.001). Figure 1B: A Kaplan
Meier curve showing the length of time from hydroxyurea therapy until
the study's occurrence endpoint (admission to hospital with SCD related
event or death) in treated and untreated study groups. There was a
significant difference in times to event and survival times between
treated and untreated patients ((log-rank test P=0.0008). |
Associations between nutritional parameters and SCD severity and outcome.
A significant inverse correlation existed between each of daily energy
intake, BMI, serum zinc levels, vitamin D levels, and SCD severity
scores (P<0.001) (Figure 2a,b,c,d).
We calculated the attributable risk and attributable risk percent to
estimate how much of this study outcome was attributable to
undernutrition. The attributable risk was 0.598, and the attributable
risk percent was 88.28%, suggesting that malnutrition may be
responsible for 88% of the severe outcomes of SCD. Multivariate
logistic regression analysis showed that being a male with energy
intake less than 1600, SGA scores B or C, a BMI less than 18,
hemoglobin levels less than 6 gm/dl, vitamin D levels less than 16
ng/mL, and zinc levels less than 60 ng/dl were independent risk factors
for a more severe SCD score and worse outcome (Table 4).
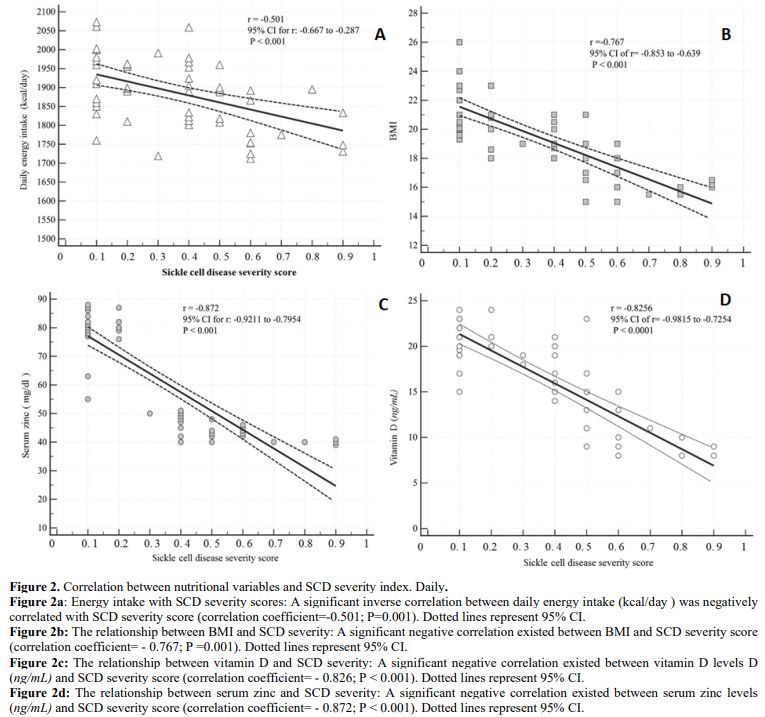 |
Figure 2. Correlation between nutritional variables and SCD severity index. Daily.
Figure
2a: Energy intake with SCD severity scores: A significant inverse
correlation between daily energy intake (kcal/day) was negatively
correlated with SCD severity score (correlation coefficient=-0.501;
P=0.001). Dotted lines represent 95% CI.
Figure 2b:
The relationship between BMI and SCD severity: A significant negative
correlation existed between BMI and SCD severity score (correlation
coefficient= - 0.767; P =0.001). Dotted lines represent 95% CI.
Figure 2c:
The relationship between vitamin D and SCD severity: A significant
negative correlation existed between vitamin D levels D (ng/mL) and SCD
severity score (correlation coefficient= - 0.826; P < 0.001). Dotted
lines represent 95% CI.
Figure 2d:
The relationship between serum zinc and SCD severity: A significant
negative correlation existed between serum zinc levels (ng/mL) and SCD
severity score (correlation coefficient= - 0.872; P < 0.001). Dotted
lines represent 95% CI. |
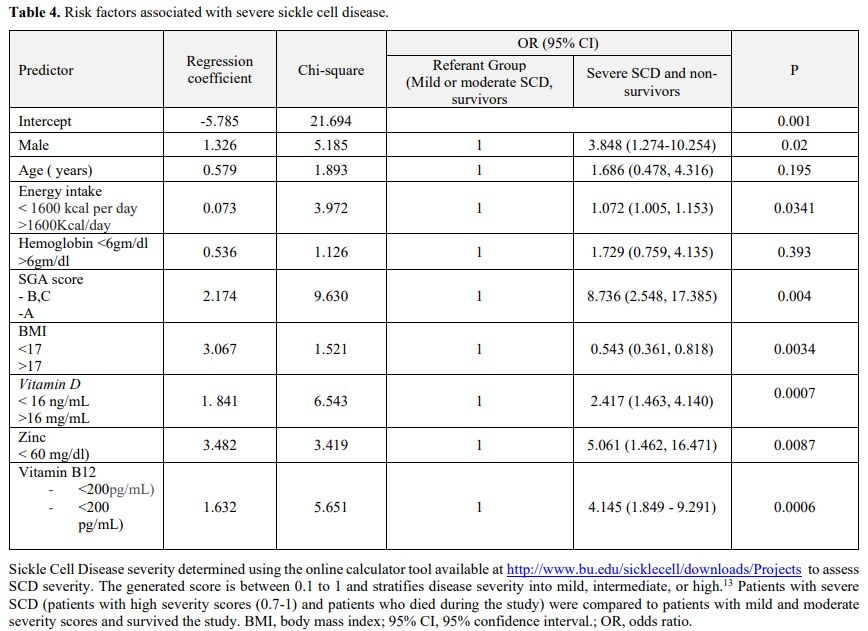 |
Table 4. Risk factors associated with severe sickle cell disease. |
Influence
of nutritional supplementation and management of gastrointestinal
complaints on SCD manifestations. During follow-up, patients with
energy-protein and micro-undernutrition had a nutritional consultation
with correction of energy deficit and vitamin D and zinc
supplementation, which was followed by improved symptoms and signs.
However, VOC crises were associated with a decline in vitamin D and
zinc in some patients (Supplementary Figure 1).
Patients with gastrointestinal disorders such as Helicobacter pylori
infection, inflammatory bowel disease received proper pharmacologic
therapy, and those with celiac disease and lactose intolerance complied
with gluten and dairy-free diets resulting in improvement of food
intake amelioration of macro-and micro-nutritional parameters, and
improvement of body composition. (Figure 3).
The outcome of disease-modifying measures.
Seven patients (2 in group A and 5 in group B) were receiving
hydroxyurea before enrollment, and 20 patients initiated HU therapy
during the study (Supplementary Table 2).
Hydroxyurea therapy was associated with a significant reduction in VOC
episodes' frequency and improvement in the SCD severity scores. The
decrease in SCD severity resulted in a tangible enhancement in macro
and micronutrition (Figure 2b and Supplementary Table 2).
Ten patients (one in group A and 9 in group B) received three or more blood transfusions in the year before study entry (Table 1).
Three (4.84%) patients who received =/> three transfusions per year
due to repeated complications developed iron overload after (Table 3) (Figure 3c).
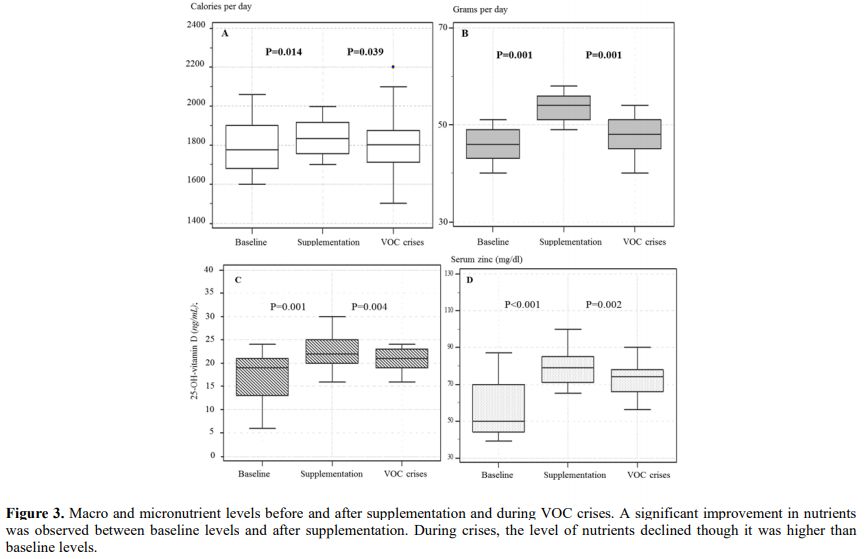 |
Figure 3 Macro and
micronutrient levels before and after supplementation and during VOC
crises. A significant improvement in nutrients was observed between
baseline levels and after supplementation. During crises, the level of
nutrients declined though it was higher than baseline levels.
|
Health-related quality of life assessment. Table 5
demonstrates the mean ± SD scores of SF-36 in well-nourished (Group A),
undernourished SCD patients (Group B), and control subjects. Compared
to controls, SCD patients had inferior self-reported quality of life,
with a significant decrease in the total SF-26 scores and subdomains.
Through follow-up, improving the patients' nutrition and
supplementation of zinc and vitamin D significantly improved the HRQoL
scores (data not shown).
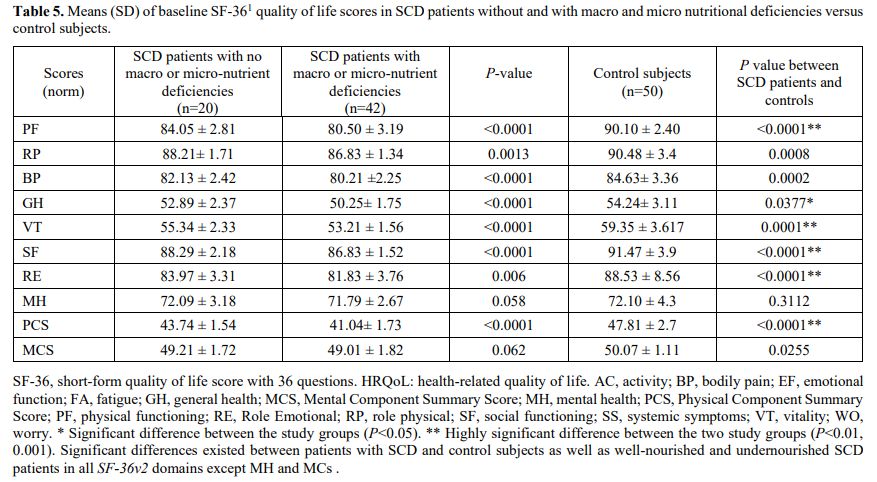 |
Table 5. Means (SD) of
baseline SF-361 quality of life scores in SCD patients without and with
macro and micro nutritional deficiencies versus control subjects.
|
Discussion
Due
to the improvement in the diagnosis and management of SCD, the survival
rates of children with SCD have increased, and SCD is currently a
chronic disease that causes considerable morbidity and mortality in
adults. [1,33,34] The impact of
nutrition on the course and severity of SCD is not clarified;
therefore, this longitudinal study enrolled and prospectively followed
a well-characterized cohort of adult patients in steady-state SCD. The
current study showed that a considerable percentage of the enrolled
patients suffered from degrees of macro-and micronutrient deficiencies,
which contribute to increased SCD severity, more complications, worse
prognosis, and low quality of life.
The malnourished study
group's childhood medical records showed that those patients had body
composition abnormalities, inadequate nutrition, and endocrinal
disturbances since childhood that persisted into adulthood; thus, our
results lend further credence to previous studies on pediatric cohorts.[33,34]
The malnutrition in this cohort was not due to food deprivation or
shortage resulting from financial constraints since the economic status
and household income did not differ significantly between the two SCD
patients and control subjects. The etiology of the quantitative and
qualitative malnutrition observed in a subset of this study's SCD
patients is multifactorial, resulting from lack of intake or uptake of
macro or micronutrients triggered by SCD increased nutritional demands,
concomitant chronic gastrointestinal diseases and infections,
socio-demographic and lifestyle factors. Before enrollment and
follow-up, most SCD study patients had frequent hospitalizations due to
vaso-occlusive crises and SCD-related complications, including
infections. As shown by several reports,[35]
hospitalized patients show a high malnutrition rate; however, this was
not the sole cause of inadequate nutrition in this study. The study
demonstrated that several SCD patients suffered from chronic
gastrointestinal and hepatic disorders such as gastroesophageal reflux,
IBD, celiac disease, and chronic viral hepatitis, which result in
malnutrition due to malabsorption, altered nutrient metabolism,
hypermetabolism, and anorexia.[36,37,38] In the
current study, the frequency of CD and IBD among the SCD was higher
than in the control group and in the general population;[39,40]
furthermore, some patients had more than one family member suffering
from concomitant SCD and either celiac or IBD. The high frequency of
celiac disease and inflammatory bowel disease among SCD malnourished
was intriguing, and to our knowledge, has not been reported before.
Consanguinity, which is frequent in the Kingdom of Saudi Arabia, may
play a role in such association since the three disorders, SCD, celiac
disease, and IBD, have genetic determinants. The potential association
of SCD with either CD or IBD requires further studies to investigate if
such associations exist in other patients with other ethnic
backgrounds.
In agreement with previous reports on pediatric cohorts,[41,42,43]
this study demonstrated that adults with SCD had deficiencies of zinc
and vitamins B12 and D that contributed to the severity of SCD. Vitamin
D deficiency is highly prevalent in Saudi Arabia due to decreased sun
exposure because of the hot climate and traditional wear, covering the
entire body.[41] The large-scale economic growth and
social development in KSA were associated with alterations in the
dietary patterns and food choices with increased consumption of
fast-foods that lack important nutritive constituents resulting in
nutrient deficiencies. The concomitant SCD and H.pylori
infection or celiac disease or IBD observed in this study played a role
in micronutrient malabsorption. In the current study, SCD patients'
clinical manifestations and health-related quality of life
significantly improved after personalized micronutrient integration,
further supporting the findings of studies,[44,45]
which demonstrated early recognition of nutritional insufficiencies and
nutrient supplementation is crucial for improving SCD outcomes not only
in children but also in adult patients.
The present study has
several strengths, including its prospective design, which enabled us
to longitudinally assess the clinical, nutritional, and endocrinal
parameters complications and health-assess related quality of life and
outcome of the disease over eight years. The study provided insight on
the etiology of malnutrition in SCD patients and the impact of
integrating nutritional management into the SCD standard of care to
improve the disease outcomes. Nevertheless, the study also has
limitations. This study enrolled Saudi patients and control subjects
without including other ethnicities. Given that disorders such as
vitamin D deficiency and hypothyroidism are frequent in the Saudi
population, we could not specify the actual incidence and clinical
implications of such disorders on SCD. The study enrolled a relatively
young population (median of 25 years) and followed them for almost
eight years; however, it is crucial to conduct more longitudinal
studies to investigate the effect of aging on SCD progression rates,
morbidities, and mortality rates. Initially, we attempted to enroll 62
matched healthy control subjects to achieved a case-control ratio of
1:1. However, twelve control subjects were excluded due to the failure
to provide consent to join the study or non-compliance to clinical
visits.
Conclusions
Our
results show that adults with sickle cell disease have multifactorial
macro and micro- malnutrition, which are associated with severe
disease, increased hospital admissions, and lower HRQoL. Integrating
the diagnosis and correction of macro and micronutrient deficiencies
into the standard management of SCD is critical for improving clinical
outcomes and the patient's quality of life.
Acknowledgments
The
authors like to thank the Deanship of Scientific Research, Prince
Sattam Bin Abdul Aziz University, for supporting the study. We would
also like to thank Dr. Maysa Moustafa for her assistance in conducting
hormonal assays.
References
- Piel FB, Steinberg MH, Rees DC. Sickle Cell Disease. N Engl J Med 2017 April 376;16: 1561-1573 https://doi.org/10.1056/NEJMra1510865 PMid:28423290
- Modell
B, Darlison M Global epidemiology of haemoglobin disorders and derived
service indicators. Bull World Health Organ 2008; 86: 480-487 https://doi.org/10.2471/BLT.06.036673 PMid:18568278 PMCid:PMC2647473
- Macharia
AW, Mochamah G, Uygoga S, Ndia CM et al. The clinical epidemiology of
sickle cell anemia In Africa. Am J Hematol. 2018 Mar; 93(3): 363-370. https://doi.org/10.1002/ajh.24986 PMid:29168218 PMCid:PMC6175377
- Hassell KL. Population estimates of sickle cell disease in the US. Am J Prev Med. 2010;38(4 suppl):S512-S521 https://doi.org/10.1016/j.amepre.2009.12.022 PMid:20331952
- Piel
FB, Talem AJ, Huang Z, Gupta S, Williams TN, Weatherall DJ. Global
migration and the changing distribution of sickle haemoglobin: a
quantitative study of temporal trends between 1960 and 2000. Lancet
Glob Health. 2014 Feb; 2(2): e80-e89. https://doi.org/10.1016/S2214-109X(13)70150-5
- Mohieldin
Elsayid, Mohammed Jahman Al-Shehri, Yasser Abdullah Alkulaibi, Abdullah
Alanazi, Shoeb Qureshi. Frequency distribution of sickle cell anemia,
sickle cell trait and sickle/beta-thalassemia among anemic patients in
Saudi Arabia. J Nat Sci Biol Med. 2015 Aug; 6(Suppl 1): S85-S88. https://doi.org/10.4103/0976-9668.166093 PMid:26604627 PMCid:PMC4630771
- Jastaniah W. Epidemiology of sickle cell disease in Saudi Arabia. Ann Saudi Med. 2011 May-Jun; 31(3): 289-293. https://doi.org/10.5144/0256-4947.2011.289 PMid:21623060 PMCid:PMC3119971
- Sundd P, Gladwin MT, Novelli EM. Pathophysiology of sickle cell disease. Annu Rev Pathol. 2019 Jan 24;14:263-292 https://doi.org/10.1146/annurev-pathmechdis-012418-012838 PMid:30332562 PMCid:PMC7053558
- Manwani
D, Frenette PS. Vaso-occlusion in sickle cell disease: Pathophysiology
and novel targeted therapies. Blood 2013 Dec 5;122(24):3892-8. https://doi.org/10.1182/blood-2013-05-498311 PMid:24052549 PMCid:PMC3854110
- Quinn
CT. Clinical severity in sickle cell disease: The challenges of
definition and prognostication. Exp Biol Med. 2016 Apr; 241(7):679-88 https://doi.org/10.1177/1535370216640385 PMid:27013545 PMCid:PMC4871738
- Brousseau
DC, Owens PL, Mosso AL, Panepinto JA, Steiner CA acute care utilization
and re-hospitalizations for sickle cell disease. JAMA, 2010; 303:
1288-1294. https://doi.org/10.1001/jama.2010.378 PMid:20371788
- Miller
ST, Sleeper LA, Pegelow CH, Enos LE, Wang WC, Weiner SJ, Wethers DL,
Smith J, Kinney TR. Prediction of adverse outcomes in children with
sickle cell disease. N Engl J Med 2000; 342: 83-9. https://doi.org/10.1056/NEJM200001133420203 PMid:10631276
- Sebastiani
P, Nolan VG, Baldwin CT, Abad-Grau MM, Wang L, Adewoye AH, Lillian C
McMahon, Farrer L, Taylor J, Kato GJ, Gladwin MT, Steinberg MH. A
network model to predict the risk of death in sickle cell disease.
Blood. 2007 Oct 1;110(7):2727-35. https://doi.org/10.1182/blood-2007-04-084921 PMid:17600133 PMCid:PMC1988954
- Burke
L, Hobart JC, Fox C, Lehrer-Graiwer,J, Bridges K, Kraus M, Rames F. The
10-Item sickle cell disease severity measure (SCDSM-10): A novel
measure of daily SCD symptom severity developed to assess benefit of
GBT440, an experimental HbS polymerization inhibitor. Blood 2016; 128
(22): 4760. https://doi.org/10.1182/blood.V128.22.4760.4760
- Cameron
BF, Christian E, Lobel JS, Gaston MH. Evaluation of clinical severity
in sickle cell disease. J Natl Med Assoc 1983 May;75(5):483-7.13
- Day SW. Development and evaluation of a sickle cell assessment instrument. Pediatr Nurs 2004 Nov;30 (6):451- 8.
- Adekile
A, Kutlar F, McKie K, Addington A, Elam D, Holley L, Clair B, Kutlar A.
The influence of uridine diphosphate glucuronosyl transferase 1A
promoter polymorphisms, beta-globin gene haplotype, co-inherited
alpha-thalassemia trait and Hb F on steady-state serum bilirubin levels
in sickle cell anemia. Eur J Haematol 2005; 75: 150-5. https://doi.org/10.1111/j.1600-0609.2005.00477.x PMid:16004608
- Miller ST, Milton J, Steinberg MH. G6PD deficiency and stroke in the CSSCD. Am J Hematol 2011; 86: 331-331. https://doi.org/10.1002/ajh.21958 PMid:21328436
- Piel
FB, Tewari S, Brousse V, Analitis A, Font A, Menzel S, Chakravorty S,
Thein SL, Inusa B, Telfer P, de Montalembert M, Fuller GW, Katsouyanni
K, Rees DC. Associations between environmental factors and hospital
admissions for sickle cell disease. Haematologica. 2017
Apr;102(4):666-675. https://doi.org/10.3324/haematol.2016.154245 PMid:27909222 PMCid:PMC5395107
- Mekontso
Dessap A, Contou D, Dandine-Roulland C, Hemery F, Habibi A,
Charles-Nelson A, Galacteros F, Brun-Buisson C, Maitre B, Katsahian S.
Environmental influences on daily emergency admissions in sickle-cell
disease patients. Medicine (Baltimore). 2014 Dec;93(29):e280. https://doi.org/10.1097/MD.0000000000000280 PMid:25546672 PMCid:PMC4602624
- Cano N, Melchior JC. Malnutrition in chronic diseases. Rev Prat. 2003;53(3):268-73.
- Von
Ruesten A, Feller S, Bergmann MM, Boeing H. Diet and risk of chronic
diseases: results from the first 8 years of follow-up in the
EPIC-Potsdam study. European Journal of Clinical Nutrition 2013; 67:
412-419. https://doi.org/10.1038/ejcn.2013.7 PMid:23388667
- Saunders J. Malnutrition: causes and consequences. Clin Med (Lond). 2010 Dec; 10(6): 624-627. https://doi.org/10.7861/clinmedicine.10-6-624 PMid:21413492 PMCid:PMC4951875
- Bourke
CD, Berkley JA, Prendergast AJ. Immune dysfunction as a cause and
consequence of malnutrition. Trends Immunol. 2016 Jun; 37(6): 386-398. https://doi.org/10.1016/j.it.2016.04.003 PMid:27237815 PMCid:PMC4889773
- Foucher
J, Chanteloup E, Vergniol J, Castéra L, Bail B, Adhoute X, et al.
Diagnosis of cirrhosis by transient elastography (FibroScan): a
prospective study. Gut 2006;55(3):403‐8. https://doi.org/10.1136/gut.2005.069153 PMid:16020491 PMCid:PMC1856085
- Subjective global assessment form (Internet) available at: https://www.rand.org/health-care/surveys_tools/mos/36-item-short-form.html. Accessed on: 14/2/2020.
- World Health Organization. WHO Global Database on Body Mass Index. WHO-BMI 2018 [Internet]. Retrieved from http://apps.who.int/bmi/index.jsp on 16/1/2020
- Jackson A S, Pollock, M. Practical assessment of body composition. Physician Sport Med. 1985; 13: 76-90. https://doi.org/10.1080/00913847.1985.11708790 PMid:27463295
- World
Health Organization. Use and interpretation of anthropometric
indicators of nutritional status. Bull World Health Organ 1986; 64,
929-941.
- Nevitt SJ, Jones AP, Howard J.
Hydroxyurea (hydroxycarbamide) for sickle cell disease. Cochrane
Database Syst Rev. 2017 Apr 20;4(4):CD002202 https://doi.org/10.1002/14651858.CD002202.pub2 PMid:28426137 PMCid:PMC6478259
- The 36-Item Short Form Survey (SF-36) (Internet) available at: https://www.physio-pedia.com/36-Item_Short_Form_Survey_(SF-36)
- Coons
S, Abdulmohsin SA, Draugalis JR, Hays RD. Reliability of an Arabic
Version of the RAND-36 Health Survey and Its Equivalence to the
US-English Version. Medical Care, 1998; 36, (3): 428-43 https://doi.org/10.1097/00005650-199803000-00018 PMid:9520966
- Hankins
JS, Estepp JH, Hodges JR, Villavicencio MA, Robison LL, Weiss MJ, Kang
G, Schreiber JE, Porter JS, Kaste SC, Saving KL, Bryant PC, Deyo JE,
Nottage KA, King AA, Brandow AM, Lebensburger JD, Adesina O, Chou ST,
Zemel BS, Smeltzer MP, Wang WC, Gurney JG. Sickle Cell Clinical
Research and Intervention Program (SCCRIP): A lifespan cohort study for
sickle cell disease progression from the pediatric stage into
adulthood. Pediatr Blood Cancer. 2018 Sep;65(9):e27228 https://doi.org/10.1002/pbc.27228 PMid:29797644
- Oyedeji
C, Strouse JJ, Crawford RD, Garrett ME, Ashley-Koch AE, Telen MJ. A
multi-institutional comparison of younger and older adults with sickle
cell disease. Am J Hematol. 2019 Apr;94(4):E115-E117. https://doi.org/10.1002/ajh.25405 PMid:30663090 PMCid:PMC6449149
- Ruiz
AJ, Buitrago G, Rodríguez N, Gómez G, Sulo S, Gómez C, Partridge J,
Misas J, Dennis R, Alba MJ, Chaves-Santiago W, Araque Clinical and
economic outcomes associated with malnutrition in hospitalized
patients. J Clin Nutr. 2019 Jun;38(3):1310-1316. https://doi.org/10.1016/j.clnu.2018.05.016 PMid:29891224
- Lebwohl B., Sanders D.S., Green P.H.R. Coeliac Disease. Lancet. 2018;391:70-81 https://doi.org/10.1016/S0140-6736(17)31796-8
- Pulley
J, Todd A, Flatley C, Begun J. Malnutrition and quality of life among
adult inflammatory bowel disease patients. Journal Gastentol Hepatol
(JGH). 2020; 4 (3): 454-460 https://doi.org/10.1002/jgh3.12278 PMid:32514453 PMCid:PMC7273715
- Huisman
EJ, Trip EJ, Siersema PD, van Hoek B, van Erpecum KJ. Protein-energy
malnutrition predicts complications in liver cirrhosis. Eur J
Gastroenterol Hepatol 2011;23:982-989 https://doi.org/10.1097/MEG.0b013e32834aa4bb PMid:21971339
- Saeed
A, Assir Ai, Assiri H, Ullah A, Rashid M. Celiac disease in Saudi
children: Evaluation of clinical features and diagnosis. 2017 Saudi Med
J; 38(9): 895-899. https://doi.org/10.15537/smj.2017.9.20808 PMid:28889146 PMCid:PMC5654022
- Fadda
A, Peedikayil MC, Kagevi I, Al Kahtani K, Ben Mousa A, Al Ashgar HI, Al
Sohaiban Hi, Al Quaiz M, Abdulla A, Khan MQ, Helmy A. Inflammatory
bowel disease in Saudi Arabia: a hospital-based clinical study of 312
patients. 2012 Ann Saudi Med; 32(3): 276-282. https://doi.org/10.5144/0256-4947.2012.276 PMid:22588439 PMCid:PMC6081028
- Lee
MT, Licursi M, McMahon DJ. Vitamin D deficiency and acute
vaso-occlusive complications in children with sickle cell disease.
Pediatr Blood Cancer; 2015;62(4):643-7. https://doi.org/10.1002/pbc.25399 PMid:25641631
- Ajayi
OI, Bwayo-Weaver S, Chirla S, Serlemitsos-Day M, Daniel M, Nouraie M,
Edwards K, Castro O, Lombardo F, Gordeuk VR Cobalamin status in sickle
cell disease. .Int J Lab Hematol. 2013 Feb;35(1):31-7. https://doi.org/10.1111/j.1751-553X.2012.01457.x PMid:22830455 PMCid:PMC3484229
- Antwi-Boasiako
C, Dankwah GB, Aryee R, Hayfron-Benjamin C, Doku A, N'guessan BB,
Asiedu-Gyekye IJ, Campbell AD. Serum iron levels and copper-to-zinc
ratio in sickle cell disease. Medicina 2019 ; 55(5): 180. https://doi.org/10.3390/medicina55050180 PMid:31117252 PMCid:PMC6572688
- Martyres
DJ, Vijenthira A , Barrowman N, Harris-Janz S, Chretien C, Klaassen RJ.
Nutrient insufficiencies/deficiencies in children with sickle cell
disease and its association with increased disease severity. Pediatr
Blood Cancer, 2016;63(6):1060-4. https://doi.org/10.1002/pbc.25940 PMid:26855061
- Mandese
V, Marotti F, Bedetti L, Bigi E, Palazzi G, Iughetti L. Effects of
nutritional intake on disease severity in children with sickle cell
disease. Nutr J. 2016 Apr 30;15(1):46. https://doi.org/10.1186/s12937-016-0159-8 PMid:27130184 PMCid:PMC4851811
Supplementary Files
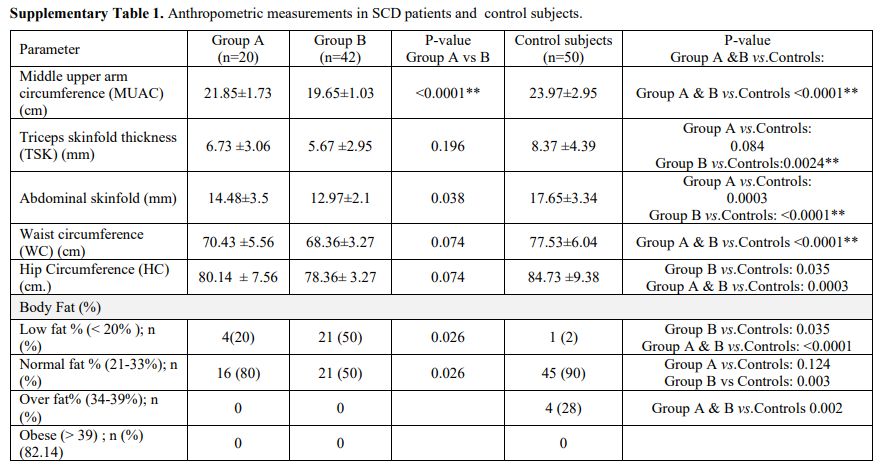 |
Supplementary Table 1. Anthropometric measurements in SCD patients and control subjects.
|
|
Supplementary Table 2. Parameters of patients treated with hydroxyurea versus those not treated.
|
[TOP]