Vincenzo De Sanctis1, Ashraf T Soliman2, Ploutarchos Tzoulis3, Shahina Daar4, Salvatore Di Maio5, Bernadette Fiscina6 and Christos Kattamis7.
1 Coordinator
of ICET-A Network (International Network of Clinicians for
Endocrinopathies in Thalassemia and Adolescent Medicine) and Pediatric
and Adolescent Outpatient Clinic, Quisisana Hospital, Ferrara, Italy.
2
Department of Pediatrics, Division of Endocrinology, Hamad General
Hospital, Doha, Qatar and Department of Pediatrics, Division of
Endocrinology, Alexandria University Children’s Hospital, Alexandria,
Egypt.
3 Department of Diabetes and Endocrinology, Whittington Hospital, University College London, London, UK.
4 Department of Haematology, College of Medicine and Health Sciences, Sultan Qaboos University, Muscat, Sultanate of Oman.
5 Emeritus Director in Pediatrics, Children’s Hospital “Santobono-Pausilipon”, Naples, Italy.
6 Department of Pediatrics, NYU School of Medicine, New York, NY, USA.
7 First Department of Paediatrics, National Kapodistrian University of Athens 11527, Greece.
Correspondence to :Vincenzo
de Sanctis, MD, Pediatric and Adolescent Outpatient Clinic, Quisisana
Hospital, Ferrara, Viale Cavour, Ferrara 44121, Italy. Tel.
+39-532-770243. E-mail:
vdesanctis@libero.it
Published: September 1, 2021
Received: April 12, 2021
Accepted: June 6, 2021
Mediterr J Hematol Infect Dis 2021, 13(1): e2021051 DOI
10.4084/MJHID.2021.051
This is an Open Access article distributed
under the terms of the Creative Commons Attribution License
(https://creativecommons.org/licenses/by-nc/4.0),
which permits unrestricted use, distribution, and reproduction in any
medium, provided the original work is properly cited.
|
|
Abstract
Background: Glucose
dysregulation (GD), including prediabetes and diabetes mellitus (DM),
is a common complication of transfusion-dependent β-thalassemia (TDT)
patients. The prevalence increases with age and magnitude of iron
overload, affecting a significant proportion of patients. According to
the international guidelines, the development of GD is frequently
asymptomatic. Therefore, an early diagnosis requires an annual oral
glucose tolerance test (OGTT) in all TDT patients aged ten years or
older.
Purpose: This
retrospective study aims to evaluate the prevalence of GD in a
homogenous population of prepubertal TDT patients and to enhance
understanding of the pathogenesis and progression of glucose
homeostasis in this group of patients.
Methods: A
selected group of 28 TDT patients was followed for at least 10.3 years
(range: 10.3 - 28.10 years) from prepubertal age (mean 11.0 ± standard
deviation 1.1 years) to adulthood (28.7 ± 3.7 years). Glucose tolerance
and insulin response to OGTT were assessed, and indices of β-cell
function, insulin sensitivity, and insulin secretion were calculated.
Results: At
baseline, 18 TDT patients had normal glucose tolerance (NGT) and 10
had isolated impaired fasting glycemia (IFG), according to the American
Diabetes Association (ADA) criteria. Compared to 18 healthy prepubertal
controls (mean ± SD age: 10.9 ± 1.1 years), the fasting plasma glucose
(FPG), basal insulin level, and Homeostatic Model Assessment for
Insulin Resistance (HOMA-IR) index were significantly higher in the
group of TDT patients (p= 0.001, 0.01 and 0.012, respectively). At the
last observation, 7/18 patients (38.8%) with NGT and 9/10 (90%) with
IFG at baseline deteriorated; 3 female patients developed type 2 DM (1
from the NGT group and 2 from the IFG group). Compared to adult
controls, TDT patients with NGT had a reduced oral disposition index
(DI) (p= 0.006) but no significant difference in HOMA-IR and Matsuda
index. Conversely, all insulin indices (HOMA-IR, MI, and DI) but one
[insulinogenic index (IGI)] were statistically different in TDT
patients with GD compared to controls.
Conclusion: This
study underlines the concept that the spectrum of glucose tolerance in
TDT patients represents a continuum of glucose homeostasis disturbances
and that prepubertal patients with IFG are at higher risk of developing
a further deterioration of glucose metabolism with time. Moreover, it
appears that one-third of adult TDT patients with normal fasting
glucose may develop GD in the second-third decade of life. Thus, early
intervention could help to prevent an expected further decline of
glucose tolerance.
|
Introduction
Over
the past 40 years, the improved life expectancy of patients with
transfusion-dependent thalassemia (TDT) has led to the emergence of new
complications, such as glucose dysregulation (GD), including
prediabetes and diabetes mellitus (DM).[1] The
progression from normoglycemia to DM takes several years and involves
intermediate stages of dysglycemia. The wide variation in GD prevalence
in TDT patients has been attributed to a number of factors: the
patient's age, the total and annual blood consumption, degree of iron
load, and the efficacy of chelation therapy based on the type of
chelators and compliance to treatment. Higher serum ferritin levels
(SF) and increased levels of liver enzymes may adversely affect glucose
homeostasis.[1-4] Therefore, early detection of GD is
expected to play an important preventive role in its deterioration; at
present this is an area of considerable research interest for TDT
patients.
Although GD has become a well-recognized complication of older children with TDT,[3,4] data are lacking on the natural history of this condition.
The
aim of this retrospective study was to evaluate the progression of GD
in a homogenous population of prepubertal TDT patients followed closely
for a long period.
Patients and Methods
The
records of 28 prepubertal TDT patients followed annually for at least
10.3 years (range: 10.3 - 28.10 years) from prepubertal age (mean 11.0
± standard deviation 1.1 years) to adulthood (28.7 ± 3.7 years) were
reviewed. Glucose tolerance and insulin response to the oral glucose
tolerance test (OGTT) were analyzed, and indices of β-cell function,
insulin sensitivity, and insulin secretion were calculated. All TDT
patients were of Italian ethnic origin.
Eighteen healthy
prepubertal children (mean age: 10.9 ± 1.1 years; 10 males) and 16
healthy volunteer adult subjects (mean age: 23.6 ± 3.5 years; 8 males)
served as controls. All were brothers, sisters, or cousins of TDT
patients. None of them was a carrier for β-thalassemia or overweight.
Data Collection and Clinical Measurements.
Data collection included: demographic characteristics, gender, age at
first transfusion, the interval between transfusions, compliance to
iron chelation, anthropometry (weight, height, BMI, pubertal status),
and endocrine complications. Height and weight were measured according
to international recommendations. Bodyweight was measured, wearing
minimal underclothes, to the nearest 100 g on properly calibrated
scales. BMI was calculated by the following formula: weight in Kg/
height in m2. An adult patient was considered obese when BMI exceeded 30 Kg/m2,
overweight when BMI was 25 - 30 kg/m². A child or an adolescent (<
18 years) was defined as overweight when the BMI was between the 75th and 95th
percentile and obese when the BMI was equal to or above the 95th
percentile. A subject was defined as underweight when the BMI value was
below the 5th percentile for age and sex in children and adults (>18 years) when BMI was < 19 kg/m2.[5]
Laboratory methods and assessment of iron overload.
Serum concentrations of alanine aminotransferase (ALT) and hepatitis C
virus seropositivity (HCV ab and HCV-RNA) were recorded to evaluate
liver status. The level of ALT was determined by an automated analyzer
(normal range 0–40 U/L). HCV antibodies had been tested annually since
1991.
Serum
ferritin (SF) was measured in the early years by radioimmunoassay at a
serum dilution of 1:1000 and in the last few years by
electrochemiluminescence immunoassays. The 90th percentile of reported normal values in females and males are 201 and 243 ng/ml respectively.[6]
To adequately discriminate between poorly chelated and well chelated patients, a cut-off point at SF1000,0 ng/mL was used.[7]
Cardiac
and hepatic hemosiderosis were assessed by magnetic resonance imaging
(MRI) T2* using a 1.5 T scanner (GE Signa/Excite HD, Milwaukee, WI,
USA).[17] Global cardiac T2* values were expressed in
msec, according to the following cut-off points: normal > 20 ms,
mild: 14–20 ms, moderate: 10–14 ms, severe < 10 ms.[8] Liver iron content (LIC) was quantified using the calibration curve introduced by Wood et al..[9]
The values were expressed in mg/g dry weight (d.w.) and classified into
mild (LIC > 3 and < 7), moderate (LIC > 7 and < 14) and
severe overload (LIC > 14).[10]
Testing procedure and interpretation of OGTT.
Glucose tolerance at baseline and during annual follow-up.
The OGTT (1.75 g/kg, max 75 g) was performed in the morning, after an
overnight fast, in subjects clinically stable and without a history of
acute infection in the previous 3 weeks. In patients with IFG, two
baseline measurements of plasma glucose (PG) were collected before
OGTT. In addition, blood samples were collected from a venous catheter
at 0, 30, 60, 90, and 120 minutes following oral glucose administration
to measure plasma glucose and insulin. During the test, subjects
remained at rest, either seated or lying. Plasma glucose was measured
using an automated glucose oxidase reaction. Plasma insulin levels were
determined by a commercial immunoassay technique.
Interpretation of plasma glucose levels after OGTT.
Depending on the results of the OGTT, patients were classified into
different subgroups of glucose metabolism according to the American
Diabetes Association (ADA) criteria:[11]
- Normal Glucose Tolerance (NGT): Fasting plasma glucose (FPG) < 100 mg/dL (< 5.6 mmol/L) and 2-h PG < 140 mg/dL (< 7.8 mmol/L),
- Impaired Fasting Glucose (IFG): FPG between 100 and 125 mg/dL (5.6-6.9 mmol/L),
- Impaired Glucose Tolerance (IGT): 2-h PG between 140 mg/dL and 199 mg/dL (7.8-11.0 mmol/L),
- Diabetes Mellitus (DM): FPG ≥ 126 mg/dL (≥7.0 mmol/L) or 2-h PG ≥ 200 mg/dL (≥11.1 mmol/L).
When OGTT was diagnostic of DM in asymptomatic patients, it was repeated after 4-6 weeks.
Calculations of variables:
a) Insulin secretion index:
For the evaluation of acute-phase serum insulin response, during OGTT,
the insulinogenic index (IGI) was calculated as the incremental change
in insulin concentration during the first 30 min of the OGTT divided by
the incremental change in glucose during the same period (Δ Ins 30–0/ Δ
Gluc 30-0).[12] The IGI is a proxy of the acute phase serum insulin response and was used for the evaluation of the β-cell function.
b) Insulin sensitivity indices:
To assess insulin sensitivity, the Homeostatic Model Assessment index
of insulin resistance (HOMA-IR) and Matsuda index were calculated with
the following equations: HOMA-IR: fasting glucose x fasting insulin/405[13]
and Matsuda index 0-120 (MI): [10,000/√ [(FPG 0 (mg/dL) x insulin 0
(μU/L)] x [(mean plasma glucose 0-120 (mg/dL) x mean insulin 0-120
(μU/L)].[14] The whole-body insulin sensitivity of MI combines both hepatic and peripheral tissue insulin sensitivity.
c) Β-cell function index:
To evaluate β-cell function adjusted for insulin sensitivity, the
authors calculated the disposition index (DI) as the product of the IGI
and MI (0-120 minutes during OGTT). The index reflects the relationship
between the β-cell function and the peripheral insulin sensitivity, as
the ability of β-cells to compensate for alterations in insulin
sensitivity.[15,16] Substantially, the DI shows the
failure of pancreatic β- cells to compensate for insulin resistance
(IR) in subjects at high risk for developing type 2 diabetes and IFG.
Statistical analysis: All numeric variables were expressed as mean, ±standard
deviation (SD). Comparison of different variables in the two groups was
made using unpaired student t-test and Mann-Whitney test for normal and
non-parametric variables, respectively. Continuous variables were also
compared using a one-way analysis of variance (ANOVA). Chi-square (χ2)
test was used to compare the frequency of qualitative variables among
the different groups. Pearson’s and Spearman’s correlation tests
(2-tailed) were used to study correlations between variables with
parametric and non-parametric distributions, respectively. A p-value
< 0.05 was considered statistically significant. For the statistical
analysis, a software program was used and validated, according to Alder
and Roesser.[17]
Ethics: All procedures were in accordance with the 1964 Helsinki declaration and its later amendments in October 2013 (www.wma.net).
The protocol was approved by the institutional board with the agreement
of the Thalassemia Patients’ Association (protocol number: 6/2018).
Informed consent was obtained from parents and each TDT patient after a
detailed explanation of the procedures for performing the OGTT test,
the nature and purpose of the study, and the patient's benefits for
collecting such information.
Results
At
baseline, 18 TDT patients had normal glucose tolerance (NGT) and 10
had isolated impaired fasting glycemia (IFG), according to the American
Diabetes Association (ADA) criteria. The FPG in 7 out of 10 ten
patients with isolated IFG were between 100-109 mg/dL (mean 103.8 ± 3.4
mg/dL) and between 110 -125 mg/dL (mean 117.3 ± 5.5 mg/dL) in the
remaining 3 patients.
Compared to 18 healthy prepubertal controls
(mean ± SD age: 10.9 ± 1.1 years), the fasting plasma glucose (FPG),
basal insulin level, and Homeostatic Model Assessment for Insulin
Resistance (HOMA-IR) index were significantly higher in the group of
TDT patients (p= 0.001, 0.01 and 0.01, respectively) (Table 1).
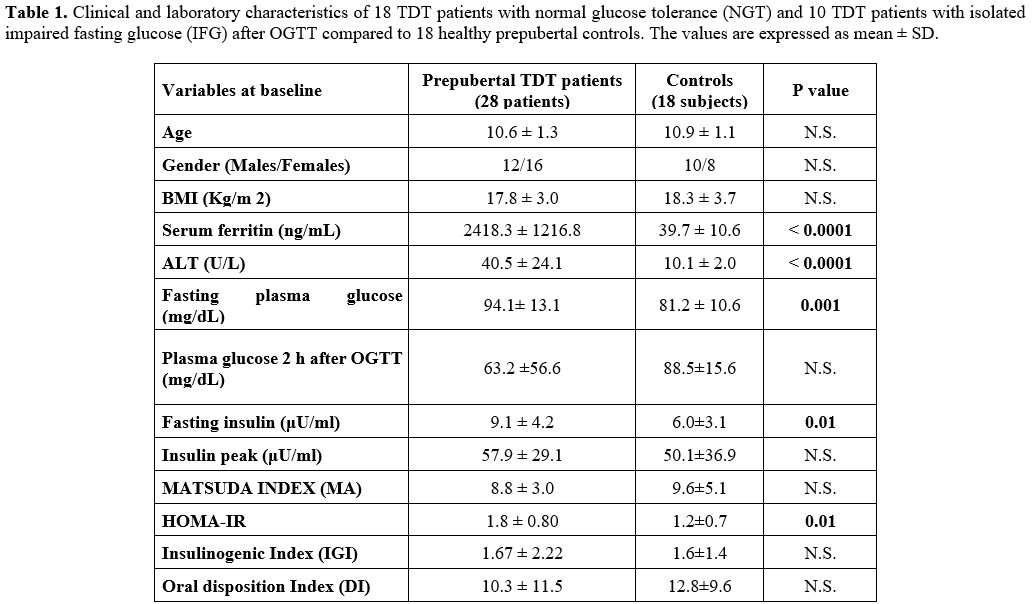 |
Table
1. Clinical and laboratory characteristics of 18 TDT patients with
normal glucose tolerance (NGT) and 10 TDT patients with isolated
impaired fasting glucose (IFG) after OGTT compared to 18 healthy
prepubertal controls. The values are expressed as mean ± SD.
|
A
significant linear correlation was observed between FBG and HOMA- IR (r
= 0.42749, p = 0.023), and an inverse correlation between HOMA- IR and
MI (r = - 0.615, p = 0.00049) and between 2-h PG and DI (r = - 0.378, p
= 0.047) in the prepubertal TDT group. No correlation was observed
between basal FPG in patients with IFG and plasma glucose level at 2-h
after OGTT (r: 0.2356, p= 0.51).
At
first detection of glucose tolerance deterioration registered during
the annual follow-up and mean age at the peak of serum ferritin level.
During the follow-up, 11 out of 18 patients with NGT (61.1%) had
deterioration of glucose homeostasis: 2 developed isolated IFG, 8 IGT,
and one a combination of IFG and IGT. Of the 10 TDT patients with
isolated IFG at baseline, 2 developed IGT, 7 IFG plus IGT. One patient
with a SF of 1055.0 ng/mL reverted to NGT.
The mean age at the
first detection of glucose deterioration was 23.0 ± 4.9 yrs in patients
with NGT at baseline, and 17.2 ± 4.9 yrs in patients with isolated IFG
(p = 0.042). The time interval from baseline to deterioration of
glucose homeostasis in the two groups of patients (NGT vs. IFG) was
12.1 ± 6.1 yrs and 7.3 ± 5.7 yrs (p= 0.044), respectively. At 20 yrs of
age, 36% of 28 TDT patients were identified by annual OGTT as having
GD. Eight patients were females, and 12 were males.
A SF peak of 2900.5 ± 1128.5 ng/mL was registered at a mean age of 15.6 ± 5.9 years.
The
mean SF level at the first appearance of GD in the entire group of 20
TDT patients who developed GD was 2031.4 ± 1291.8 ng/mL, and the mean
ALT level was 53.3 ± 56.4 mU/mL.
Interestingly, the mean ALT
level was higher and statistically different in TDT patients with
isolated IFG at baseline compared to TDT patients with NGT at baseline
(60 ± 33.5 mU/mL vs. 29.3 ± 13.7 mU/mL, p = 0.011). Still, no
significant difference was found between the SF levels in the two
groups of patients (2288.4 ± 1420.3 ng/mL vs. 1821.1 ± 383.2 ng/mL, p =
0.44).
All patients but one tested after 1990’s for HCV
antibodies were seropositive. HCV‑RNA positivity was present in 10/28
patients (35.7%). Three different HCV genotypes, 1b (61.1%), 2a
(22.2%), and 3a (16.6%) were identified.
At last observation.
a. Clinical characteristics:
The mean age of our study cohort of 28 TDT patients at the last
observation was 29.0 ± 4.7 yrs. There was no significant difference
between patients with NGT and GD regarding age, BMI, family history of
diabetes, and splenectomy. Two patients with IFG at baseline became
overweight and obese, and 4 became underweight (3 in the patients with
NGT at baseline).
b. Glucose dysregulation (GD):
At the last observation, the occurrence of GD in the total group of TDT
patients (29.0 ± 4.7 yrs) was significantly higher compared to
baseline. Seven out of 18 patients (38.8%) with NGT at baseline and
9/10 (90%) with IFG developed deterioration of glucose homeostasis (Figure 1).
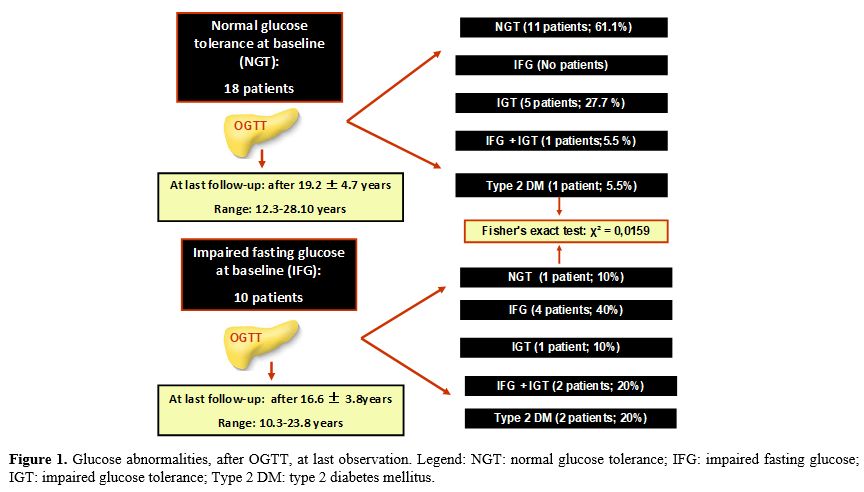 |
Figure
1. Glucose abnormalities, after OGTT, at last observation. Legend: NGT:
normal glucose tolerance; IFG: impaired fasting glucose; IGT: impaired
glucose tolerance; Type 2 DM: type 2 diabetes mellitus.
|
However,
a regression/improvement of GD was observed at the last observation in
two patients (one patient with NGT at baseline who developed IGT during
the follow-up and one patient with IFG at baseline).
The mean
duration between two consecutive OGTTs was 1.16 ± 0.34 yrs in the 12
patients with NGT and 1.14 ± 0.28 yrs in the group of 16 patients who
developed GD (Table 2).
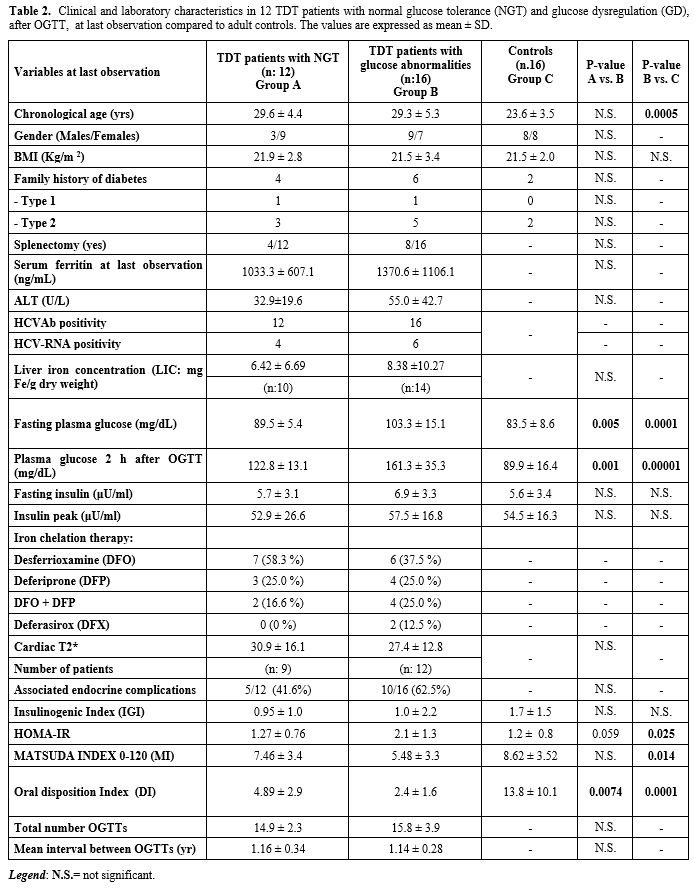 |
Table 2. Clinical and
laboratory characteristics in 12 TDT patients with normal glucose
tolerance (NGT) and glucose dysregulation (GD), after OGTT, at
last observation compared to adult controls. The values are expressed
as mean ± SD.
|
c. Indices of insulin secretion, insulin sensitivity and pancreatic β-cell function:
Compared to adult healthy control subjects, TDT patients with NGT had a
reduced DI (p= 0.006), but no significant difference in HOMA-IR and MI
indices. Conversely, 3 insulin indices (HOMA-IR, MI and DI) differed
significantly between TDT patients with GD and controls. IGI did not
differ between the two groups (Table 2).
In TDT patients, no correlation was detected between MI and DI
and the patient's age, BMI, SF, and ALT. An inverse
correlation was found between HOMA IR and ID (r: -0.542, p = 0.030).
Finally, comparing the 4 insulin indices (IGI, HOMA IR, MI, and DI), a
significant reduction was found at baseline and at the last examination
in the IGI and DI indices (p = 0.005 and 0.004 respectively).
d. Assessment of iron overload and iron chelation therapy:
At last observation, 6/12 patients (50%) with NGT had a SF < 1000
ng/mL (568.5 ± 188.8 ng/mL) and 7/18 patients (38.8%) in those with IFG
(548.2 ± 210.8 ng/mL). Moreover, a global cardiac T2* value from 10 to
14 ms (values < 20 ms indicate cardiac iron overload that is severe
in patients with a level < 10 ms) was observed in 3/10 patients
(30%) with NGT and in 5/12 patients (41.6%) with GD. The quantification
of LIC, assessed by MRI, was reported as moderate (> 7 and < 14
mg Fe/g d.w.) in 1 female patient with GD and severe (> 14 mg Fe/g
d.w.) in 3/8 patients (37.5%) with NGT (2 females) and 3/14 patients
(21.4%) with GD (2 females). Thirteen (46.4%) of the total group of TDT
patients were on treatment with DFO. Most of them (7/12; 58.3 %) were
in the group of patients with NGT.
e. Liver and endocrine associated complications:
Alanine aminotransferase (ALT) values above the normal range (40 U/L)
were present in 4 patients with GD and none with NGT. The prevalence of
HCVAb and HCV- RNA positivity in both groups is reported in Table 2.
The
commonest endocrine complications in the 12 patients with NGT were
primary amenorrhea (in 1 patient, associated with growth hormone
deficiency) and secondary amenorrhea (affecting 4 patients, one of whom
also exhibited severe short stature). In the group of 16 patients with
GD, the commonest endocrine complications were hypogonadotropic
hypogonadism in 8 patients (6 females), of whom one had concomitant
primary hypothyroidism.
Discussion
In
the last few decades, along with the significant increase in life
expectancy of patients with TDT, new complications have emerged. GD is
frequent among TDT patients on conventional treatment with regular
blood transfusions and chelation treatment. Because of the insidious
onset of GD, the current international guidelines recommend annual
screening for GD in all TDT patients from the age of ten years (or
earlier in the presence of iron overload), using the 2-h OGTT.[18]
Hemoglobin A1c (HbA1c) is not routinely used for screening because of its low sensitivity in this population.[19,20]
The
recommended annual screening is based on the evidence that pancreatic
iron loading in TDT patients starts in early childhood[22-23] and that an efficient chelation regimen with DFO alone[24] or in combination with DFP,[23] in the early stages of dysglycemia, can prevent GD.
Prediabetes
is a type of glucose dysregulation representing an intermediate stage
between NGT and DM. According to ADA criteria, it consists of two
subcategories: IFG, defined as an FPG concentration of 100–125 mg/dL,
and IGT, defined as a 2-h PG concentration, after OGTT, of 140–199
mg/dL. The two dysglycemic conditions have different underlying
pathophysiological patterns. Subjects with IFG exhibit a hepatic IR and
impaired early insulin secretion during OGTT and subjects with IGT have
muscle IR and impairment of late-phase insulin secretion.[25-27]
Early
diagnosis of prediabetes is essential for the prompt identification of
high-risk individuals who will benefit from intensive iron chelation
therapy and lifestyle modification. However, it is still unclear
whether the ADA diagnostic criteria[24] or higher thresholds, as suggested by WHO[28]
should be used in TDT patients to define IFG. The WHO defines a subject
with IFG when the FPG corresponds to 110-125 mg/dL (6.1 mmol/L- 6.9
mmol/L) compared to the ADA lower criteria of FPG levels (100 mg/dL-125
mg/dL = 5.6 mmol/L- 6.9 nmol/L). The criteria of WHO and ADA for the
definitions of IGT and DM are the same.
In the present
retrospective study, using the ADA criteria, the prevalence of isolated
IFG was 18.3%, while increasing the threshold value of FPG to 110 mg/dL
(6.1 mmol/L), according to WHO criteria decreased the prevalence to
5.7%. Interestingly, the current study found a progressive
deterioration of glucose tolerance after OGTT, using ADA criteria, in 9
out of 10 prepubertal TDT patients with IFG at baseline.
Focusing
on the progression of GD in TDT patients with NGT at baseline, 5 out 18
patients (27.7%) developed, at last observation, an IGT (27.7%) and 1
patient a DM (5.5%). Moreover, a reduced oral disposition index (DI)
of 2.4 ± 1.6 was observed in TDT patients with GD compared to
control group (13.8 ± 10.1) and to TDT patients with NGT at the last
observation (4.89 ± 2.9) (p: 0.0001 and 0.0074, respectively). These
observations would explain the real role of performing a periodic OGTT
in clinical practice. Although this recommendation especially refers to
patients with iron overload, it is noteworthy that 6 TDT patients (3
males and 3 females, aged 32.8 ± 5.1 years) with NFG and IGT or DM,
after OGTT, had a mean SF level of 1026.8 ± 575.6 ng/mL (range
506 - 2221 ng/mL).
The limitations of this study include: 1) the
relatively small sample size of patients recruited from a single
center; 2) the formulas used in our study because none of the OGTT
indices reveal exactly the same information as those obtained during
hyperinsulinemic-euglycemic clamps and hyperglycemic clamps; 3) all
measures of insulin sensitivity or response do not necessarily follow a
hyperbolic pattern; 4) the insulinogenic index that we used (ΔI
0–30/ΔG0–30) included only two insulin measurements, and finally 5) a
modern evaluation of iron overload in the pancreas by magnetic
resonance imaging was not done. However, we believe that these
limitations were unlikely to have had an important effect on the
validity of the long-term follow-up findings.
Conclusions
Our
study underlines the concept that the spectrum of glucose tolerance in
TDT patients represents a continuum of glucose homeostasis disturbances
and that prepubertal patients with IFG are at higher risk of developing
a further deterioration of glucose metabolism with time. Moreover, it
appears that one-third of adult TDT patients with normal fasting
glucose may develop GD in the second-third decade of life (mean age:
32.8 ± 5.1 years). Thus, early intervention could help to prevent an
expected further decline of glucose tolerance.
References
- De Sanctis V, Elsedfy H, Soliman AT, Elhakim IZ,
Kattamis C, Soliman NA, Elalaily R. Clinical and Biochemical Data of
Adult Thalassemia Major patients (TM) with Multiple Endocrine
Complications (MEC) versus TM Patients with Normal Endocrine Functions:
A long-term Retrospective Study (40 years) in a Tertiary Care Center in
Italy. Mediterr J Hematol Infect Dis. 2016;8:e2016022. https://doi.org/10.4084/mjhid.2016.022
- He
LN, Chen W, Yang Y, Xie YJ, Xiong ZY, Chen DY, Lu D, Liu NQ, Yang YH,
Sun XF. Elevated Prevalence of Abnormal Glucose Metabolism and Other
Endocrine Disorders in Patients with β-Thalassemia Major: A
Meta-Analysis. Biomed Res Int. 2019;2019:6573497. https://doi.org/10.1155/2019/6573497
- Liang
Y, Bajoria R, Jiang Y, Su H, Pan H, Xia N, Chatterjee R, Lai Y.
Prevalence of diabetes mellitus in Chinese children with thalassaemia
major. Trop Med Int Health. 2017;22:716-724. https://doi.org/10.1111/tmi.12876
- Ang
AL, Tzoulis P, Prescott E, Davis BA, Barnard M, Shah FT. History of
myocardial iron loading is a strong risk factor for diabetes mellitus
and hypogonadism in adults with β thalassemia major. Eur J Haematol.
2014;92:229-236. https://doi.org/10.1111/ejh.12224
- Cacciari
E, Milani S, Balsamo A, Spada E, Bona G, Cavallo L, Cerutti F,
Gargantini L, Greggio N, Tonini G, Cicognani A. Italian cross-sectional
growth charts for height, weight and BMI (2 to 20 yr). J Endocrinol
Invest. 2006;29:581-593. https://doi.org/10.1007/BF03344156
- Fulwood
R, Johnson CL, Bryner JD. Hematological and nutritional biochemistry
reference data for persons 6 months-74 years of age: United States,
1976-80. Vital Health Stat. 1982; 11:1-173. PMID: 7170776.
- Cappellini
MD, Cohen A, Eleftheriou A, Piga A, Porter J, Taher A. Guidelines for
the Clinical Management of Thalassaemia [Internet]. 2nd Revised ed.
Nicosia (CY): Thalassaemia International Federation; 2008. PMID:
24308075.
- Positano V, Pepe A, Santarelli
MF, Scattini B, De Marchi D, Ramazzotti A, Forni G, Borgna-Pignatti C,
Lai ME, Midiri M, Maggio A, Lombardi M, Landini L. Standardized T2* map
of normal human heart in vivo to correct T2* segmental artefacts. NMR
Biomed. 2007;20:578-590. https://doi.org/10.1002/nbm.1121
- Maggio
A, Capra M, Pepe A, Mancuso L, Cracolici E, Vitabile S, Rigano P,
Cassarà F, Midiri M. A critical review of non-invasive procedures for
the evaluation of body iron burden in thalassemia major patients. Ped
Endocrinol Rev. 2008;6 (Suppl 1):193-203. PIMD:19337178.
- Casale
M, Meloni A, Filosa A, Cuccia L, Caruso V, Palazzi G, Gamberini MR,
Pitrolo L, Putti MC, D'Ascola DG, Casini T, Quarta A, Maggio A, Neri
MG, Positano V, Salvatori C, Toia P, Valeri G, Midiri M, Pepe A.
Multiparametric Cardiac Magnetic Resonance Survey in Children With
Thalassemia Major: A Multicenter Study. Circ Cardiovasc Imaging.
2015;8(8):e003230. https://doi.org/10.1161/CIRCIMAGING.115.003230
- American
Diabetes Association. Classification and Diagnosis of Diabetes:
Standards of Medical Care in Diabetes - 2020. Diabetes Care. 2020; 43
(Suppl.1): S14-S31. https://doi.org/10.2337/dc20-S002
- Seltzer
HS, Allen EW, Herron AL, Jr., Brennan MT. Insulin secretion in response
to glycemic stimulus: relation of delayed initial release to
carbohydrate intolerance in mild diabetes mellitus. J Clin Invest.1967;
46: 323-335. https://doi.org/10.1172/JCI105534
- Matthews
DR, Hosker JP, Rudenski AS, Naylor BA, Treacher DF, Turner RC.
Homeostasis model assessment: insulin resistance and beta-cell function
from fasting plasma glucose and insulin concentrations in man.
Diabetologia. 1985;28:412-419. https://doi.org/10.1007/BF00280883
- Matsuda
M, DeFronzo RA. Insulin sensitivity indices obtained from oral glucose
tolerance testing: comparison with the euglycemic insulin clamp.
Diabetes Care. 1999;22:1462-1470. https://doi.org/10.2337/diacare.22.9.1462
- Utzschneider
K, Prigeon R, Faulenbach M V, Tong J, Carr DB, Boyko EJ, Leonetti DL,
McNeely MJ, Fujimoto WY, Kahn SE. Oral disposition index predicts the
development of future diabetes above and beyond fasting and 2-h glucose
levels. Diabetes Care. 2009;32:335-341. DOI:10.2337/dc08-1478. Erratum
in: Diabetes Care. 2009;32:1355. PMID: 18957530. https://doi.org/10.2337/dc08-1478
- Retnakaran
R, Shen S, Hanley AJ, Vuksan V, Hamilton JK, Zinman B. Hyperbolic
relationship between insulin secretion and sensitivity on oral glucose
tolerance test. Obesity (Silver Spring). 2008;16:1901-1907.
https://doi.org/10.1038/oby.2008.307
- Alder
R, Roesser EB. Introduction to probability and statistics. WH Freeman
and Company Eds. Sixth Edition. San Francisco (USA), 1975.PMID:1674139.
- De
Sanctis V, Soliman AT, Elsedfy H, Skordis N, Kattamis C, Angastiniotis
M, Karimi M, Yassin MA, El Awwa A, Stoeva I, Raiola G, Galati MC,
Bedair EM, Fiscina B, El Kholy M. Growth and endocrine disorders in
thalassemia: The international network on endocrine complications in
thalassemia (I-CET) position statement and guidelines. Indian J
Endocrinol Metab. 2013;17:8-18. https://doi.org/10.4103/2230-8210.107808
- De
Sanctis V, Soliman AT, Daar S, Di Maio S, Elsedfy H, Kattamis C. For
Debate: Assessment of HbA1c in Transfusion Dependent Thalassemia
Patients. Pediatr Endocrinol Rev. 2020;17:226-234. PMID: 32741153 https://doi.org/10.17458/per.vol17.2020.fd.ssd.HbA1cthalassemia
- Choudhary
A, Giardina P, Antal Z, Vogiatzi M.Unreliable oral glucose tolerance
test and HbA1C in Beta Thalassaemia Major-A case for continuous glucose
monitoring? Br J Haematol. 2013;162: 132-135. https://doi.org/10.1111/bjh.12322
- Berdoukas
V, Nord A, Carson S, Puliyel M, Hofstra T, Wood J, Coates TD. Tissue
iron evaluation in chronically transfused children shows significant
levels of iron loading at a very young age. Am J Hematol.
2013;88:E283-285. https://doi.org/10.1002/ajh.23543
- De
Sanctis V, Roos M, Gasser T, Fortini M, Raiola G, Galati MC; Italian
Working Group on Endocrine Complications in Non-Endocrine Diseases.
Impact of long-term iron chelation therapy on growth and endocrine
functions in thalassaemia. J Pediatr Endocrinol Metab. 2006;19:471-480.
- Au
WY, Li CF, Fang JP, Chen GF, Sun X, Li CG, Zhang XH, Wu XD, Gao HY, Hao
WG, Rasalkar D, Deng M, Mok SP, Tricta F, Chu WC. Assessment of iron
overload in very young children with limited thalassemia care resources
in South China. Hemoglobin. 2014;38:119-126. https://doi.org/10.3109/03630269.2014.880715
- Farmaki
K, Angelopoulos N, Anagnostopoulos G, Gotsis E, Rombopoulos G, Tolis G.
Effect of enhanced iron chelation therapy on glucose metabolism in
patients with beta-thalassaemia major. Br J Haematol. 2006;134:438-444.
https://doi.org/10.1111/j.1365-2141.2006.06203.x
- Nathan
DM, Davidson MB, DeFronzo RA, Heine RJ, Henry RR, Pratley R, Zinman B;
American Diabetes Association. Impaired fasting glucose and impaired
glucose tolerance: implications for care. Diabetes Care.
2007;30:753-759. https://doi.org/10.2337/dc07-9920
- Abdul-Ghani
MA, Tripathy D, DeFronzo RA. Contributions of beta-cell dysfunction and
insulin resistance to the pathogenesis of impaired glucose tolerance
and impaired fasting glucose. Diabetes Care. 2006;29:1130-1139. https://doi.org/10.2337/diacare.2951130
- Laakso
M, Zilinskaite J, Hansen T, Boesgaard TW, Vänttinen M, Stancáková A,
Jansson PA, Pellmé F, Holst JJ, Kuulasmaa T, Hribal ML, Sesti G, Stefan
N, Fritsche A, Häring H, Pedersen O, Smith U; EUGENE2 Consortium.
Insulin sensitivity, insulin release and glucagon-like peptide-1 levels
in persons with impaired fasting glucose and/or impaired glucose
tolerance in the EUGENE2 study. Diabetologia. 2008; 51:502-511. https://doi.org/10.1007/s00125-007-0899-2
- Alberti
KG, Zimmet PZ. Definition, diagnosis and classification of diabetes
mellitus and its complications. Part 1: diagnosis and classification of
diabetes mellitus provisional report of a WHO consultation. Diabet Med.
1998;15:539-553. https://doi.org/10.1002/(SICI)1096-9136(199807)15:7<539::AID-DIA668>3.0.CO;2-S
[TOP]