Leonid Livshits1, Tal Bilu2, Sari Peretz2,3, Anna Bogdanova1,4, Max Gassmann1,4, Harel Eitam3, Ariel Koren2 and Carina Levin2,5.
1 Red
Blood Cell Research Group, Vetsuisse Faculty, Institute of Veterinary
Physiology, University of Zurich, Zürich, Switzerland.
2 Pediatric Hematology Unit, Emek Medical Center, Afula, Israel.
3 Laboratory Division Unit, Emek Medical Center, Afula, Israel.
4 The Zurich Center for Integrative Human Physiology (ZIHP), Zürich, Switzerland.
5 The Bruce and Ruth Rapaport Faculty of Medicine, Technion, Israel Institute of Technology, Haifa, Israel.
Correspondence to:
Leonid Livshits, Red Blood Cell Research Group, Vetsuisse Faculty,
Institute of Veterinary Physiology, University of Zurich, Zürich,
Switzerland, E-mail:
leonidlivshts@gmail.com
Published: July 1, 2022
Received: January 18, 2022
Accepted: June 12, 2022
Mediterr J Hematol Infect Dis 2022, 14(1): e2022049 DOI
10.4084/MJHID.2022.049
This is an Open Access article distributed
under the terms of the Creative Commons Attribution License
(https://creativecommons.org/licenses/by-nc/4.0),
which permits unrestricted use, distribution, and reproduction in any
medium, provided the original work is properly cited.
|
|
Abstract
Introduction:
The commonly used method for hematocrit detection, by visual
examination of microcapillary tube, known as "micro-HCT," is subjective
but remains one of the key sources for fast hematocrit evaluation.
Analytical automation techniques have increased the standardization of
RBC index detection; however, indirect hematocrit measurements by blood
analyzer, the automated HCT, do not correlate well with "micro-HCT"
results in patients with hematological pathologies. We aimed to
overcome those disadvantages in "micro-HCT" analysis using "ImageJ"
processing software.
Methods:
223 blood samples from the "general population" and 19 from sickle cell
disease patients were examined in parallel for hematocrit values using
the automated HCT, standard "micro-HCT," and "ImageJ" micro-HCT
methods.
Results: For
the "general population" samples, the "ImageJ" values were
significantly higher than the corresponding values evaluated by
standard "micro-HCT" and automated HCT, except for the 0 to 2 months
old newborns, in which the automated HCT results were similar to the
"ImageJ" evaluated HCT. Similar to the "general population" cohort, we
found significantly higher values measured by "ImageJ" compared to
either "micro-HCT" or the automated HCT in SCD patients. Correspondent
differences for the MCV and MCHC were also found.
Discussion:
This study introduces the "micro-HCT" assessment technique using the
image-analysis module of "ImageJ" software. This procedure allows
overcoming most of the data errors associated with the standard
"micro-HCT" evaluation and can replace the use of complicated and
expensive automated equipment. The presented results may also be used
to develop new standards for calculating hematocrit and associated
parameters for routine clinical practice.
|
Introduction
The
hematocrit (HCT) value represents the volume fraction of whole blood
occupied by packed red blood cells (RBCs), while the residual fraction
includes the plasma and white blood cells. Changes in HCT reflect acute
or chronic alterations in a patient's physical state. Therefore, when
urgent therapeutic decisions have to be made, a quick HCT result is
critical to establishing prompt and adequate treatment.[1,2]
Due to its advantages over hemoglobin (Hb) analysis, HCT measurement is
widely used in neonatology to decide whether to administer blood
transfusions in cases of anemia or partial exchange transfusions in
cases of polycythemia. The advantages of the HCT measurement are the
small amount of blood required and the rapid results, which are often
obtained at bedside analysis.
Today, two main approaches
for HCT measurement are in clinical use: (i) direct manual HCT
detection by centrifugation of a blood-filled microcapillary tube and
manual examination by eye using a ruler (micro-HCT) and (ii) automated
calculation of HCT performed by modern blood analyzers.[3,4]
The automated method is used worldwide in routine practice, whereas
micro-HCT detection is mostly applied in neonatology wards. The
benefits of using the computerized approach over the traditional
micro-HCT measurement are high throughput and high measurement
standardization. On the other hand, blood analyzers give more precise
results, with less than 1% coefficient of variation for the HCT index.[5]
On
the other hand, automated HCT measurements have several significant
limitations. First, they are indirect, using either a forward
scatter-like approach in flow cytometry (ADVIA blood analyzers,
Siemens) or impedance readouts (Sysmex/Beckman Coulter) for blood cell
count detection. ADVIA blood analyzers calculate HCT values indirectly
by multiplying RBC count by mean RBC corpuscular volume (MCV), which is
also measured indirectly. In ADVIA analyzers, RBCs swell, lose their
native morphology, and are chemically fixed before detection.[6,7]
Therefore, this approach gives false MCV determinations of the HCT
index for red cells with morphological abnormalities, such as sickle
cells that are less spherical; other morphologically abnormal RBCs also
affect HCT measurement.[8] Another possible source of
erroneous, usually lower, HCT evaluations is the presence of RBC
agglutinates, which are not counted as part of the RBC fraction by the
automatic analyzers, mainly due to their strongly defined volumetric
threshold.[8] Moreover, blood electrolyte and protein concentration abnormalities may affect the HCT evaluation.[9]
Overall, the indirect measurement of HCT by blood analyzers may be
poorly correlated with the results of the micro-HCT in patients with
severe and diverse pathologies, including autoimmune hemolytic anemia
such as cold agglutinin disease, sickle cell anemia, hereditary
spherocytosis, and others.[10-12]
In addition, errors in the automated HCT calculation are more common in patients with polycythemia[13] or in cases of abnormal plasma osmotic pressures.[14]
Previous studies in anemic adults and preterm infants found a lower
correlation between circulating RBC volume and HCT than in healthy
individuals, making automated analyzers inaccurate in these cases.
Furthermore, many investigators[15-18] have detected a
poor correlation between circulating RBC mass/volume and automatically
determined HCT or hemoglobin in very low birth weight infants (with
correlation coefficients varying between 0.3 and 0.7), making these
measurements unreliable. For preterm infants, a correlation between RBC
volume and HCT values ranged between 0.87 and 0.96;[19]
therefore, using the automated method for these patients is also less
appropriate. Similar correlation values (0.88–0.92) were reported for
normal and anemic adults by Huber et al.[20] and by Bentley and Lewis.[21]
Moreover,
extremely decreased RBC content, higher reticulocyte count, and
elevations in hypochromic RBC or white blood cell counts may also
result in a false HCT evaluation.[8,22,23]
Thus, despite the common use of automated HCT measurements and their
derived indices, results may be unreliable in numerous pathological
conditions. Finally, the cost of automatic analyzers and consumables is
high, making them less available in healthcare centers with limited
resources or outside hospitals that lack equipped laboratories.
The
manual micro-HCT measurement has been considered a cornerstone of
hematology for many years. Almost all automated hematological analyzers
are calibrated primarily based on these micro measurements. Therefore,
the commonly accepted reference ranges for HCT and other RBC indices
depend on the accuracy of this examination.[22,24]
However, although the manual micro-HCT approach is simple and
inexpensive, it has numerous disadvantages and may be affected by
several variables. This manual procedure is relatively slow and
requires skilled personnel to avoid artifacts when filling the
capillaries and obtaining the HCT readouts.[25] Moreover, the technical aspects, such as duration of centrifugation and differences in angle rotor speed,[26] the plasma trapped between the cells, which can reach up to 4% of the total RBC volume,[27-30] leucocyte and platelet contamination of the RBC layer,[25] RBC dehydration[31] and oxygenation state[32]
may significantly affect the results of the manual micro-HCT technique.
Fortunately, most of these errors tend to counterbalance, so the real
mistake is typically small.[22]
The subjective
nature of the visual interpretation of the sample (due to personal
visual specificities, non-controlled measuring tilt and distance, and
more) remains one of the key sources for false HCT evaluations with the
microcapillary method. We aimed to overcome these complications in HCT
data analysis by using image-processing software to analyze
microcapillary samples more precisely. ImageJ, an open-source software
for imaging analysis provided by the US National Institutes of Health,[33] has been recently used to quantify blood parameters in dried blood spots.[34,35]
In the present study, we suggest using this tool to precisely calculate
HCT and HCT-derived blood parameters obtained from the routine
microcapillary approach.
Several previous reports have discussed
the inaccuracy of the automated measurements of HCT and HCT-derived
parameters for hereditary hemoglobinopathies.[12,36]
Here, we also compared the three approaches (micro-HCT with eye and
image analyses and the automated HCT) for HCT calculation in
blood samples obtained from sickle cell patients.
Methods
Patients and Blood Samples.
In total, 262 samples were included in the study; 243 fresh blood
samples, termed the "general population group", in K3EDTA-supplemented
tubes were evaluated by ADVIA® 2120i Hematology System (Siemens
Healthineers AG). Samples arriving at the Emek Medical Center (EMC)
central laboratory for measurement of complete blood count (CBC) were
chosen randomly during the period 2018–2020. Manual HCT measurement was
performed within 4 h of blood sampling (see Table 1
for the demographic data). Adult subjects were considered anemic when
Hb levels were < 13.5 g/dL for males and < 12 g/dL for females,[37] and polycythemic when HCT > 51% for males and > 48% for females.[38]
The other 19 blood samples were from patients with sickle cell disease
(SCD group), collected in the EMC Pediatric Hematology Unit (Table 2).
The study was performed in accordance with the Declaration of Helsinki
and approved by the EMC ethics committee (EMC-0123-18). In view that
exclusively blood remnants after CBC evaluation at the EMC hematology
laboratory were collected for the study and no specific blood sampling
was performed, no informed consent was required to fill for the study
participants.
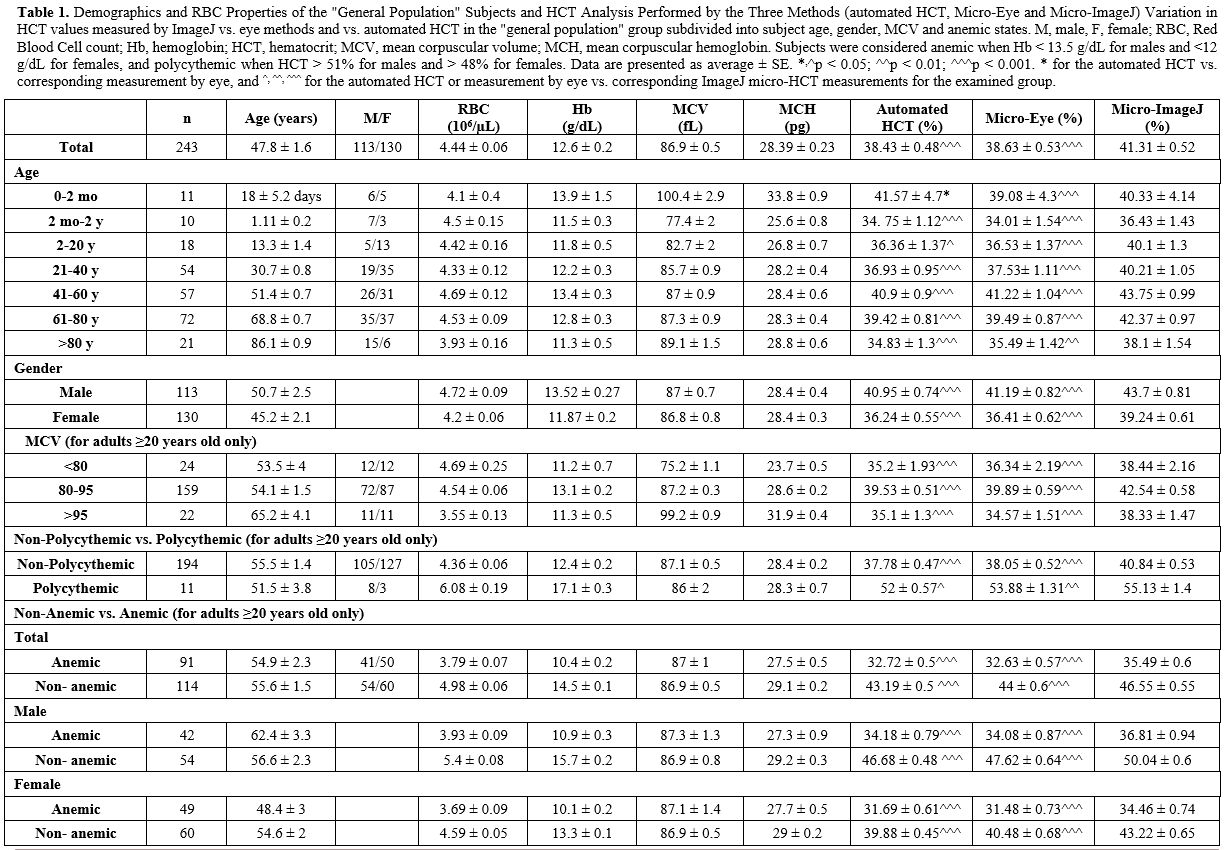 |
Table
1. Demographics and RBC Properties of the "General Population" Subjects
and HCT Analysis Performed by the Three Methods (automated HCT,
Micro-Eye and Micro-ImageJ) Variation in HCT values measured by ImageJ
vs. eye methods and vs. automated HCT in the "general population" group
subdivided into subject age, gender, MCV and anemic states. M, male, F,
female; RBC, Red Blood Cell count; Hb, hemoglobin; HCT, hematocrit;
MCV, mean corpuscular volume; MCH, mean corpuscular hemoglobin.
Subjects were considered anemic when Hb < 13.5 g/dL for males and
<12 g/dL for females, and polycythemic when HCT > 51% for males
and > 48% for females. Data are presented as average ± SE. *,^p <
0.05; ^^p < 0.01; ^^^p < 0.001. * for the automated HCT vs.
corresponding measurement by eye, and ^, ^^, ^^^ for the automated HCT
or measurement by eye vs. corresponding ImageJ micro-HCT measurements
for the examined group. |
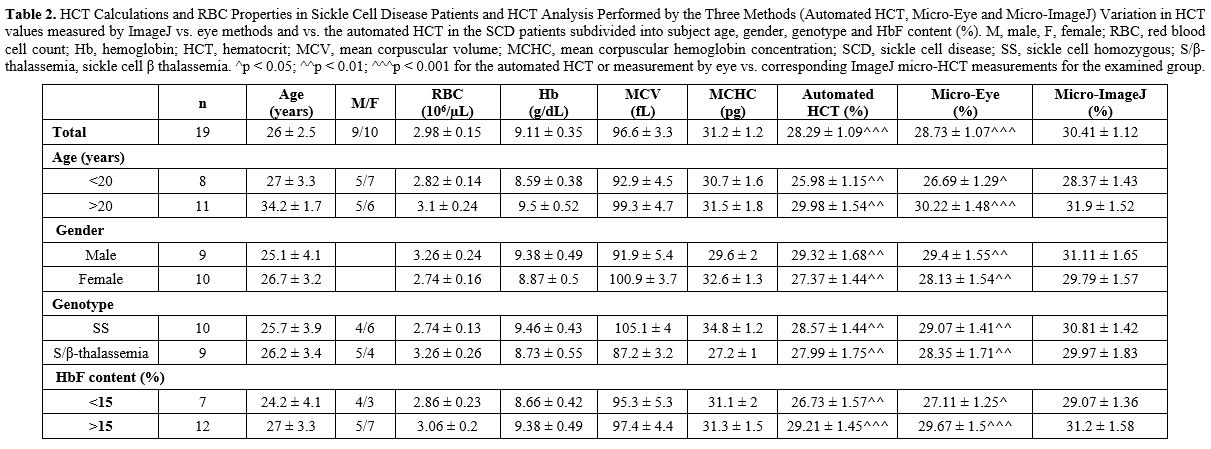 |
Table
2. HCT Calculations and RBC Properties in Sickle Cell Disease Patients
and HCT Analysis Performed by the Three Methods (Automated HCT,
Micro-Eye and Micro-ImageJ) Variation in HCT values measured by ImageJ
vs. eye methods and vs. the automated HCT in the SCD patients
subdivided into subject age, gender, genotype and HbF content (%). M,
male, F, female; RBC, red blood cell count; Hb, hemoglobin; HCT,
hematocrit; MCV, mean corpuscular volume; MCHC, mean corpuscular
hemoglobin concentration; SCD, sickle cell disease; SS, sickle cell
homozygous; S/β-thalassemia, sickle cell β thalassemia. ^p < 0.05;
^^p < 0.01; ^^^p < 0.001 for the automated HCT or measurement by
eye vs. corresponding ImageJ micro-HCT measurements for the examined
group. |
Manual HCT Measurement (Micro-HCT).
Sodium heparin-containing HCT capillaries (Heinz Herenz Medizinalbedarf
GmbH) were filled with the blood samples, sealed, and centrifuged for 5
min at 12,000 rpm using a Sigma 1-14 laboratory centrifuge with
micro-HCT rotor 11026 (Sigma Laborzentrifugen GmbH), following the
commonly used protocol. For examination by eye using a ruler or
microscale (hereafter referred to as examination by eye), the total
height of the sample and the height of the packed RBC layer were
visually examined using a micro-HCT reader or a ruler. The RBC layer
height was divided by the total sample height and expressed in percent
to obtain the HCT value. At the same time, images of these capillaries
were captured by a 16MP camera (installed in a Samsung Galaxy S6 Model
SM-G920F mobile phone). We performed a series of preliminary
experiments to determine whether distance from the capillary and camera
tilt will alter the HCT calculation (Figure 1A).
So, we found that camera tilt (up to 30° incline and 45° decline with
respect to the horizontally positioned capillaries) has no significant
effect on the HCT calculations (Figure 1B).
Distances of less than 10 cm and over 15 cm caused a strong blurring of
the image and interfered with the accuracy of the imaging and
subsequent image analysis (Figure 1C).
Based on these preliminary findings, the camera was set up horizontally
(with 0° tilt relative to the capillaries) at a 10 cm distance from the
capillaries. A non-significant (p > 0.05) effect of image zooming
[1X (100%) to 4X (400%) magnification] on HCT estimation was determined
(Figure 1D); we chose 300%
magnification as optimal in terms of image clarity and blur. We also
found that using different cameras (16MP, 25MP, 13MP cameras) installed
in various mobile phones (Samsung Galaxy S6 Model SM-G920F, Samsung
Galaxy A50 SM-A505F, Huawei P9 lite 2017 mobile phones, respectively)
causes a minimal difference in the HCT calculations (Figure 1E).
The
images of the capillaries were then analyzed by the free-to-the-public
Windows version of ImageJ software (ImageJ 1.52a; Wayne Rasband,
National Institutes of Health, USA; downloaded from https://imagej.nih.gov/ij/download.html). The image analyses were performed as follows (Figure 1F):
o The
height of the RBC fraction was estimated from the RBC-sealant border to
the RBC-leucocyte border as length [in arbitrary units (AU) and keeping
a 90° angle] using the ImageJ analyzing 'straight line' tool. First,
the line is manually drawn after maximal enlargement, and then the line
parameters (i.e., the length) are analyzed using the software. The
examples of the analyzing procedure are shown in Figures 1F and S1A.
o The
height of the total fraction was estimated from the RBC-sealant border
to the plasma-air border as length in AU.
o Each tube's HCT value was calculated as the ratio of the corresponding RBC height to the total height.
o At
least three independent measurements of the total sample height and the
corresponding height of the packed RBC layer were performed for each
capillary. The average value was compared to the measurement done by
eye and to the HCT value from the automated analyzer.
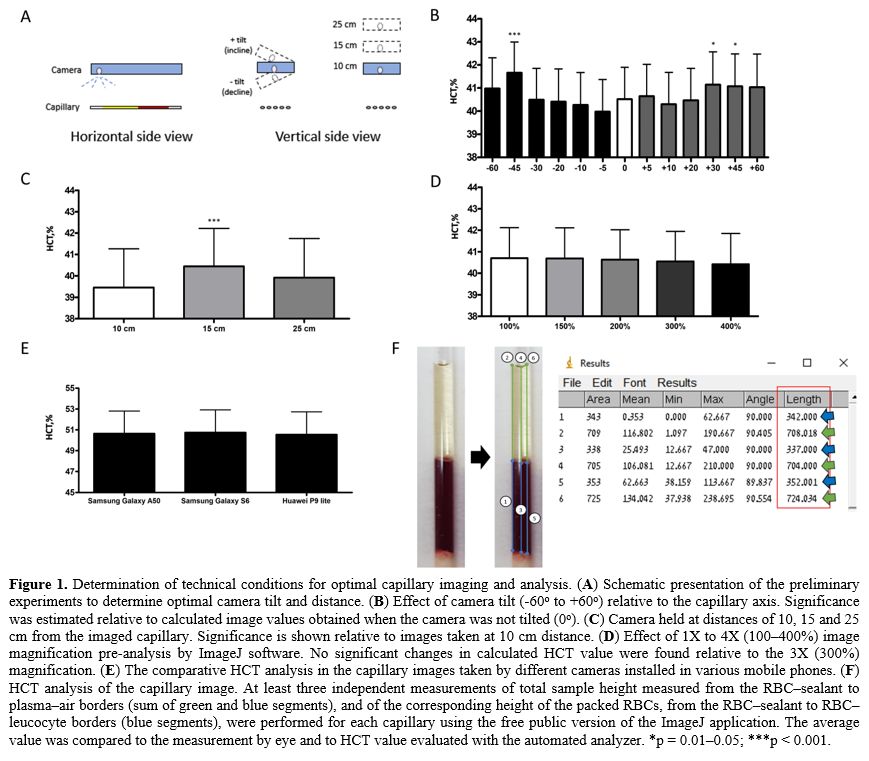 |
Figure
1. Determination of technical conditions for optimal capillary imaging and analysis. (A) Schematic presentation of the preliminary experiments to determine optimal camera tilt and distance. (B)
Effect of camera tilt (-60o to +60o) relative to the capillary axis.
Significance was estimated relative to calculated image values obtained
when the camera was not tilted (0o). (C)
Camera held at distances of 10, 15 and 25 cm from the imaged capillary.
Significance is shown relative to images taken at 10 cm distance. (D)
Effect of 1X to 4X (100–400%) image magnification pre-analysis by
ImageJ software. No significant changes in calculated HCT value were
found relative to the 3X (300%) magnification. (E) The comparative HCT analysis in the capillary images taken by different cameras installed in various mobile phones. (F)
HCT analysis of the capillary image. At least three independent
measurements of total sample height measured from the RBC–sealant to
plasma–air borders (sum of green and blue segments), and of the
corresponding height of the packed RBCs, from the RBC–sealant to
RBC–leucocyte borders (blue segments), were performed for each
capillary using the free public version of the ImageJ application. The
average value was compared to the measurement by eye and to HCT value
evaluated with the automated analyzer. *p = 0.01–0.05; ***p < 0.001.
|
Although
the used Windows version of ImageJ software has a tool option to
calculate the length measurement in cm unit, we performed our
preliminary experiment to test the correlation between the length
scales measured by the ruler and ImageJ software. First, the
water-filled capillary was placed near a 5 cm ruler with marked 0.5 cm
steps and then captured as described above. Next, the known lengths
(with an increasing 0.5 cm step) were analyzed by ImageJ software
(Supplementary Figure 1A).
As a result, we found complete correlations (R=1) between the ImageJ
length scale (in pixels) and the ruler's cm length as well as between
the ImageJ length scales calculated in pixels and cm (Supplementary Figure 1B), thus confirming a complete numerical comparison between HCT estimated by ruler and ImageJ approach.
The
indices derived from the HCT were calculated using the formulas: mean
corpuscular volume (MCV) = HCT x 100/RBC number; and mean corpuscular
Hb concentration (MCHC) = Hb x 100/hematocrit, where RBC number and Hb
values were from the CBCs.
Statistics.
All data are presented as mean values ± SEM. One-way ANOVA followed by
Friedman post-test (GraphPad Prism 4) was performed to compare the same
indices measured by different approaches. The level of statistical
significance was indicated as p < 0.05 (* or ^), p < 0.01 (** or
^^) or p < 0.001 (*** or ^^^), and p > 0.05 as nonsignificant
(NS).
Results
We
first examined what was the contribution of the subjectivity (i.e., the
precision by the test with the ruler/eye) on the HCT measurement by the
routine-micro-HCT method and, if this is found to be significant,
minimize the differences by enlarging the picture and analysis using
the routinely used ImageJ software. For that, the HCT results of 12
randomly received blood samples were compared by three independent
examiners. The three examiners were experts in the field of hematology
laboratory methods and research and performed two micro-HCT analyses:
by eye and using the ImageJ approach (Figure 2).
All three examiners performed the eye evaluation without being aware of
the results of the other two examiners. Their evaluation by ImageJ
software was performed independently, including using their computers.
For the measurement by eye, each examiner gave slightly but
significantly different values [Examiner 1, 37.38 ± 0.66; Examiner 2,
37.67 ± 0.64 (NS vs. Ex#1); Examiner 3, 37.88 ± 0.65 (p = 0.017 vs.
Ex#1 and NS vs. Ex#2). All data are the mean values ± SE]. When the
same examiners assessed the HCT by ImageJ, the variations were
minimized: 38.31 ± 0.64, 38.38 ± 0.65, and 38.38 ± 0.65 for Examiners
1, 2 and 3, respectively; NS for all comparisons between examiners.
However, the examination of HCT by ImageJ vs. the by-eye approach for
the two first examiners revealed big and significant differences (all p
< 0.001). In contrast, for Examiner 3, no significant differences
were observed.
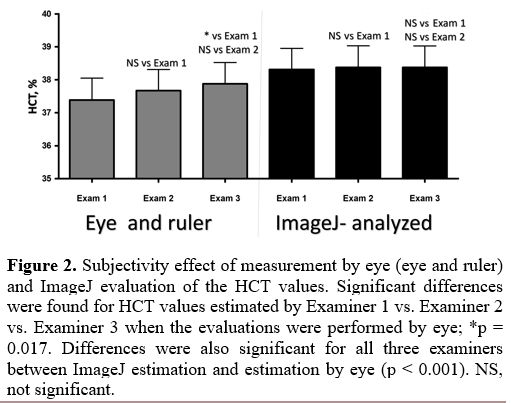 |
Figure 2. Subjectivity
effect of measurement by eye (eye and ruler) and ImageJ evaluation of
the HCT values. Significant differences were found for HCT values
estimated by Examiner 1 vs. Examiner 2 vs. Examiner 3 when the
evaluations were performed by eye; *p = 0.017. Differences were also
significant for all three examiners between ImageJ estimation and
estimation by eye (p < 0.001). NS, not significant.
|
We
then compared the HCT values measured by the three methods: (i) the
automated HCT, (ii) examination by eye, and (iii) examination by ImageJ
in a large and heterogeneous cohort. In total, 242 blood samples were
tested-223 randomly collected "general population" samples from the
hematology laboratory (Figure 3 and Table 1) and 19 samples from SCD patients (Table 2).
For the "general population" samples, we did not find any differences
between the automated HCT and measurements by eye. However, the
ImageJ-measured HCT values were significantly higher than the
corresponding values evaluated by eye (p < 0.001) and the automated
HCT (p < 0.001) (Figure 3A and Table 1).
In addition, the absolute (in percent) variance analysis revealed
important differences between the corresponding values measured by
these three approaches, 5.7 to 8.8% (Figure 3B).
Despite these variations, the obtained automated HCT and eye-HCT values
were strongly correlated (R = 0.918 - not shown), and each was strongly
correlated to the ImageJ-evaluated index (R = 0.92, Figure 3C and R = 0.965, Figure 3D, for the automated HCT and by eye-HCT, respectively).
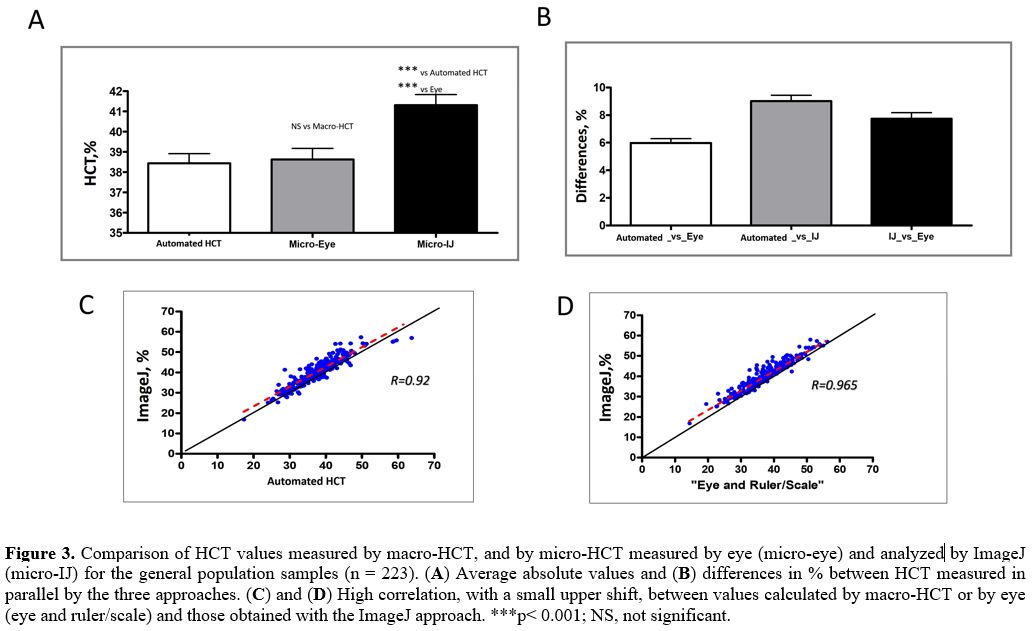 |
Figure 3. Comparison of
HCT values measured by macro-HCT, and by micro-HCT measured by eye
(micro-eye) and analyzed by ImageJ (micro-IJ) for the general
population samples (n = 223). (A) Average absolute values and (B) differences in % between HCT measured in parallel by the three approaches. (C) and (D)
High correlation, with a small upper shift, between values calculated
by macro-HCT or by eye (eye and ruler/scale) and those obtained with
the ImageJ approach. ***p< 0.001; NS, not significant.
|
We
compared the HCT values calculated by these three approaches for the
examined cohort, subdivided into individual groups according to age,
gender, MCV, and anemic conditions in general and divided by gender. We
found significantly higher values of ImageJ- vs. either by eye- or the
automated HCT-measured values in all examined subgroups, except for the
0- to 2-month-old newborns (Table 1).
The latter was the only subgroup in which the automated HCT index was
similar to the ImageJ-evaluated HCT (average difference 6.4 ± 1%, p =
0.26), and the results were higher when compared to the values measured
by eye.
Since several blood indices are mathematically
associated with or extrapolated from HCT values, as described in the
Methods section, our next goal was to examine the ImageJ-evaluation
effect on the values of MCV and MCHC compared to the other two methods (Supplementary Figure 2A and C, respectively). We found differences in the by-eye vs. ImageJ estimations for both indices (Supplementary Figure 2B and D).
When
we compared the three methods for HCT calculation in blood samples
obtained from SCD patients, we observed important differences in the
absolute variance between the corresponding values measured by these
three approaches: for the automated HCT vs. by eye measurements, 4.6 ±
0.8%; for by eye vs. ImageJ measurements, 5.9 ± 0.5%; and for the
automated HCT vs. ImageJ measurements: 7.8 ± 1.3%. In addition, similar
to the non-SCD cohort, we found significantly higher levels for values
measured by ImageJ compared to either eye-HCT or the automated HCT
values (p < 0.001) in SCD patients (Table 2 and Figure 4).
Moreover, we found significant differences when we analyzed the data in
SCD patients in subgroups according to age, gender, genotype, and fetal
Hb (HbF) content (Table 2).
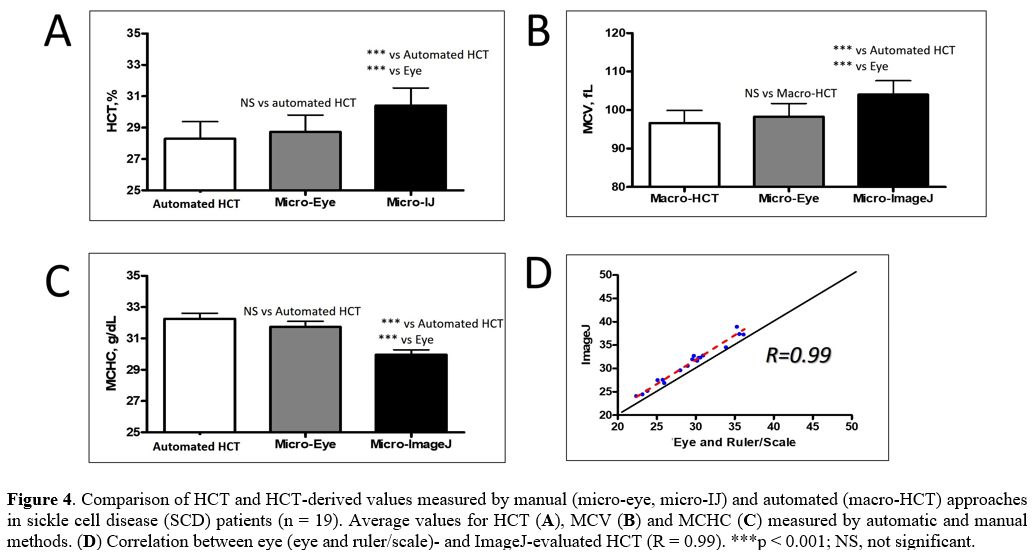 |
Figure 4. Comparison of
HCT and HCT-derived values measured by manual (micro-eye, micro-IJ) and
automated (macro-HCT) approaches in sickle cell disease (SCD) patients
(n = 19). Average values for HCT (A), MCV (B) and MCHC (C) measured by automatic and manual methods. (D) Correlation between eye (eye and ruler/scale)- and ImageJ-evaluated HCT (R = 0.99). ***p < 0.001; NS, not significant.
|
Discussion
The
HCT measurement, regardless of the method, is crucial for the medical
management of patients with anemia or polycythemia. However, despite
its high throughput and complete blood count test, the indirect
measurement (the automated HCT) has numerous limitations, such as a
required volume of the tested sample and examination of blood cells
with abnormal morphologies. In addition, automated measurement has the
added limitation of being calculated and not directly measured and
requiring expensive equipment and skilled laboratory personnel; the
automatic equipment may not be suitable for use in rural areas or in
situations where the medical staff moves from one site to another, for
example, in the battlefield or disaster areas. This is why direct
measurement (micro-HCT) is still commonly used.
In this study, we
show that a simple technology allows overcoming most of the errors and
variations in the data associated with the subjective (by eye with a
microscale or ruler) micro-HCT evaluation and can replace the use of
complicated and expensive automated equipment where it is unavailable.
Furthermore, the ability to analyze any capillary at large
magnification with an almost unlimited number of corresponding RBC vs.
total blood heights allows taking into consideration capillary defects,
centrifugation-affected blood distribution, and the roughness of the
seal material in the capillary. Thus, these disadvantages of the
microcapillary method for HCT estimation are resolved. Moreover, the
invariably higher values of ImageJ-measured capillary HCT vs. the
corresponding values obtained by eye (p < 0.0001) can also be
explained. On the other hand, the lack of magnification with inspection
by the eye does not allow examining capillary defects or the roughness
of the seal material in the capillary. Figure 5 schematizes some of the areas of just non-estimated RBCs and overestimated
plasma fractions in measurements by eye and their precise detection by
ImageJ analysis (arrows in Figure 5). The false approximation of the fractions by eye results in an incorrect and underestimated evaluation of the HCT parameter.
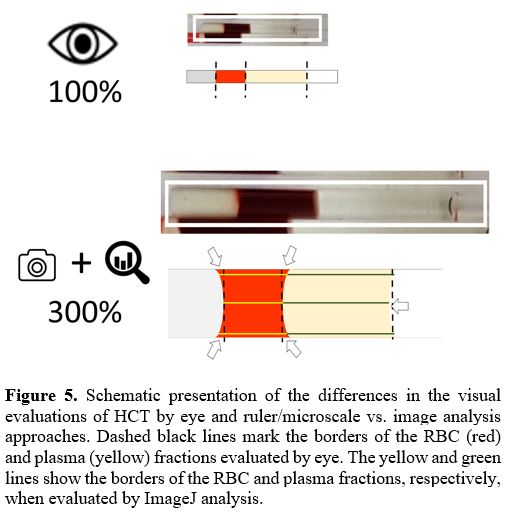 |
Figure 5. Schematic
presentation of the differences in the visual evaluations of HCT by eye
and ruler/microscale vs. image analysis approaches. Dashed black lines
mark the borders of the RBC (red) and plasma (yellow) fractions
evaluated by eye. The yellow and green lines show the borders of the
RBC and plasma fractions, respectively, when evaluated by ImageJ
analysis.
|
The
only exception to the higher ImageJ vs. by eye and automated HCT values
was observed in newborns. The newborns were the only subgroup for which
the automated HCT index was similar to the ImageJ-evaluated manual HCT
and significantly higher than the value measured by eye. Since, in
current clinical practice, HCT in these patients is almost exclusively
evaluated by the microcapillary method, mainly due to very limited
amounts of blood for the sample, this finding is highly important.
Compared to the significantly lower values observed by eye, the lack of
variation in the automated HCT vs. ImageJ results may be explained by
the unique characteristics of neonatal RBCs. In healthy infants, mild
anisocytosis and poikilocytosis are frequently observed; the neonatal
RBCs differ from adult RBCs in their deformability and fragility.[39,40]
In addition, high numbers of pitted cells, echinocytes, spherocytes, and
other abnormally shaped erythrocytes are seen in neonates, especially
in premature infants.[41,42] Specifically, the
fraction of stomatocytes is more than twice as high in neonates
compared to adult blood, 40% vs. 18%, respectively.[43,44]
Thus, such native "swelling" may result in a considerable decrease in
the difference between the morphological properties of RBCs that are
de-facto examined by the automatic and manual approaches, and,
correspondently, similar HCT values will be obtained. Because neonatal
blood is less available for automated examination, the only possibility
to test HCT in these patients is the micro-HCT; the ImageJ analysis can
provide the necessary accuracy for HCT evaluation in neonates. Since
the results of the ImageJ approach are slightly higher than those
obtained by eye, this approach may require some adjustment in policy by
the neonatologists regarding the threshold for giving blood
transfusions in neonates.
The
presented method has several limitations, which should be solved by the
future users. One is related to the technical settings of the set-up
and measuring conditions. We indicated that the camera's tilt, the
distance between the camera and the capillary, and zooming would impact
the image. Clearly, improper positing of the camera may introduce
another source of variability, and more significant validation and
fixing of the optimal measuring conditions are necessary prior to its
certification as a standard application. The same is related to
possible variations in the software versions. In addition, we compare
the ImageJ-measured capillary HCT and the automated HCT results
evaluated by only ADVIA® 2120i Hematology System. Although our
preliminary experiment did not reveal any difference between HCT
measurements performed using different cameras, it is obligatory in the
future to compare the ImageJ-measured HCT with the automated HCT
measured by other devices and approaches.
As a general comment and as a
possible target for further studies, we note that the accuracy of the
HCT determination by any (macro or micro) approach is still under
debate. Thus, despite the objective benefits of the presented
technology, we need to confirm that the key source of the micro-HCT
error, i.e., the evaluation of the trapped plasma, cannot be corrected
by the presented approach. To the best of our knowledge, no current
routinely used camera may provide a necessary zoom to detect the
separate RBC and the plasma surrounding them. Of course, it may be
possible to obtain precise HCT values by more advanced methods, such as
biotin- and radioactive-labeling, or optical, impedance, or ultrasonic
approaches;[45-50] but to apply any of these methods
as a routine procedure in clinical practice is unrealistic, mainly due
to technical and economic considerations. However, in contrast to the
presented here approach, the routinely used eye/ruler method falsely
considered, on the one hand, the trapped plasma (that lead to falsely
elevated HCT evaluation), and, on the other hand, capillary defects,
the roughness of the seal material in the capillary and indistinct
margin between red and white cell layers, all mainly result in falsely
lower HCT values. Although it is impossible to overlap the trapped
plasma's challenge, we strongly suggest the method to minimize other
sources of error.
Therefore, the manual micro-HCT approach with
the improved measuring protocol can be a more reliable and inexpensive
solution for the routine clinical practice of HCT measurements.
Furthermore, because the parameter is clinically important and used as
a prognostic factor,[23,36,51]
its accurate evaluation is highly important. Moreover, the suggested
approach will be beneficial for determining novel clinical standards
for HCT and its associated parameters.
Acknowledgements
This
project was partially funded by the Fondation Botnar as well as by the
Baugarten Stiftung, Susanne & René Braginsky Stiftung and Ernst
Göhner Stiftung. The authors thank the staff of Emek Medical Center's
Hematology Laboratory Division for their enormous technical help, and
especially Hiba Zoabi, Feras Afife, and Hoda Aiada, who performed the
routine blood tests.
References
- Billett H. Hemoglobin and Hematocrit. In: Walker
HK, ed. Clinical Methods: The History, Physical, and Laboratory
Examinations (1990).
- Quinn JG, Tansey EA,
Johnson CD, Roe SM, Montgomery LEA. Blood: tests used to assess the
physiological and immunological properties of blood. Advances in
Physiology Education. 2016;40(2):165-175. doi:10.1152/advan.00079.2015 https://doi.org/10.1152/advan.00079.2015 PMid:27068991
- Green
R, Wachsmann-Hogiu S. Development, History, and Future of Automated
Cell Counters. Clinics in Laboratory Medicine. 2015;35(1):1-10.
doi:10.1016/j.cll.2014.11.003 https://doi.org/10.1016/j.cll.2014.11.003 PMid:25676368
- Vis
JY, Huisman A. Verification and quality control of routine hematology
analyzers. International Journal of Laboratory Hematology.
2016;38(Suppl 1):100-109. doi:10.1111/ijlh.12503 https://doi.org/10.1111/ijlh.12503 PMid:27161194
- BOURNER
G, DHALIWAL J, SUMNER J. Performance Evaluation of the Latest Fully
Automated Hematology Analyzers in a Large, Commercial Laboratory
Setting:A 4-Way, Side-by-Side Study. Laboratory Hematology.
2005;11(4):285-297. doi:10.1532/LH96.05036 https://doi.org/10.1532/LH96.05036 PMid:16475476
- ADVIA. 2120/2120i Hematology systems operator's guide. Published online 2010.
- Lehner J, Greve B, Cassens U. Automation in Hematology. Transfusion Medicine and Hemotherapy. 2007;34:328-339. https://doi.org/10.1159/000107368
- Buttarello
M. Laboratory diagnosis of anemia: are the old and new red cell
parameters useful in classification and treatment, how? International
Journal of Laboratory Hematology. 2016;38:123-132.
doi:10.1111/ijlh.12500 https://doi.org/10.1111/ijlh.12500 PMid:27195903
- McMahon
DJ, Carpenter RL. A Comparison of Conductivity-Based Hematocrit
Determinations With Conventional Laboratory Methods in Autologous Blood
Transfusions. Anesthesia & Analgesia. 1990;71(5):541-544.
doi:10.1213/00000539-199011000-00015 https://doi.org/10.1213/00000539-199011000-00015 PMid:2221416
- Novis
DA, Walsh M, Wilkinson D, St Louis M, Ben-Ezra J. Laboratory
productivity and the rate of manual peripheral blood smear review: a
College of American Pathologists Q-Probes study of 95,141 complete
blood count determinations performed in 263 institutions. Archives of
Pathology & Laboratory Medicine. 2006;130(5):596-601. https://doi.org/10.5858/2006-130-596-LPATRO PMid:16683868
- Kakkar
N, Makkar M. Red Cell Cytograms Generated by an ADVIA 120 Automated
Hematology Analyzer: Characteristic Patterns in Common Hematological
Conditions. Laboratory Medicine. 2009;40(9):549-555. https://doi.org/10.1309/LM23R7FULSTUJSJD
- Huisjes
R, Makhro A, Llaudet-Planas E, et al. Density, heterogeneity and
deformability of red cells as markers of clinical severity in
hereditary spherocytosis. Haematologica. 2020;105(2):338-347.
doi:10.3324/haematol.2018.188151 https://doi.org/10.3324/haematol.2018.188151 PMid:31147440 PMCid:PMC7012482
- Guthrie
DL, Pearson TC. PCV measurement in the management of polycythaemic
patients. Clinical & Laboratory Haematology. 1982;4(3):257-265.
doi:10.1111/j.1365-2257.1982.tb00075.x https://doi.org/10.1111/j.1365-2257.1982.tb00075.x PMid:6756765
- Beautyman
W, Bills T. Osmotic error in measurements of Red-Cell volume. The
Lancet. 1974;304(7885):905-906. doi:10.1016/S0140-6736(74)91246-X https://doi.org/10.1016/S0140-6736(74)91246-X
- Hudson
I, Cooke A, Holland B, et al. Red cell volume and cardiac output in
anaemic preterm infants. Archives of Disease in Childhood. 1990;65(7
Spec No):672-675. doi:10.1136/adc.65.7_Spec_No.672 https://doi.org/10.1136/adc.65.7_Spec_No.672 PMid:2386399 PMCid:PMC1590183
- Jones
JG, Holland BM, Hudson IRB, Wardrop CAJ. Total circulating red cells
versus haematocrit as the primary descriptor of oxygen transport by the
blood. British Journal of Haematology. 1990;76(2):288-294.
doi:10.1111/j.1365-2141.1990.tb07886.x https://doi.org/10.1111/j.1365-2141.1990.tb07886.x PMid:2094332
- Blanchette
VS, Zipursky A. Assessment of anemia in newborn infants. Clinical
Perinatology. 1984;11(2):489-510.
https://doi.org/10.1016/S0095-5108(18)30930-8
- Phillips
HeatherM, Abdel-Moiz A, Gareth Jones J, et al. Determination of
red-cell mass in assessment and management of anaemia in babies needing
blood transfusion. The Lancet. 1986;327(8486):882-884.
doi:10.1016/S0140-6736(86)90988-8 https://doi.org/10.1016/S0140-6736(86)90988-8
- Mock
DM, Bell EF, Lankford GL, Widness JA. Hematocrit Correlates Well with
Circulating Red Blood Cell Volume in Very Low Birth Weight Infants.
Pediatric Research. 2001;50(4):525-531.
doi:10.1203/00006450-200110000-00017 https://doi.org/10.1203/00006450-200110000-00017 PMid:11568298
- Huber
H, Lewis SM, Szur L. The Influence of Anaemia, Polycythaemia and
Splenomegaly on the Relationship between Venous Haematocrit and
Red-Cell Volume. British Journal of Haematology. 1964;10(4):567-575.
doi:10.1111/j.1365-2141.1964.tb00733.x https://doi.org/10.1111/j.1365-2141.1964.tb00733.x PMid:14218458
- Bentley
SA, Lewis SM. The Relationship between Total Red Cell Volume, Plasma
Volume and Venous Haematocrit. British Journal of Haematology.
1976;33(2):301-307. doi:10.1111/j.1365-2141.1976.tb03542.x https://doi.org/10.1111/j.1365-2141.1976.tb03542.x PMid:1268099
- Bull
BS, Fujimoto K, Houwen B, et al. International Council for
Standardization in Haematology (ICSH) recommendations for "surrogate
reference" method for the packed cell volume. Laboratory Haematology.
2003;9(1):1-9.
- Mohandas N, Clark MR,
Kissinger S, Bayer C, Shohet SB. Inaccuracies associated with the
automated measurement of mean cell hemoglobin concentration in
dehydrated cells. Blood. 1980;56(1):125-128. https://doi.org/10.1182/blood.V56.1.125.125 PMid:7388177
- Bull
BS, Hay KL. Are red blood cell indexes international? Archives of
Pathology & Laboratory Medicine. 1985;109(7):604-606.
- Bull
BS, Rittenbach JD. A proposed reference haematocrit derived from
multiple MCHC determinations via haemoglobin measurements. Clinical
& Laboratory Haematology. 1990;12(Supplement 1):43-53.
- Furth
FW. Effect of spherocytosis on volume of trapped plasma in red cell
column of capillary and Wintrobe hematocrits. Journal of Laboratory and
Clinical Medicine. 1956;48(3):421-430.
- Rustad
H. Correction for Trapped Plasma in Micro-Hematocrit Determinations.
Scandinavian Journal of Clinical and Laboratory Investigation.
1964;16(6):677-679. doi:10.3109/00365516409055233 https://doi.org/10.3109/00365516409055233 PMid:14224492
- Savitz
D, Sidel VW, Solomon AK. Osmotic Properties of Human Red Cells. Journal
of General Physiology. 1964;48(1):79-94. doi:10.1085/jgp.48.1.79 https://doi.org/10.1085/jgp.48.1.79 PMid:14212152 PMCid:PMC2195405
- Stäubli
M, Roessler B, Straub PW. Fluid trapping of erythrocytes under
hypoosmolar conditions. Blut. 1987;54(4):239-245.
doi:10.1007/BF00594200 https://doi.org/10.1007/BF00594200 PMid:3828540
- Pearson
TC, Guthrie DL. Trapped Plasma in the Microhematocrit. American Journal
of Clinical Pathology. 1982;78(5):770-772. doi:10.1093/ajcp/78.5.770 https://doi.org/10.1093/ajcp/78.5.770 PMid:7137120
- Karlow
MA, Westengard JC, Bull BS. Does tube diameter influence the packed
cell volume? Clinical & Laboratory Haematology. 1989;11(4):375-383.
doi:10.1111/j.1365-2257.1989.tb00236.x https://doi.org/10.1111/j.1365-2257.1989.tb00236.x PMid:2605878
- BRYNER
MA, HOUWEN B, WESTENGARD J, KLEIN O. The spun micro-haematocrit and
mean red cell volume are affected by changes in the oxygenation state
of red blood cells. Clinical & Laboratory Haematology.
1997;19(2):99-103. doi:10.1046/j.1365-2257.1997.00223.x https://doi.org/10.1046/j.1365-2257.1997.00223.x PMid:9218148
- Schneider
CA, Rasband WS, Eliceiri KW. NIH Image to ImageJ: 25 years of image
analysis. Nature Methods. 2012;9(7):671-675. doi:10.1038/nmeth.2089 https://doi.org/10.1038/nmeth.2089 PMid:22930834 PMCid:PMC5554542
- Alsous
MM, Hawwa AF, McElnay JC. Hematocrit, blood volume, and surface area of
dried blood spots - a quantitative model. Drug Testing and Analysis.
2020;12(4):555-560. doi:10.1002/dta.2776 https://doi.org/10.1002/dta.2776 PMid:32061031
- del
Ben F, Biasizzo J, Curcio F. A fast, nondestructive, low-cost method
for the determination of hematocrit of dried blood spots using image
analysis. Clinical Chemistry and Laboratory Medicine (CCLM).
2019;57(5):e81-e82. doi:10.1515/cclm-2018-0755 https://doi.org/10.1515/cclm-2018-0755 PMid:30179847
- Brugnara
C, Mohandas N. Red cell indices in classification and treatment of
anemias. Current Opinion in Hematology. 2013;20(3):222-230.
doi:10.1097/MOH.0b013e32835f5933
https://doi.org/10.1097/MOH.0b013e32835f5933 PMid:23449069
- Hoffman R, Benz EJr, Shattil SJ, Furie B. Hematology: Basic Principles and Practice. 4th ed. Churchill-Livingstone; 2004.
- Pearson TC. Apparent polycythaemia. Blood Reviews. 1991;5(4):205-213. doi:10.1016/0268-960X(91)90010-A https://doi.org/10.1016/0268-960X(91)90010-A
- Linderkamp
O, Wu PYK, Meiselman HJ. Geometry of Neonatal and Adult Red Blood
Cells. Pediatric Research. 1983;17(4):250-253.
doi:10.1203/00006450-198304000-00003 https://doi.org/10.1203/00006450-198304000-00003 PMid:6856385
- Linderkamp
O, Friederichs E, Meiselman HJ. Mechanical and Geometrical Properties
of Density-Separated Neonatal and Adult Erythrocytes. Pediatric
Research. 1993;34(5):688-693. doi:10.1203/00006450-199311000-00024 https://doi.org/10.1203/00006450-199311000-00024 PMid:8284111
- Segal GB, Palis J. Hematology of the newborn. In: Lichtman M, ed. Williams Hematology. 7th ed. Mcgraw Hill; 2006.
- Ceriotti F. Pediatric References Intervals. In: Soldin SJ, ed. Clinical Chemistry. AACC Press; 2005.
- Goossen
LH. Pediatric and geriatric hematology and hemostasis. In: Keohane E,
ed. Rodak's Hematology Clinical Principles and Applications. 5th ed. Elsever; 2015.
- Esan
AJ. Hematological differences in newborn and aging: a review study.
Hematology & Transfusion International Journal. 2016;3(3):178-190. https://doi.org/10.15406/htij.2016.03.00067
- Meyer
LM. Blood volume determinations with radioactive chromium (Cr 51)
labeled erythrocytes. Journal of the American Medical Association.
1956;160(15):1312-1315. doi:10.1001/jama.1956.02960500042011b https://doi.org/10.1001/jama.1956.02960500042011b PMid:13306548
- Dirksen
JW, Quaife MA, Paxson CL, Barton TP. Evaluation and Testing of In Vitro
Labeled Technetium Tc-99m Red Blood Cells in Two Animal Models for
Neonatal RBC Volume Determinations. Pediatric Research.
1981;15(6):905-907. doi:10.1203/00006450-198106000-00004 https://doi.org/10.1203/00006450-198106000-00004 PMid:7243392
- Mock
D, Lankford GL, Widness JA, Burmeister LF, Kahn D, Strauss RG.
Measurement of circulating red cell volume using biotin-labeled red
cells: validation against 51Cr-labeled red cells. Transfusion.
1999;39(2):149-155. doi:10.1046/j.1537-2995.1999.39299154728.x https://doi.org/10.1046/j.1537-2995.1999.39299154728.x PMid:10037124
- Mock
DM, Mock NI, Lankford GL, Burmeister LF, Strauss RG, Widness JA. Red
Cell Volume Can Be Accurately Determined in Sheep Using a
Nonradioactive Biotin Label. Pediatric Research. 2008;64(5):528-532.
doi:10.1203/PDR.0b013e318183f119 https://doi.org/10.1203/PDR.0b013e318183f119 PMid:18596580 PMCid:PMC2677971
- Zeidan
A, Golan L, Yelin D. In vitro hematocrit measurement using spectrally
encoded flow cytometry. Biomedical Optics Express.
2016;7(10):4327-4334. doi:10.1364/BOE.7.004327 https://doi.org/10.1364/BOE.7.004327 PMid:27867734 PMCid:PMC5102548
- Jalal
UM, Kim SC, Shim JS. Histogram analysis for smartphone-based rapid
hematocrit determination. Biomedical Optics Express.
2017;8(7):3317-3328. doi:10.1364/BOE.8.003317 https://doi.org/10.1364/BOE.8.003317 PMid:28717569 PMCid:PMC5508830
- Rocha
S, Costa E, Rocha-Pereira P, et al. Complementary markers for the
clinical severity classification of hereditary spherocytosis in
unsplenectomized patients. Blood Cells, Molecules, and Diseases.
2011;46(2):166-170. doi:10.1016/j.bcmd.2010.11.001 https://doi.org/10.1016/j.bcmd.2010.11.001 PMid:21138793
Supplementary Files
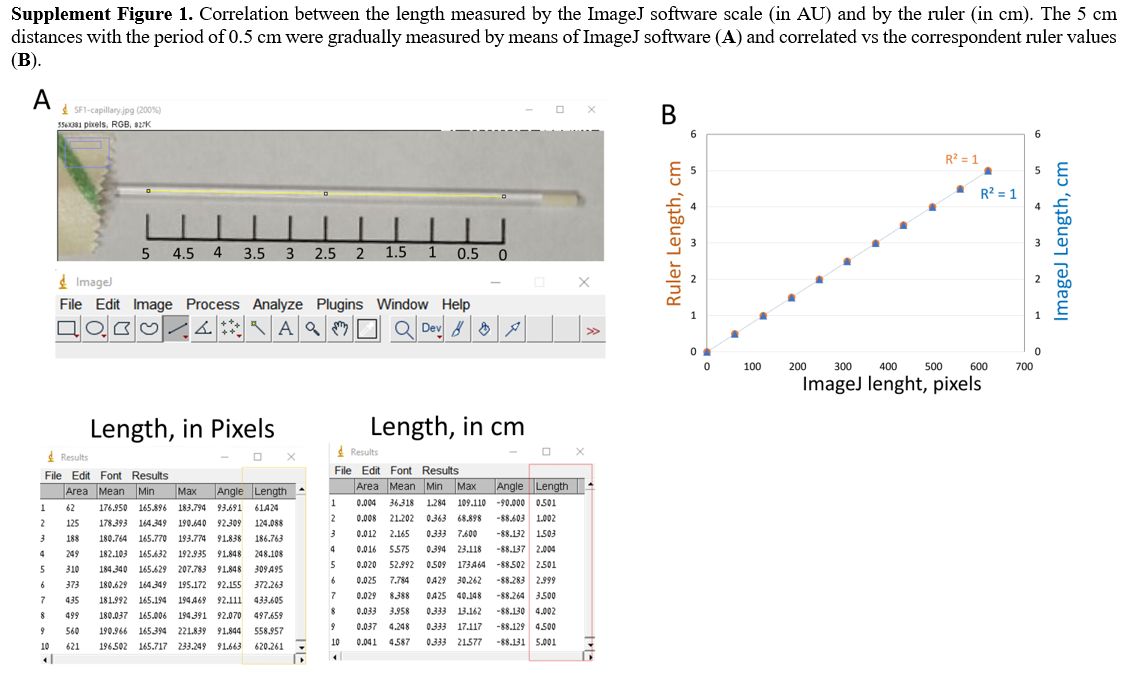 |
Supplementary Figure 1.
Correlation between the length measured by the ImageJ software scale
(in AU) and by the ruler (in cm). The 5 cm distances with the period of
0.5 cm were gradually measured by means of ImageJ software (A) and correlated vs the correspondent ruler values (B). |
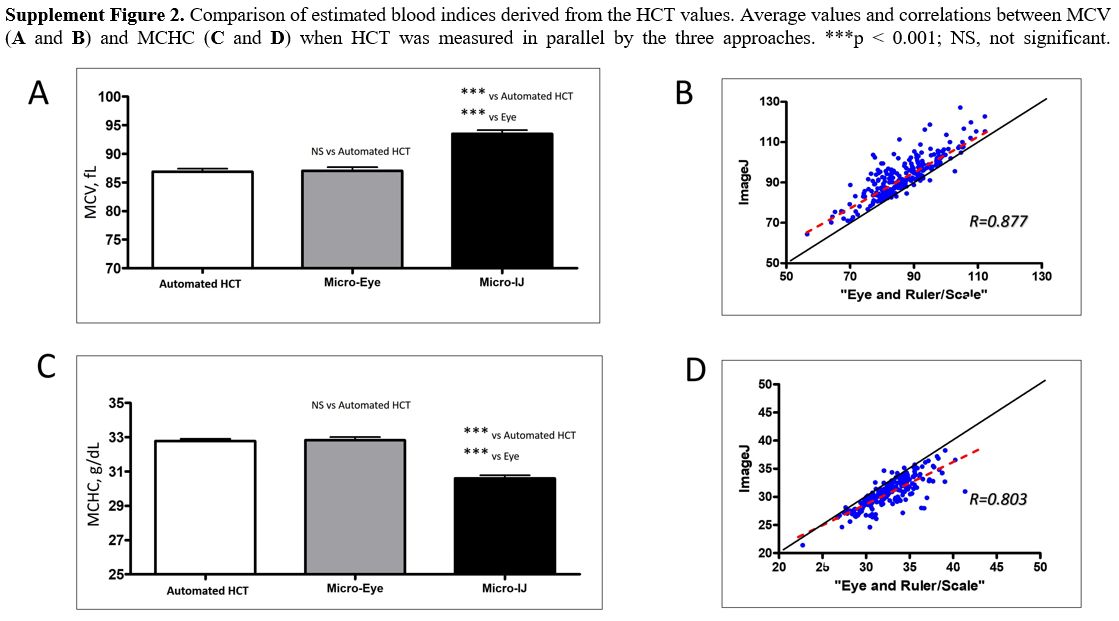 |
Supplement Figure 2.
Comparison of estimated blood indices derived from the HCT values.
Average values and correlations between MCV (A and B) and MCHC (C and D) when HCT was measured in parallel by the three approaches. ***p < 0.001; NS, not significant. |
[TOP]