Fengming Xu1,2,*, Jixing Yi3,*, Bumin Liang4, Cheng Tang1,2, Qing Feng3 and Peng Peng1,2.
1 Department
of Radiology, The First Affiliated Hospital of Guangxi Medical
University, Nanning,530021, Guangxi Zhuang Autonomous Region, China.
2
NHC Key Laboratory of Thalassemia Medicine (Guangxi Medical
University), Guangxi Zhuang Autonomous, Region Peoples Republic of
China.
3 Department of Radiology, Fourth Affiliated
Hospital of Guangxi Medical University, Liuzhou Workers' Hospital,
Liuzhou, 545005, Guangxi Zhuang Autonomous Region, China.
4 School of International Education, Guangxi Medical University, Nanning, 530021, Guangxi Zhuang Autonomous Region, China.
* The first two author equally contributed to the article
Published: November 1, 2022
Received: May 5, 2022
Accepted: October 8, 2022
Mediterr J Hematol Infect Dis 2022, 14(1): e2022072 DOI
10.4084/MJHID.2022.072
This is an Open Access article distributed
under the terms of the Creative Commons Attribution License
(https://creativecommons.org/licenses/by-nc/4.0),
which permits unrestricted use, distribution, and reproduction in any
medium, provided the original work is properly cited.
|
|
Abstract
Objective:
To explore the relationship between the liver iron concentration (LICF)
from FerriScan and T2* based LIC obtained by Circle Cardiovascular
Imaging CVI42 (CVI42), CMRtools / Thalassemia Tools (CMRtools), and
Excel spreadsheet (Excel).
Methods:
Liver T2* values in 78 thalassemia patients were measured using CVI42,
CMRtools, and Excel. Then the Garbowski formula was used to obtain LIC
from T2*. Finally, the relationship of the LIC measured by the above
three software and the LICF were compared.
Results: There was no statistical difference between the T2* values measured by CVI42, CMRtools, and Excel (P>0.05), but there was a high degree of consistency between them (P<0.001), and there was a high linear positive correlation between them (P<0.001).
There was no statistical difference between the LIC clinical grading
results of CVI42, CMRtools, and Excel and LICF grading results (P>0.05), and they were highly consistent (P<0.001).
Conclusion:
The liver T2* values measured by CVI42, CMRtools, and Excel are
equivalent. The LIC measured by CVI42, CMRtools, and Excel is
equivalent to the LICF.
|
Introduction
The
liver is the central conductor of systemic iron balance. Liver Iron
Concentration (LIC) can reflect the total iron load of the body and is
an important reference index for clinical monitoring and treatment of
iron overload.[1-3] Magnetic resonance (MR)
techniques, based on gradient echo T2* sequences, have been identified
as a non-invasive gold standard for quantifying tissue iron levels.[4,5]
After obtaining MR scanning images of the liver of patients with iron
overload, this technique requires the measurement of the corresponding
relaxation parameters. Currently, many methods and software have been
developed and applied to measure the values of T2* and R2* (1000/T2*)
to obtain an estimate of LIC. Some of these methods or software are
based on the researcher's correction formula,[6] some
are built-in software of the MR operating system, and some are
third-party commercial software. Software used to calculate T2*/R2*
values of organs on the market includes FuncTool, Matlab, Quanta
Hematology, CMRtools, CVI42, Excel, etc. Some of these pieces of
software, certified by the U.S. Food and Drug Administration (FDA),
have high accuracy, but their operation and maintenance are expensive.
Furthermore, there are some uncertified measurement methods, such as
Excel-based methods.
Due to different economic and medical
levels in different regions, many developing countries and regions
still use uncertified Excel for cardiac and liver T2* / R2*
measurements in patients with iron overload. Some studies have proved
that the T2*/R2* values of organs, measured by Excel, are correlated
and consistent with the results of FDA-certified software such as
CMRtools and CVI42.[7-9] However, most studies only
conducted comparative investigations between T2*/R2* values measured by
software. However, there was a lack of a comparison taking the
corresponding iron concentration as a standard for clinical grading.
Therefore, the author aims to evaluate the relationship between the
three measurement results by comparing the liver T2* values of
thalassemia patients measured by CVI42, CMRtools, and Excel.
Furthermore, the author used the LICF provided by the FDA-certified
FerriScan as a reference to evaluate the three software's accuracy for
clinical grading of liver iron deposition.
Materials and Methods
Research materials.
The clinical data and MRI of 150 thalassemia patients in the First
Affiliated Hospital of Guangxi Medical University were collected from
January 2011 to December 2015. The inclusion criteria were: (1)
Patients were genetically diagnosed with thalassemia and had a regular
history of blood transfusion. (2) 9 years old ≤ age ≤ 50 years old. (3)
Patients had both the T2* sequence MRI with intact liver 12 echoes and
the Ferriscan LIC report (which is R2 based) in the corresponding
period (the T2* images were acquired in the same MRI session after the
Ferriscan procedure). The exclusion criteria were: (1) MRI artifacts
were too large to meet the measurement requirements. (2) Patients had
other chronic liver diseases or tumor diseases. Finally, 78 patients
were included. There were 51 males and 27 females, ranging in age from
9 to 44 years old, with an average of (15.54±7.693) years old.
This
study was performed in line with the principles of the Declaration of
Helsinki. Moreover, the study was approved by the Ethics Committee of
the First Affiliated Hospital of Guangxi Medical University (Jan
18.2022/No: KY-E-029).
MR scanning method. MRI was performed on a 1.5T scanner (MAGNETOM Avanto Fit, Siemens Healthcare, Erlangen, Germany).
The
FerriScan acquisition consisted of a free-breathing 2D multislice
spin-echo pulse sequence. Relevant pulse sequence parameters include:
flip angle=90°, echo time (TE)=6, 9, 12, 15, 18 ms, repetition time
(TR)=1000 ms, FOV read=400 mm×400 mm, matrix=256 mm×256 mm, and 11
slices of 5 mm thickness.
T2* data were acquired using a breath
hold multiecho GRE scanning sequence at the same liver level as
FerriScan acquisition at free breathing. Relevant pulse sequence
parameters include: flip angle=20°, echo time (TE)=1.29, 2.35, 3.43,
4.6, 5.68, 6.85, 7.93, 9.1, 10.18, 11.35, 12.43, 13.6 ms, repetition
time (TR)=200.00 ms, FOV read=400 mm×400 mm, matrix=256 mm×256 mm, Slice
thickness=10 mm. Scan time was 15s.
Data processing.
The T2 image data was sent to FerriScan for processing. As mentioned
before, the required T2 image scan time for FerriScan is in the same
MRI session as the corresponding T2* image scan time, and the
difference between the FerriScan LIC reporting time and the
corresponding T2* measurement time does not exceed 48 hours.
The
T2* image data were all post-processed by the three software to measure
the T2* value, namely the CVI42 (Circle Cardiovascular Imaging Inc.,
Calgary, Canada), the CMRtools (CMRtools/Thalassemia Tools,
Cardiovascular Imaging Solutions, London, UK) and the Excel (Microsoft
Corp., Redmond, WA). Measurement process (Figure 1):
For CMRtools and CVI42, the image was imported into the software.
Avoiding the intrahepatic blood vessels and bile ducts seen by naked
eyes at the same level of the liver, the roughly same ROI was drawn
according to the area measured by FerriScan. The drawn ROI and matching
T2* values appeared in the post-processing software, and the cutoff
method was used to discard the interference signal value deviated from
the fitted curve and record the T2* value at the determination
coefficient value (R2=0.98). For
Excel, the SI corresponding to the 12 TE time was derived from the
original MR scan device. The SI and TE values were entered manually
into Excel. The T2* values were calculated using the embedded formula
SI=S0e-TE/T2*+C (S0 represents the signal intensity when TE=0 and C
represent the background noise). As MRI filtering noise had little
influence on the T2* value and was often ignored, constant C=0 was
selected.[7,8] Furthermore, the cutoff method is used
to discard the signal value interference deviating from the fitted
curve and record the T2* value at the determination coefficient value (R2=0.98). The Garbowski formula[10]
was used to obtain LIC from the T2* values obtained by the different
pieces of software. According to the LIC, patients were divided into a
normal group (<1.8mg/g dry weight), mild group (1.8~7.0mg/g dry
weight), moderate group (7.0~14.0mg/g dry weight), and severe group
(>14.0mg/g dry weight).
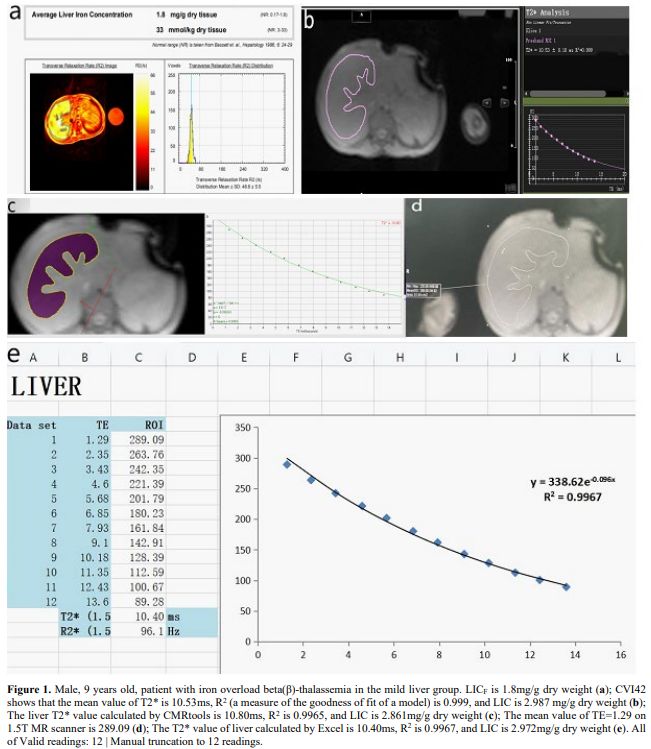 |
- Figure 1. Male, 9 years old, patient with iron overload beta(β)-thalassemia in the mild liver group. LICF is 1.8mg/g dry weight (a); CVI42 shows that the mean value of T2* is 10.53ms, R2
(a measure of the goodness of fit of a model) is 0.999, and LIC is
2.987 mg/g dry weight (b); The liver T2* value calculated by CMRtools
is 10.80ms, R2 is 0.9965, and LIC is
2.861mg/g dry weight (c); The mean value of TE=1.29 on 1.5T MR scanner
is 289.09 (d); The T2* value of liver calculated by Excel is 10.40ms, R2 is 0.9967, and LIC is 2.972mg/g dry weight (e). All of Valid readings: 12 | Manual truncation to 12 readings.
|
Statistical methods. Statistical analysis was performed using SPSS 26.0 statistical software package.
The
LIC and T2* values measured by the different methods did not conform to
normal distribution. Friedman's M test was used to explore the
differences. If P>0.05,
there is no statistically significant difference. Intraclass
correlation coefficient (ICC) was used to evaluate the consistency
level. If ICC>0.75, and P<0.05,
it was considered to have a high degree of consistency. Spearman rank
correlation analysis was used to explore the degree of correlation. A
high degree of correlation was indicated if the correlation coefficient
was |rs|>0.75 and P<0.05.
To
further evaluate the accuracy of the CVI42, CMRtools, and Excel for the
clinical grading of liver iron deposition, Fisher's exact probability
test was used to analyze the difference between the LICF clinical
grading results and the three post-processing software grading results.
If P>0.05, there was no
statistically significant difference. Agreement analysis of categorical
variables was performed using the Kappa test. If Kappa>0.75 and P<0.05, it was considered to have a high degree of consistency.
Results
The results of liver T2* values and LIC of 78 thalassemia patients measured by the different methods are reported in Tables 1 and 2.
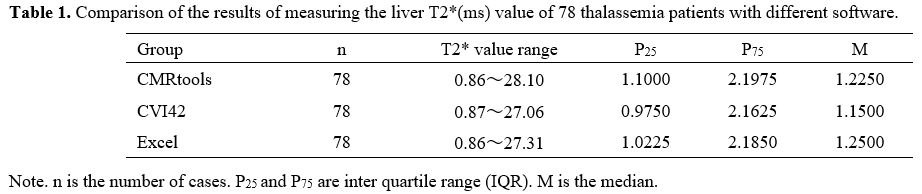 |
Table 1. Comparison of the results of measuring the liver T2*(ms) value of 78 thalassemia patients with different software. |
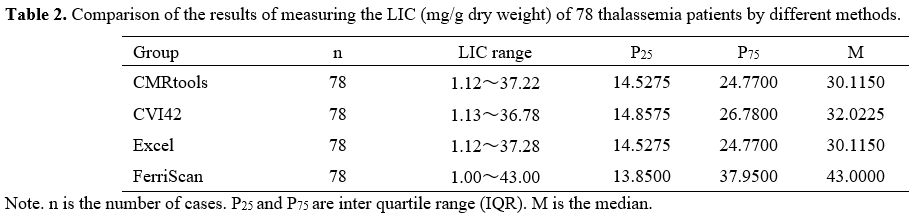 |
Table
2. Comparison of the results of measuring the LIC (mg/g dry weight) of 78 thalassemia patients by different methods.
|
Among the number of cases, two patients were classified as having moderate liver iron overload by FerriScan (LICF=13.90,
13.70 mg/g dry weight) but were classified as severe by CMRtools
(LIC=16.48, 14.43 mg/g dry weight), CVI42 (LIC=16.93, 14.49 mg/g dry
weight) and Excel (LIC=16.84, 14.43 mg/g dry weight). Four patients were
classified as a mild liver iron overload by FerriScan (LICF=6.80,
6.40, 5.60, 5.20 mg/g dry weight) but were classified as moderate by
CMRtools (LIC=10.21, 9.07, 8.92, 9.61 mg/g dry weight), CVI42
(LIC=10.34, 8.36, 8.84, 8.94 mg/g dry weight) and Excel (LIC=10.48,
8.50, 8.79, 8.67 mg/g dry weight). One patient was classified as having
mild liver iron overload by FerriScan (LICF=4.90 mg/g
dry weight), CVI42 (LIC=6.78 mg/g dry weight, and Excel (LIC=6.78 mg/g
dry weight) but was classified as moderate by CMRtools (LIC=7.11 mg/g
dry weight).
Through the scatter plot (Figure 2),
it is initially understood that there is a close correlation between
either the T2* values measured by the three software measurements and
between the LIC and the LICF.
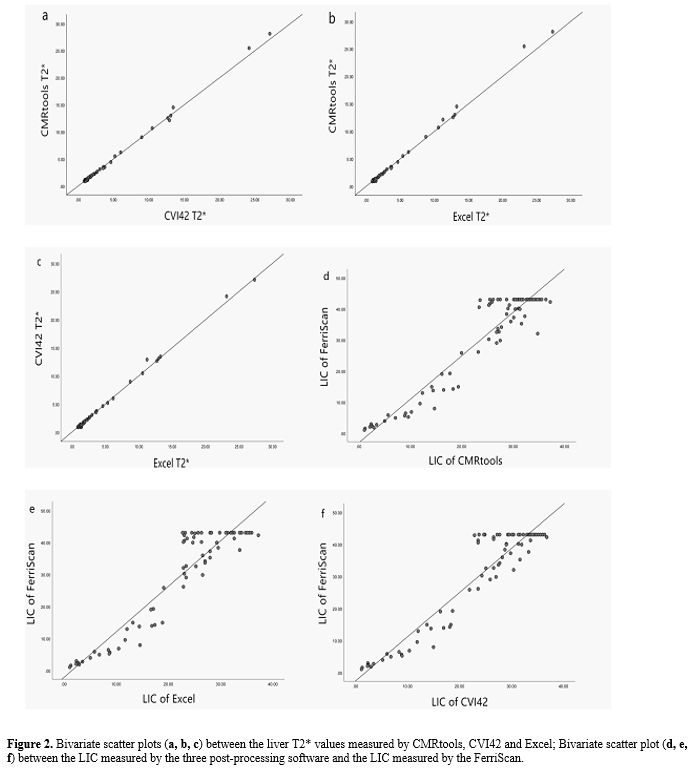 |
- Figure 2. Bivariate scatter plots (a, b, c) between the liver T2* values measured by CMRtools, CVI42 and Excel; Bivariate scatter plot (d, e, f) between the LIC measured by the three post-processing software and the LIC measured by the FerriScan.
|
By
statistical test, there was no statistical difference between the T2*
values measured by CVI42, CMRtools, and Excel (M=4.507, P=0.105), and they were highly consistent {ICC=0.998 (95%CI=0.997~0.999), P<0.001}.
Furthermore, the three pairs of liver T2* values measured by CVI42 and
CMRtools, CVI42 and Excel, and CMRtools and Excel were all highly
linearly positively correlated (rF=0.959, 0.911, 0.883, P<0.001).
The LICF and LIC measured by CVI42, CMRtools, and Excel were highly consistent {ICC=0.853 (95%CI=0.687~0.922), P<0.001}. On the other hand, the LICF and LIC measured by CVI42, CMRtools, and Excel were highly positively correlated (rs=0.857, 0.851, 0.862, P<0.001).
There was no statistical difference between the LIC clinical grading results of CVI42, CMRtools, and Excel (as shown in Figure 3) and LICF grading results (χ²=1.230, P=0.814; χ²=2.013, P=0.581; χ²=1.230, P=0.814). And they were highly consistent (Kappa=0.809, 0.778, 0.809, P<0.001).
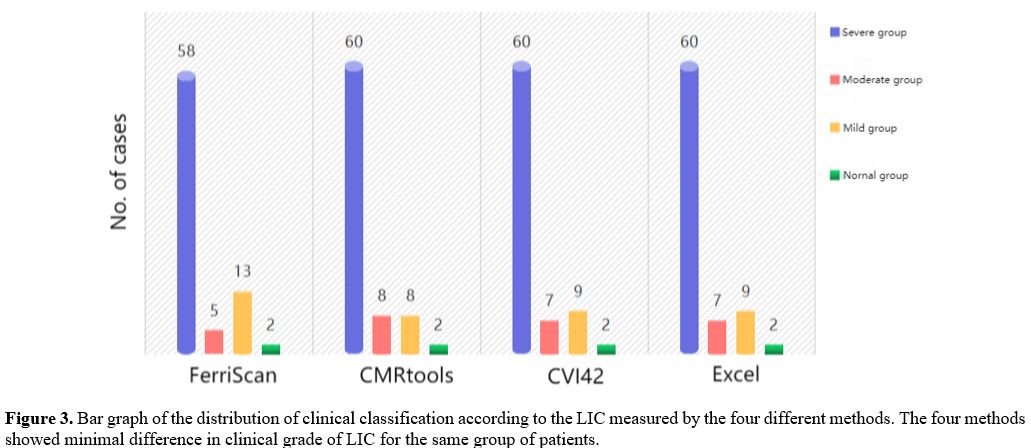 |
- Figure
3. Bar graph of the distribution of clinical classification according
to the LIC measured by the four different methods. The four methods
showed minimal difference in clinical grade of LIC for the same group
of patients.
|
It is suggested that the liver T2* values measured by CVI42, CMRtools, and Excel are equivalent. Likewise, the LICF and LIC measured by CVI42, CMRtools, and Excel are equivalent.
Discussion
After
years of research, MRI has become the de-facto gold standard for
tracking iron levels in the body because it is accurate, reproducible,
well tolerated by patients, and can track iron levels in different body
organs.[11] In addition, the T2*/R2* relaxation method has become reliable for constructing a linear relationship with LIC.[12]
Many medical centers have used the T2*/R2* relaxation method, self-made
sequences, and post-processing software with specific LIC calibration
formulas to quantitatively examine the viscera's iron concentration.[6]
With the T2*/R2* values measured by different post-processing software,
each center can perform a more accurate non-invasive assessment of
organs for patients with iron overload.[13]
In
this study, we first compared the liver T2* values measured by CVI42,
CMRtools, and Excel; and found that the results of the three
measurements were highly relevant and consistent, which is consistent
with the results of Ouederni[7] and Fernandes.[8,9] Then, by comparing the relationship between the LIC obtained by different methods and the LICF provided by FerriScan. We found that the LIC obtained by the different methods were not statistically different from the LICF,
and they were highly correlated and consistent (including raw
measurement data analysis and categorical variables data after clinical
classification analysis).
Among the cases, two patients, graded as
moderate iron overload in the liver by FerriScan, were graded as severe
by CVI42, CMRtools, and Excel. Two patients, graded as mild iron
overload in the liver by FerriScan, were graded as moderate by CVI42,
CMRtools, and Excel. These cases' non-overlapping clinical grading
results of FerriScan and three post-processing software may be caused
by the technical difference between the LIC obtained by R2 and R2*
technology.[14] Studies by Jhaveri,[14] Chan,[15] Sussman,[16] and others showed that, under the premise of using the LICF
provided by FerriScan as the reference standard, there is a certain
degree of difference in the specificity and sensitivity of R2*
technology in detecting LIC>7 mg/g liver weight. Moreover,
repeatability and consistency across multiple platforms cannot achieve
very good results.
On the other hand, in case of significant
iron overload, since the liver signal is already lower than that of the
muscle in the shortest TE and collapses rapidly with TE elongation, the
R2* technique is likely to cause some error in measuring the LIC of
patients with high liver iron overload.[16] Studies by d'Assignies[17] and Gandon[18]
showed that it is probably better to use the calculation of R2* for low
or moderate overloads and to switch to the signal intensity ratio
between the liver and the paravertebral muscles (SIR) method for heavy
overloads. There are already pieces of software capable of both T2*
technology and SIR method LIC, such as MRQuantif, which allows doctors
to choose the optimal measure based on the severity of iron overload.
We
think that although there was good consistency of clinical measurement
data, it could not prove that there was no difference in their
diagnostic efficacy or clinical grade composition ratio. The specific
explanations are as follows: (1) The difference test between the T2*
values measured by the software in some studies generally classifies
the data as normality measurement data and uses the paired t-test,
which is only a test and analysis of the average level of the data set.
(2) Correlation analysis tests the closeness and direction of the
correlation between the two variables. The LICF,
LIC, and T2* value data in this study did not obey the normality
distribution; the Spearman rank correlation analysis was used to
evaluate the overall monotonic relationship between the two variables.
(3) Using the LICF
clinical grading as the reference standard, the chi-square test was
performed by converting the LIC of continuous measurement data into
count data of categorical variables through a clear medical reference
value. Although some information was lost and the test power was
reduced, the composition and distribution of clinical data could be
explored to clarify the accuracy of clinical grading of LIC measured by
different software. (4) The range of medical reference value should be
treated rationally. That is, when the numerical variable of an
indicator is within the normal reference range, it can only mean that
the indicator has a high probability of being normal. Similarly, when
the numerical variable of an indicator is outside the normal reference
range, it can only indicate a large probability of problems with the
indicator.
The deficiencies of this experiment are as follows:
(1) In the setting of ROI, we need to delineate the ROI on three
different post-processing pieces of software and try to keep it as
consistent as possible with the ROI delineated in the FerriScan image
report. However, artificial ROI delineation is susceptible to various
subjective and objective factors, and measurement error is inevitable.
(2) Due to the characteristics of the etiology received by our clinical
center, the clinical grading of liver iron deposition in the subjects
included in this study was biased towards moderate and severe, and
there was a certain "selection bias". Nevertheless, this does not
affect the lateral comparison of the measured results between the
software.
Conclusions
The
liver T2* values, measured by the CVI42, CMRtools, and Excel methods,
were equivalent. The LIC measured by three methods of CVI42, CMRtools,
and Excel was equivalent to the LICF
reported by FerriScan. The cost of different software or measurement
methods varies. Different research centers can choose different
measurement methods to test patients' LIC according to their own needs
and economic level.
Authors' contributions
Peng Peng
contributed to the study conception and design. Material preparation
and data collection were performed by Fengming Xu, Jixing Yi, Cheng
Tang and Qing Feng. Data analysis were performed by Fengming Xu and
Jixing Yi. The first draft of the manuscript was written by Fengming
Xu, Jixing Yi, Bumin Liang and all authors commented on previous
versions of the manuscript. All authors read and approved the final
manuscript.
Data availability
The dataset used in
support of the findings of this study are available from the
corresponding auther at email address upon request.
Ethics Approval
This
study was performed in line with the principles of the Declaration of
Helsinki. Furthermore, the study was approved by the Ethics Committee
of the First Affiliated Hospital of Guangxi Medical University (Jan
18.2022/No: KY-E-029).
Consent to Participate
All patients (or parents/guardians) gave written informed consent to participate in the study.
Funding
This
work was supported by grants from the Natural Science Foundation of
China (81760305), Natural Science Foundation of China (81641066), and
Innovation Project of Guangxi Graduate Education (YCSW2021135).
References
- Labranche R, Gilbert G, Cerny M, Vu KN, Soulières
D, Olivié D, Billiard JS, Yokoo T, Tang A (2018) Liver Iron
Quantification with MR Imaging: A Primer for Radiologists.
Radiographics 38(2):392-412. https://doi.org/10.1148/rg.2018170079 PMid:29528818
- Pinto
VM, Forni GL (2020) Management of Iron Overload in Beta-Thalassemia
Patients: Clinical Practice Update Based on Case Series. Int J Mol Sci
21(22):8771. https://doi.org/10.3390/ijms21228771 PMid:33233561 PMCid:PMC7699680
- Meynard
D, Babitt JL, Lin HY. The liver: conductor of systemic iron balance.
Blood. 2014;123(2):168-176. doi:10.1182/blood-2013-06-427757 https://doi.org/10.1182/blood-2013-06-427757 PMid:24200681 PMCid:PMC3888285
- Henninger
B, Plaikner M, Zoller H, Viveiros A, Kannengiesser S, Jaschke W,
Kremser C (2021) Performance of different Dixon-based methods for MR
liver iron assessment in comparison to a biopsy-validated R2*
relaxometry method. Eur Radiol 31(4):2252-2262. https://doi.org/10.1007/s00330-020-07291-w PMid:32965571 PMCid:PMC7979591
- Khadivi
Heris H, Nejati B, Rezazadeh K, Sate H, Dolatkhah R, Ghoreishi Z,
Esfahani A (2021) Evaluation of iron overload by cardiac and liver T2*
in β-thalassemia: Correlation with serum ferritin, heart function and
liver enzymes. J Cardiovasc Thorac Res 13(1):54-60. https://doi.org/10.34172/jcvtr.2021.18 PMid:33815703 PMCid:PMC8007896
- Henninger
B, Alustiza J, Garbowski M, Gandon Y (2020) Practical guide to
quantification of hepatic iron with MRI. Eur Radiol 30(1):383-393. https://doi.org/10.1007/s00330-019-06380-9 PMid:31392478 PMCid:PMC6890593
- Ouederni
M, Ben Khaled M, Mellouli F, Ben Fraj E, Dhouib N, Yakoub IB, Abbes S,
Mnif N, Bejaoui M.(2017)Myocardial and liver iron overload, assessed
using T2* magnetic resonance imaging with an excel spreadsheet for post
processing in Tunisian thalassemia major patients. Ann Hematol
96(1):133-139. doi: 10.1007/s00277-016-2841-5 https://doi.org/10.1007/s00277-016-2841-5 PMid:27730342
- Fernandes
JL, Fioravante LAB, Verissimo MP, Loggetto SR (2017) A free software
for the calculation of T2* values for iron overload assessment. Acta
Radiol 58(6):698-701. https://doi.org/10.1177/0284185116666416 PMid:27614069
- Fernandes
JL, Sampaio EF, Verissimo M, Pereira FB, da Silva JA, de Figueiredo GS,
Kalaf JM, Coelho OR (2011) Heart and liver T2 assessment for iron
overload using different software programs. Eur Radiol 21(12):2503-10. https://doi.org/10.1007/s00330-011-2208-1 PMid:21842212
- Garbowski
MW, Carpenter JP, Smith G, Roughton M, Alam MH, He T, Pennell DJ,
Porter JB (2014) Biopsy-based calibration of T2* magnetic resonance for
estimation of liver iron concentration and comparison with R2
Ferriscan. J Cardiovasc Magn Reson 16(1), 40. https://doi.org/10.1186/1532-429X-16-40 PMid:24915987 PMCid:PMC4064805
- Wood
J. C. (2014). Use of magnetic resonance imaging to monitor iron
overload. Hematology/oncology clinics of North America, 28(4), 747-vii.
https://doi.org/10.1016/j.hoc.2014.04.002 PMid:25064711 PMCid:PMC4115249
- Healy
GM, Kannengiesser SAR, Espin-Garcia O, Ward R, Kuo KHM, Jhaveri KS
(2021) Comparison of Inline R2* MRI versus FerriScan for liver iron
quantification in patients on chelation therapy for iron overload:
preliminary results. Eur Radiol 31(12), 9296-9305. https://doi.org/10.1007/s00330-021-08019-0 PMid:34041571
- Bacigalupo
L, Paparo F, Zefiro D, Viberti CM, Cevasco L, Gianesin B, Pinto VM,
Rollandi GA, Wood JC, Forni GL (2016) Comparison between different
software programs and post-processing techniques for the MRI
quantification of liver iron concentration in thalassemia patients.
Radiol Med 121(10), 751-762. https://doi.org/10.1007/s11547-016-0661-2 PMid:27334009
- Jhaveri
KS, Kannengiesser SAR, Ward R, Kuo K, Sussman MS (2019) Prospective
Evaluation of an R2* Method for Assessing Liver Iron Concentration
(LIC) Against FerriScan: Derivation of the Calibration Curve and
Characterization of the Nature and Source of Uncertainty in the
Relationship. J Magn Reson Imaging 49(5), 1467-1474. https://doi.org/10.1002/jmri.26313 PMid:30291649
- Chan
WC, Tejani Z, Budhani F, Massey C, Haider MA (2014) R2* as a surrogate
measure of ferriscan iron quantification in thalassemia. J Magn Reson
Imaging 39(4), 1007-1011. https://doi.org/10.1002/jmri.24216 PMid:24123694
- Sussman
MS, Ward R, Kuo KHM, Tomlinson G, Jhaveri KS (2020) Impact of MRI
technique on clinical decision-making in patients with liver iron
overload: comparison of FerriScan- versus R2*-derived liver iron
concentration. Eur Radiol 30(4), 1959-1968. https://doi.org/10.1007/s00330-019-06450-y PMid:31953658
- d'Assignies,
G., Paisant, A., Bardou-Jacquet, E., Boulic, A., Bannier, E., Lainé,
F., Ropert, M., Morcet, J., Saint-Jalmes, H., & Gandon, Y. (2018).
Non-invasive measurement of liver iron concentration using 3-Tesla
magnetic resonance imaging: validation against biopsy. European
radiology, 28(5), 2022-2030. https://doi.org/10.1007/s00330-017-5106-3 PMid:29178028
- Gandon,
Y., Olivié, D., Guyader, D., Aubé, C., Oberti, F., Sebille, V., &
Deugnier, Y. (2004). Non-invasive assessment of hepatic iron stores by
MRI. Lancet (London, England), 363(9406), 357-362. https://doi.org/10.1016/S0140-6736(04)15436-6
[TOP]