Vincenzo de Sanctis1, Ashraf T Soliman2, Shahina Daar3, Ploutarchos Tzoulis4, Salvatore Di Maio5 and Christos Kattamis6.
1 Coordinator
of ICET-A Network (International Network of Clinicians for
Endocrinopathies in Thalassemia and Adolescence Medicine), Ferrara,
Italy.
2 Department of Pediatrics, Division of
Endocrinology, Hamad General Hospital, Doha, Qatar and Department of
Pediatrics, Division of Endocrinology, Alexandria University Children’s
Hospital, Alexandria, Egypt.
3 Department of Haematology, College of Medicine and Health Sciences, Sultan Qaboos University, Sultanate of Oman.
4 Department of Diabetes & Endocrinology, Whittington Hospital, University College London, London, UK.
5 Emeritus Director in Pediatrics, Children’s Hospital “Santobono-Pausilipon”, Naples, Italy.
6 First Department of Paediatrics, National Kapodistrian University of Athens, Greece.
Correspondence to:
Vincenzo de Sanctis. Coordinator of ICET-A Network (International
Network of Clinicians for Endocrinopathies in Thalassemia and
Adolescence Medicine) and Pediatric and Adolescent Outpatient Clinic,
Private Accredited Quisisana Hospital, Ferrara, Italy. E-mail:
vdesanctis@libero.it
Published: January 1, 2023
Received: September 23, 2022
Accepted: December 19, 2022
Mediterr J Hematol Infect Dis 2023, 15(1): e2023006 DOI
10.4084/MJHID.2023.006
This is an Open Access article distributed
under the terms of the Creative Commons Attribution License
(https://creativecommons.org/licenses/by-nc/4.0),
which permits unrestricted use, distribution, and reproduction in any
medium, provided the original work is properly cited.
|
|
Abstract
Aims:
The primary aim of this study was to evaluate retrospectively the
glucose homeostasis and surrogate indices of insulin sensitivity and
resistance, during a 3-hour oral glucose tolerance test (OGTT), in β-
thalassemia major patients (β-TM) with serum ferritin (SF) below 1,000
ng/mL.
Patients and methods:
The retrospective cohort study evaluated the medical records of 24 β-ΤΜ
patients from 2010 to 2022. Αt the year of study the mean age of
patients was 31.0 ± 4.1 (20-37.11) years; 13 (54.1%) were
females. The most commonly used iron chelator was deferoxamine (DFO:
75%), followed by deferiprone (DFP: 12.5%) and deferasirox (DFX: 12.5%).
Insulin sensitivity and resistance indices were derived from OGTT. A
liver iron concentration (LIC) < 3 mg/g d.w. and a global heart T2*
value > 20 ms were considered as conservative cut-off values for
insignificant iron overload (IOL).
Results:
The mean SF levels in the whole study cohort population at the age of
evaluation was 549.6 ± 232.3 ng/mL. Based on the SF levels, two groups
were identified: Group A (N = 14) < 500 ng/mL and Group B (N=10)
500-1,000 ng/mL. Normal glucose tolerance (NGT) during OGTT was
observed in 4 patients of Group A (28.5%) and in 5 patients of Group B
(50%) (P: 0.29). The remaining 15/24 patients (62.5%) had glucose
dysregulation (GD). The mean age at starting iron chelation therapy
(ICT) and the mean SF peak in Group A versus Group B were significantly
higher in group Α. The GD was associated with significantly attenuated
IGI (first phase of insulin response) and impaired oral disposition
index (oDI). Hypogonadotropic hypogonadism (HH) was the most common
associated endocrine complication in both groups of patients.
Conclusions:
This study showed that efficient iron chelation monotherapy in patients
with β-TM and SF < 1,000 ng/ml did not entirely prevent glucose
metabolism disorders, abnormalities of insulin secretion and
sensitivity, and development of acquired hypogonadism.
|
Introduction
The
basic defect in β-thalassaemia is the reduced or absent production of β
globin chains leading to a relative excess of α chains. The excess of α
globin chains in the form of inclusion bodies accumulates and
precipitates in the erythroid precursors causing oxidative membrane
damage and ineffective erythropoiesis.[1] Based on the
severity of the clinical phenotype, β-thalassemia has been classified
into three main types: transfusion-dependent thalassaemia (TDT) or
β-thalassemia major (β-TM), non-transfusion- dependent thalassaemia
(NTDT) or thalassemia intermedia (TI), and thalassemia minor
(heterozygote, silent carrier state).[2]
The
recommended treatment for β-TM patients is lifelong, regular packed red
blood cell transfusions (Transfusion Dependent Thalassemia-TDT).
Transfusions
lead to excess iron input and systemic iron overload accumulating in
the heart, liver, spleen, endocrine glands, and other tissues; if iron
overload is not treated, it can lead to a wide array of complications.
As a rule, the liver has the highest iron overload, followed by the
pancreas and the heart.[4]
Iron chelation therapy
(ICT) is essential to prevent and/or reduce complications of iron
overload (IOL) and to decrease morbidity and mortality in the TDT
population. An appropriate dose of ICT should be given to be efficient,
and that requires a deep commitment to the chelation protocol prepared
for the individual patient (personalized treatment). Moreover,
adherence to treatment is very critical in these patients.[5]
Three
iron chelators are currently available for the treatment of IOL:
deferoxamine (DFO) as a subcutaneous or intravenous infusion; oral
deferiprone (DFP) in tablet or solution form; and oral deferasirox
(DFX), as a dispersible tablet and more recently, film-coated tablet.
Studies have shown differences in chelators’ efficacy in controlling
IOL. DFP is superior in controlling or reducing myocardial iron load,
while DFO is more effective in controlling or reducing hepatic iron
load.[6]
Older patients with β-TM were initially
treated with a single iron chelating agent (DFO). ICT's effectiveness
was followed by serial iron quantification of serum ferritin (SF) and
transferrin saturation. Later, additional methods for monitoring ICT
were developed, namely magnetic resonance imaging (MRI) for assessment
of liver iron concentration (LIC) and T2* for cardiac iron load for
monitoring chelator efficacy or stratifying end-organ risk.[4]
Each method has pros and cons to quantifying and monitoring iron
burden. When intensification of chelation is required for patients with
a very high iron burden, combination therapy is used. A long experience
with combination therapy concerns DFO and DFP chelators.
SF levels
>1,000 ng/mL are indicators of iron overload and are associated with
iron-mediated tissue damage. A recent report has documented the
occurrence of diabetes [based on the American Diabetes Association
(ADA) criteria],[8] in three groups of β-TM patients with different levels of SF.
Based
on their mean SF levels, they were divided into three groups: <500
ng/mL (N = 32 patients), between 500 and 1,000 ng/mL (N = 43 patients),
and between 1,000 and 2,500 ng/mL (N = 28 patients). Diabetes mellitus
was detected in 15.6%, 7% and 10.7%, respectively (P: 0.487).[7]
No
information was reported about other abnormalities of glucose
homeostasis. MRI pancreatic IOL was comparable among the three groups.
No difference was found in the frequency of hypogonadism,
hypothyroidism, hypoparathyroidism, osteopenia/ osteoporosis,
arrhythmias, and hepatic cirrhosis among the 3 groups.[7]
Chelation therapy was started at the mean age of 7.3 ± 5.1 years; 5.8±
4.3 years; and 6.2 ± 6.7 years, respectively. The difference was not
statistically significant between groups of patients (P: 0.25). No
signs of hematological/renal toxicity were documented in any of these
patients.[7]
The primary aim of this study was to
evaluate in depth the variations of glucose homeostasis and surrogates
indices of insulin sensitivity and resistance, during a 3-hour OGTT, in
adult β-TM patients with SF below 1,000 ng/mL.
Patients and Methods.
Study population and design.
All β-TM patients consecutively referred for consultation or second
opinion, basically for endocrinological and metabolic problems, to a
single Italian centre (Pediatric and Adolescent Outpatient Clinic,
Private Accredited Quisisana Hospital, Ferrara, Italy) from October
2010 to July 2022, were reviewed. Patients who had SF levels below
1,000 ng/mL at the time of referral (assessed as the mean of values
collected during the last 12 months prior to referral) were selected
for the study. All patients were of Italian ethnic origin. This study
was conducted in the context of an ongoing observational study of the
natural history of GD in patients with β-TM, promoted by the
International Network of Clinicians for Endocrinopathies in Thalassemia
and Adolescence Medicine (ICET- A).
Eligibility Criteria.
The inclusion criteria for the study were patients with β-TM: (a)
receiving routine blood transfusion (TDT) and chelation treatment; (b)
over the age of 18 years with SF levels < 1,000 ng/mL on the year of
referral; (c) quantification of liver and myocardial iron deposition
assessed within the previous 8 months by MRI, before referral.
Exclusion criteria were β-TM patients with: (a) diabetes, either
insulin dependent or on antidiabetic agents; (b) mean SF values >
1,000 ng/mL, in the previous 12 months before performing OGTT; (c)
major chronic illness other than β-TM; (e) non-transfusion dependent
β- thalassemia; (d) bone-marrow transplanted and (e) systemic
glucocorticoid treatment within the previous 4 weeks before OGTT.
The
medical records of 24 β-TM patients with the inclusion criteria were
retrieved. The following data were collected: age, gender, ethnicity,
anthropometry, pubertal status, age at first transfusion, interval
between transfusions, age at starting chelation, peak of SF (defined as
the highest level registered from the beginning of chelation therapy to
the last observation), age at splenectomy, and associated endocrine
complications. β -TM patients were diagnosed on the basis of clinical
and laboratory data and the related phenotypes.[1,2]
Anthropometry and assessment of associated endocrine complications. Height and weight were measured according to international recommendations.[9,10]
Short stature was defined as height 2 SD below the mean height for age
and sex. Body Mass Index (BMI) was calculated as weight in kilograms
divided by the square of height in meters. BMI was evaluated based on
the World Health Organization (WHO) recommendations: underweight
(<18.5 kg/m2); normal range (18.5–24.9 kg/m2); overweight (25.0– 29.9 kg/m2); obese (≥ 30 kg/m2).[11] Associated endocrine complications were assessed and defined according to the I-CET position statement published in 2013.[10]
Serum
IGF-1 concentration was determined by chemiluminescent immunoassay
(Siemens Healthcare Medical Diagnostics, Bad Nauheim, Germany). The
assays were performed according to the manufacturer’s recommendations.
OGTT: Method and definitions.
OGTT was performed after an overnight fast of 10 hours. Blood was
sampled through a peripheral intravenous catheter at times 0, 30, 60,
90, 120 and 180 minutes after 1.75 g/kg (maximum 75 g) of glucose was
administered as a 20% oral solution. Informed consent was obtained
before study procedures were performed. Plasma glucose and insulin
levels were determined, and indices of β-cell function, insulin
sensitivity, and insulin secretion were calculated. Based on plasma
glucose results on OGTT, each patient’s glycemic status was classified
according to the American Diabetes Association (ADA) criteria.[8]
In
addition to the traditional criteria for glucose level during OGTT, we
also used other criteria for glucose dysregulation (GD), based on
current published definitions: (a) the time of glucose considered as
"late response" when the glucose peak was > 30 min during OGTT; (b)
PG levels ≥155 mg/dL at 1-h; (c) the presence of indeterminate glucose
tolerance (INDET), defined as a normal fasting PG and normal 2-h
post-challenge glucose with any intermediate OGTT plasma glucose level
≥ 200 mg/dL);[12] (d) the glucose curve shapes during OGTT,[13] and (e) the presence of hypoglycemia ≤ 55 mg/dL at any time during the OGTT with or without symptoms of hypoglycemia.[14]
The
glucose curve shape was classified as ‘monophasic’ when PG increased
after an oral glucose load between 30 and 90 min until a peak was
reached, followed by a subsequent decline of ≥ 4.5 mg/dL. A biphasic
curve was defined as a rise of blood glucose to a peak followed by a
fall (as in the monophasic curve), then followed by a second rise of ≥
4.5 mg/dL.[13]
The control group consisted of
the data reported in a previous study in eleven healthy adult
volunteers (mean age: 23.8 ± 3.2 years) who were not carriers for
β-thalassemia, overweight or obese.[15]
PG was
measured using an automated glucose oxidase reaction (Glucose Analyser,
Ames). Plasma was separated within 60 min for storage at − 60°C until
assay. Plasma insulin was determined by a commercial chemiluminescence
solid phase immunometric assay (Immulite and Immulite 2000, Diagnostic
Products, Corp, Los Angeles, CA). All insulin samples were tested in
duplicate, and the values were expressed in μU/ml.
Surrogate β-cell function indices related to OGTT. Different indirect indices were also applied to evaluate insulin resistance and sensitivity.
These were:
(a)
Early-phase insulin secretion (IGI) calculated as the ratio between the
incremental plasma insulin and glucose concentrations during the first
30 min of the OGTT (ΔI 0–30/ΔG 0–30);[16]
(b)
Insulin sensitivity estimated using the Matsuda index (MI 0-120), a
well-established measure of whole-body insulin sensitivity for both
hepatic and peripheral tissues that has been validated against the
euglycemic-hyperinsulinemic clamp;[17]
(c) As a
secondary measure of insulin sensitivity (largely hepatic), the
reciprocal of the homeostasis model assessment of insulin resistance
(HOMA-IR) was assessed;[18]
(d) Finally, the
oral disposition index (oDI) was calculated as the product of the IGI
and the MI 0-120. This index reflects the relationship between β-cell
function (first-phase insulin secretion) and peripheral insulin
sensitivity (hepatic and peripheral tissues). The oDI provides an
evaluation of pancreatic β-cell function adjusted for insulin
sensitivity and is predictive for deterioration of glucose
dysregulation.[19]
Iron Overload Assessment.
Iron overload was evaluated by direct and indirect methods namely by SF
and Magnetic Resonance Imaging (MRI) T2* of liver and heart.
SF
was measured by chemiluminescence immunoassays (Beckman Access Dxl).
The normal reference range values are 30-350 ng/mL in males and 15-150
ng/mL in females. Generally, a cut-off value of SF concentration higher
than 800 ng/mL indicates significant IOL.[20]
Reported
global myocardial and liver IOL data, assessed by MRI and registered
not more than 8 months before OGTT, were collected. The values were
expressed in mg/g dry weight (d.w.) for LIC, classified into normal
(LIC < 3), mild (LIC > 3 and < 7), moderate (LIC > 7 and
< 14) and severe overload (LIC > 14).[21] A global heart T2* value < 20 ms was considered as a conservative cut-off for significant myocardial iron overload.[22]
Biochemical assays and hepatitis C seropositivity. Blood samples were taken in the morning, one or two weeks after the blood transfusions.
Biochemical
parameters (liver enzymes, serum creatinine and plasma glucose) were
assessed in the same laboratory using commercially available kits.
Based on the registered presence of HCV antibodies (anti-HCV) and HCV
ribonucleic acid (HCV RNA), patients were categorized in three groups:
negative patients, patients who eradicated the virus spontaneously or
after treatment with antiviral therapy, and patients with chronic HCV
infection (anti-HCV and HCV-RNA positive).
Statistical analysis.
All numeric variables were expressed as mean ± standard deviation (SD).
Comparison of variables in the two groups of patients was made using an
independent sample t-test and variables with non-normal distribution
were compared using non-parametric Wilcoxon’s signed rank test.
Pearson’s
correlation tests (2-tailed) were used to study correlations between
variables with parametric and non-parametric distributions. For the
statistical analysis, a software program was used and validated,
according to Alder and Roesser.[23] A P value < 0.05 was considered statistically significant.
Ethics. All procedures were in accordance with the 1964 Helsinki declaration and its later amendments.
According
to the Italian regulations, ethics approval by the local Ethics
Committee was not required for the following reasons: no identifiable
private information was collected; patients underwent only routine
diagnostic and therapeutic procedures according to current guidelines[24]
and an anonymized dataset was analyzed. Furthermore, informed consent
was obtained from all patients after a detailed explanation of the
nature and purpose of the study and the likely risks and benefits
associated with study participation.
Results
a. Patients characteristics and iron overload.
Out of the 94 β-TM patients followed at a single Centre, 24 (25.5 %)
fulfilled the criteria and were included in the study. The mean age of
patients at the time of the study was 31.0 ± 4.1 years (range: 20-37.11
years); 13 (54.1%) were females. The chelator most often used for the
longest period was DFO (75%) followed by DFP or DFX (12.5%),
respectively.
The clinical, demographic, and laboratory data of recruited β-TM patients are summarized in Table 1.
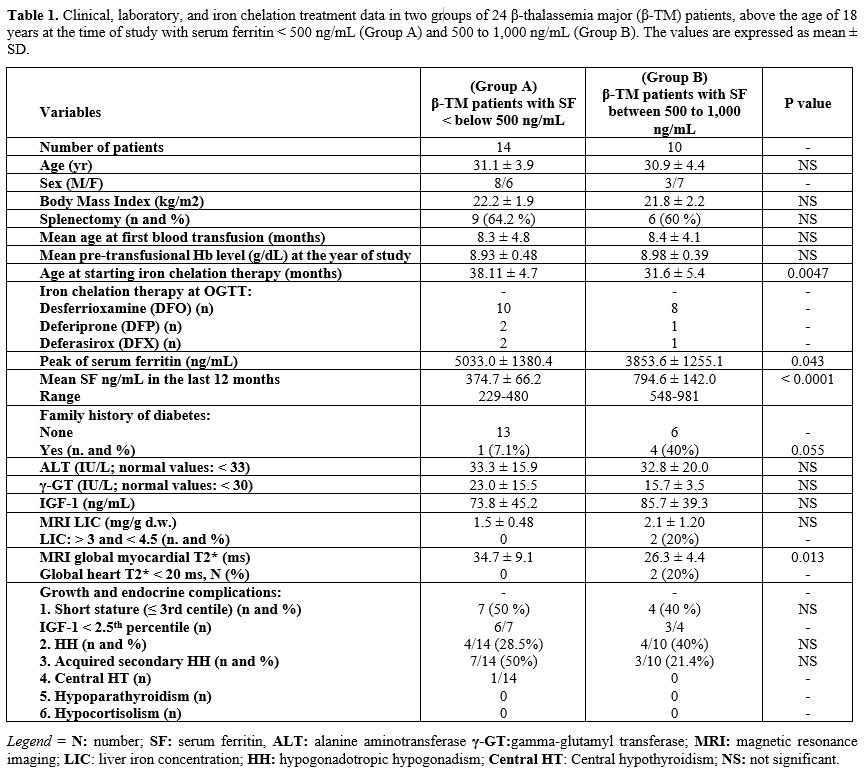 |
- Table
1. Clinical, laboratory, and iron chelation treatment data in two
groups of 24 β-thalassemia major (β-TM) patients, above the age of 18
years at the time of study with serum ferritin < 500 ng/mL (Group A)
and 500 to 1,000 ng/mL (Group B). The values are expressed as mean ± SD.
|
The
mean SF level in the whole study population was 549.6 ± 232.3 ng/mL.
Two groups of β-TM patients were identified based on the SF levels:
<500 ng/mL (Group A; N = 14) and between 500 and 1,000 ng/mL (Group
B; N = 10). No significant differences were found between the two
groups regarding mean age, BMI, IGF-1, ALT and γ-GT variables (Table 1).
13/24 patients (54.2%) had chronic hepatitis C; 4/13 did not previously
respond to antiviral therapy, 5 refused antiviral therapy, and 4 were
not treated because of normal serum ALT levels.
One female patient
of Group A was overweight, and two females of Group B were obese. In
addition, MRI global myocardial T2* (ms) was significantly lower in
group B (i.e., more iron in the myocardium).
The mean age at starting ICT and the mean SF peak of Group A versus Group B differed significantly between the two groups (Table 1).
b. OGTT.
Normal glucose tolerance (NGT) during OGTT was observed in 9 of 24
(37.5%) patients, in 4 of Group A (28.5 %), and 5 of Group B (50%) (P:
0.29).
A late glucose peak (at 60' or 90' minutes) was observed
in 12 patients of Group A (85.7%) and in 7 patients (70%) of Group B.
The OGTT in the remaining patients of Group A showed: isolated IFG in 1
patient, IGT in 5 patients, IFG+IGT in 1 patient, and 1-h PG > 155
mg/dL in 3 patients; Group B showed: IGT in 3 patients and 1-h PG >
155 mg/dL in 2 patients. No patient had fasting PG or OGTT values
consistent with diabetes or INDET.
A ‘monophasic’ glucose curve
shape during OGTT was observed in 11 patients of Group A (78.5%), and
6 patients of Group B (60%) (P: 0.33) and a ‘biphasic’ glucose curve
shape was observed in all the remaining patients but one in whom the
glucose curve shape could not be classified.
Two male patients
(one from each group of patients) showed a PG level, at 3-h during
OGTT, compatible with the diagnosis of biochemical hypoglycemia[14] (52 mg/dL and 51 mg/dL, respectively).
In
two patients of group B (1 male and 1 female on treatment with DFO and
DFX, respectively), a LIC of 3.5 and 4.5 mg/g d.w. was reported 6
months before the OGTT and, in the same group B, a MRI myocardial T2*
< 20 ms was reported in 1 male and 1 female patient (18,8 and 18.5
ms, respectively) 8 months before OGTT; both were on treatment with
DFO). The OGTT in the 4 patients showed an NGT in 2 and an IGT and 1-h
PG > 155 mg/dL in the remaining two patients.
A detailed report
of PG and insulin levels and the surrogate β-cell function indices of
the two groups of patients compared to controls are shown in table 2.
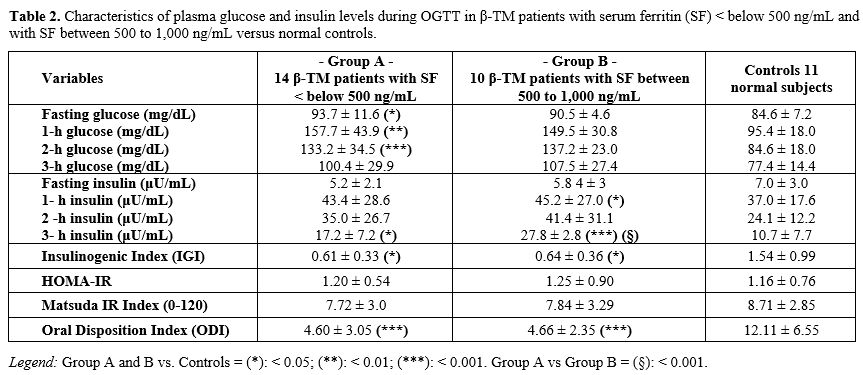 |
- Table
2. Characteristics of plasma glucose and insulin levels during OGTT in
β-TM patients with serum ferritin (SF) < below 500 ng/mL and with SF
between 500 to 1,000 ng/mL versus normal controls.
|
c. Correlations.
Pearson's test revealed no statistically significant correlation
between SF and LIC, myocardial T2* and LIC, age, and myocardial T2*, PG
at baseline and at 2-h during OGTT, and myocardial T2*, IGI and oDI
versus myocardial T2*. A weak but not significant inverse correlation
was found between SF and myocardial T2* (r: - 0.381; P: 0.066) and a
positive correlation between myocardial T2* and LIC (r: 0.4161; P:
0.043). A similar finding was reported by Dissanayake et al. in
patients with transfusion dependent β-thalassaemia.[25]
d. Growth and associated endocrine complications.
Short stature (< 3rd centile) was observed in 11/24 (45.8%) of
patients; 7 in Group A (3 males and 4 females; 50%) and 4 in Group B (2
males and 2 females; 40%). The mean IGF-1 levels in the two groups
were: 59.6 ± 28.5 and 81.4 ± 32.5 ng/mL (P: 0.27), respectively. Only
seven patients (3 of Group A and 4 of Group B) had IGF-1 above the
2.5th percentile of the normal values for the Italian population.[26]
Associated
hypogonadotropic hypogonadism (HH) was the most common endocrine
complication in both groups. Interestingly, after a full pubertal
development, an acquired HH was reported in 5 females and 2 males of
Group A (35.7%) and 3 females of Group B (30%). All but four were on
hormone replacement therapy with sex steroids.
e. Survey during chelation therapy.
No previous serious adverse events were reported in patients with a SF
level < 500 ng/mL. An adjustment of iron chelating dose of
monotherapy with DFO was done in one male and with DFP in one female
patient (SF: 229 and 303 ng/mL, respectively), and a temporarily
interruption in one male patient on monotherapy with DFO (SF:180
ng/mL).
Discussion
The
recommended treatment for β-TM is lifelong regular blood transfusions
(TDT) supplemented by iron chelation at the earliest time. IOL is
inevitable as humans lack mechanisms to excrete the excess iron input
accumulated via transfusions. Iron accumulation is toxic to many
tissues, such as the liver, heart, pancreas and endocrine glands,
causing dysfunction of organs and multiple complications. A significant
association between persistently elevated SF levels and endocrine
glands dysfunction has been documented; in particular, a 14-fold
increased risk of diabetes has been reported in β-TM patient
populations with a median age of 20.7 years.[27]
ICT
aims to balance the increased rate of iron input of blood transfusions
by increasing iron excretion in urine and /or stools with effective
chelating drugs. This requires a profound commitment from patients and
parents to iron chelation protocols and recommendations to monitor
efficiency and unwanted side effects for the individual patient.
SF
levels >1,000 ng/mL are indicators of iron overload and are more
frequently associated with iron-mediated tissue damage. Although SF is
considered a reliable surrogate marker for total body iron load in β-TM
patients, its elevation may also reflect other conditions not strictly
linked to iron metabolisms, such as inflammation, liver damage, and
steatohepatitis.[27]The average SF levels in healthy individuals range from 12 to 300 ng/mL in men and from 12 to 150 ng/mL in women.[27]
Increased SF concentrations (> 300 ng/mL for men and > 200 ng/mL
for women) in non-pathologic conditions, reflecting subclinical IOL,
have been reported to be associated with insulin resistance (IR) and an
increased risk of type 2 diabetes.[28,29]
It has
been shown that "normalizing" iron stores in β-TM patients, in the
absence of chelator-mediated toxicity, prevents new morbidities and
reverses many complications, such as cardiac failure, hypothyroidism,
hypogonadism, and GD.[30] In general, chelation
therapy's unwanted effects are more likely at high chelator doses and
low levels of iron overload (SF levels < 500 ng/mL).[31]
The
present retrospective study was conducted to investigate glucose
homeostasis in depth during OGTT in a selected group of β-TM patients
with SF <1,000 ng/mL, classified in two groups: SF <500 ng/dL
Group A:N = 14) and SF between 500–1,000 ng/mL (Group B:N = 10). We
used a 3-h OGTT and insulin level estimation to assess glucose
tolerance status and β- pancreatic islet-cell hormone secretory
response simultaneously. No patient had fasting glucose or OGTT levels
consistent with the diagnosis of diabetes, according to the ADA
criteria. However, a GD was disclosed in 15/24 (62.5 %) patients; 10 of
Group A (71,6%) and 5 of group B (50%) (P: 0.29).
Interestingly,
but not easily explained, the mean age in months at starting iron
chelation therapy and the mean peak of SF were statistically higher in
Group A compared to Group B. Unfortunately, the data on pancreatic IOL,
assessed by MRI, were unavailable in our patients. In Spasiano et al.
report,[32] no patient with an SF < 500 ng/mL had
significant myocardial IOL, but pancreatic IOL was present in all but
one patient. No significant liver and myocardial IOL, assessed by MRI,
was also detected in our 14 patients of Group A with SF < 500 ng/mL.
In Group B, 2/10 patients had mildly increased LIC, and heart iron
overload. It is also of interest that in Spasiano's paper,[32] patients with SF <500 ng/mL had a higher prevalence of diabetes and started chelation at the most advanced age.
Speculating
on the findings of our study, early deposition of iron in the first
years of life may have induced permanent organ damage and/or the
available iron chelating agents used to treat IOL were not effective
enough to remove iron deposition from the pancreas; a more aggressive
ICT would have been necessary to remove pancreatic iron deposits in
patients with severe IOL (assessed in our patients by SF peak).
The data of Farmaki et al.[32]
support the latter hypothesis. After 5–7 years of intensive combined
ICT with DFO and DFP (SF at baseline: 3421.6 ± 882.0 ng/mL), the
proportion of β-TM patients with glucose metabolism abnormalities
declined from 78% to 34%. A significant increase in insulin secretion
and sensitivity was also observed. At the end of the study, the mean
age for their patients was 32.9 ± 9.8 years and the mean SF was 87 ± 25
ng/mL. Moreover, in 18 β-TM patients requiring L-thyroxine for
hypothyroidism, 10 patients discontinued treatment, and 4 reduced
L-thyroxine dose. In 14 hypogonadal males on testosterone therapy, 7
stopped treatment. Of the 19 females, who were hypogonadal on DFO
monotherapy, six were able to conceive after combination therapy.
These
results have not been replicated in other studies. Although these are
very interesting, it should be kept in mind that, l there is marked
intra-individual variability in reproducibility of the OGTT results in
patients with TM as with other diseases.[33] In addition, the lack of long-term follow-up data urges further caution in interpretation of these results.
Although
iron deposition in the pancreatic parenchyma seems to play a major role
in the onset of diabetes, no link has been shown between the
development of the disease and SF level in long-term chelated patients.
This indicates that additional factors may also be involved in the
development of GD. Chronic hepatitis C, common in older β-TM patients,
may also play a role in the pathogenesis of abnormal glucose tolerance.[34]
Moreover, we can also speculate that zinc (Zn) deficiency, encountered
frequently in β-TM patients, might lead to an exacerbation of the
inability of the pancreas to secrete sufficient amounts of insulin in
response to glucose stimulation.[34] Zn is a potent
physiological regulator of insulin signal transduction through its
inhibitory effect on protein tyrosine phosphatase 1b, the key
phosphatase that dephosphorylates the insulin receptor.[35]
Although the gold standard for assessing insulin secretion and sensitivity is the hyperinsulinemic- euglycemic clamp,[36]
the OGTT provides information about insulin resistance and secretion
assessment both directly and indirectly through surrogate indices, such
as the HOMA-IR, the Matsuda index, and the oDI .
In our patients,
GD was associated with a significantly attenuated IGI (first phase of
insulin response), which is considered the earliest sign of glucose
intolerance and impaired oral disposition index (oDI). The latter index
reflects the relationship between β-cell function (first-phase insulin
secretion) and peripheral insulin sensitivity (hepatic and peripheral
tissue sensitivity to insulin). These indices may provide an evaluation
of pancreatic β-cell function adjusted for insulin sensitivity that may
represent a predictive value for glucose deterioration.[19]
The
additional novel parameters were used to evaluate insulin secretion and
resistance. Such indices included time to peak glucose, shape of the
glucose curve, and 1h-PG ≥ 155mg/dL.
In individuals with and without diabetes[37] or IFG,[38]
delayed nadir during post-load glucose level indicates a higher insulin
resistance combined with a reduction in insulin secretion, while those
individuals with longer time to peak glucose have a greater likelihood
of diabetes; subjects with a monophasic response curve tend to have
impaired insulin sensitivity and β-cell function, and have higher risk
for the development of type 2 diabetes compared to those with a
biphasic response curve;[39,40] in addition, 1h-PG ≥ 155mg/dL is predictive for detecting progression to type 2 diabetes.[41]
However,
to improve evidence in this area, more studies are needed in β-TM
patients to provide data on long-term follow-up and for evaluating risk
of diabetes in the future.
The mechanisms underlying biochemical
hypoglycemia remain undefined, potentially being a manifestation of
islet dysfunction and an inadequate counter-regulatory response.
We
are aware of the limitations of our study, particularly that of small
sample size. However, our findings can generate hypotheses, warrant
larger studies, and encourage further research. Our next step is to
evaluate the progression of glucose abnormalities longitudinally in
this group of TDT patients, representing the majority of adult TDT
patients, and to address the long-term effects of ICT.
Conclusions
Our
study showed that effective iron chelation monotherapy in patients with
β-TM with SF < 1,000 ng/ml and even < 500 ng/mL did not entirely
prevent glucose metabolism disorders and the development of acquired
hypogonadism. Certain tissues are more susceptible to excess iron
loading (liver>pituitary>pancreas>heart), and iron toxicity
and iron toxicity may have already started in early childhood in
patients receiving suboptimal ICT.[30,34]
Serum
ferritin < 1,000 ng/ml is traditionally regarded as a marker of no
significant iron overload. However, the majority of β-TM patients with
this level have some form of GD and a large proportion have
hypogonadotropic hypogonadism. Detailed analysis of OGTT results
suggests reduced insulin secretory capacity as the main cause of GD
after the second decade of life. Further studies are warranted to
explore the potential predictive role of the shape of glucose curve /
the time of glucose peak / the development of late hypoglycemia in
glucose regulation and whether performing OGTT with longer duration and
samples at more time points would add valuable clinical information.
Extending the duration of OGTT beyond the standard clinical 2-h OGTT
may be useful to evaluate subjects with delayed hypoglycemia. Prompt
intervention at early stages is essential to avert progression to
prediabetes and diabetes in high-risk individuals.[42]
Adequate
assessment and monitoring of IOL, based on tailored ICT, is crucial for
preventing these complications. Identifying the earliest moment in
which to intervene to avert the progression to prediabetes and diabetes
in high-risk individuals is a substantial challenge. The present
recommendation to interrupt chelation therapy when the SF level is
below 1,000 ng/mL[43] should be revised. Recent
studies recommend a SF near to "normality". To avoid over-chelation,
IOL should be appropriately managed and closely monitored, ideally in
specialized thalassemia centers.
References
- Kattamis A, Kwiatkowski JL,
Aydinok Y. Thalassaemia. Lancet. 2022;399(10343):2310-2324. doi:
10.1016/S0140-6736(22)00536-0. https://doi.org/10.1016/S0140-6736(22)00536-0
PMid:35691301
- Ali
S, Mumtaz S, Shakir HA, Khan M, Tahir HM, Mumtaz S, Mughal TA, Hassan
A, Kazmi SAR, Sadia, Irfan M, Khan MA. Current status of
beta-thalassemia and its treatment strategies. Mol Genet Genomic Med.
2021;9(12):e1788. doi: 10.1002/mgg3.1788. https://doi.org/10.1002/mgg3.1788
PMid:34738740 PMCid:PMC8683628
- Carsote
M, Vasiliu C, Trandafir AI, Albu SE, Dumitrascu MC, Popa A, Mehedintu
C, Petca RC, Petca A, Sandru F. New Entity-Thalassemic Endocrine
Disease: Major Beta-Thalassemia and Endocrine Involvement. Diagnostics
(Basel). 2022;12(8):1921. doi: 10.3390/diagnostics12081921. https://doi.org/10.3390/diagnostics12081921
PMid:36010271 PMCid:PMC9406368
- Sevimli
C, Yilmaz Y, Bayramoglu Z, Comert RG, Gul N, Dursun M, Karakas Z.
Pancreatic MR imaging and endocrine complications in patients with
beta-thalassemia: a single-center experience. Clin Exp Med.
2022;22(1):95-101. doi: 10.1007/s10238-021-00735-7. https://doi.org/10.1007/s10238-021-00735-7
PMid:34245399
- Reddy
PS, Locke M, Badawy SM. A systematic review of adherence to iron
chelation therapy among children and adolescents with thalassemia. Ann
Med. 2022 ;54(1):326-342. doi: 10.1080/ 07853890. 2022. 2028894. https://doi.org/10.1080/07853890.2022.2028894
PMid:35103514 PMCid:PMC8812788
- Wahidiyat
PA, Yosia M, Sari TT. Comparison of Deferiprone to Deferasirox and
Deferoxamine to Cardiac and Hepatic T2* MRI in Thalassemia Patients:
Evidence-based Case Report. Acta Med Indones. 2018;50(2):168-176. PMID:
29950538.
- Spasiano
A, Meloni A, Costantini S, Quaia E, Cademartiri F, Cinque P, Pepe A,
Ricchi P. Setting for "Normal" Serum Ferritin Levels in Patients with
Transfusion-Dependent Thalassemia: Our Current Strategy. J Clin Med.
2021;10(24):5985. doi: 10.3390/jcm10245985. https://doi.org/10.3390/jcm10245985
PMid:34945281 PMCid:PMC8708030
- American
Diabetes Association. Classification and Diagnosis of Diabetes:
Standards of Medical Care in Diabetes - 2020. Diabetes Care. 2020;
43(Suppl.1): S14-S31. https://doi.org/10.2337/dc20-S002
PMid:31862745
- WHO
Multicentre Growth Reference Study Group . WHO child growth standards:
Length/height-for-age, weight-for-age, weight-for-length,
weight-forheight and body mass index-for-age: Methods and development.
WHO Child Growth Standards. [Internet]. 2006;52:13-17.
- De
Sanctis V, Soliman AT, Elsedfy H, Skordis N, Kattamis C, Angastiniotis
M, Karimi M, Yassin MA, El Awwa A, Stoeva I, Raiola G, Galati MC,
Bedair EM, Fiscina B, El Kholy M. Growth and endocrine disorders in
thalassemia: The international network on endocrine complications in
thalassemia (I-CET) position statement and guidelines. Indian J
Endocrinol Metab. 2013;17(1):8-18. doi: 10.4103/2230-8210. 107808. https://doi.org/10.4103/2230-8210.107808
PMid:23776848 PMCid:PMC3659911
- WHO.
Physical status: the use and interpretation of anthropometry. Report of
a WHO Expert Committee. World Health Organ Tech Rep Ser.
1995;854:1-452. PMID: 8594834..
- Kasim
N, Khare S, Sandouk Z, Chan C. Impaired glucose tolerance and
indeterminate glycemia in cystic fibrosis. J Clin Transl Endocrinol.
2021;26:100275. doi: 10.1016/j.jcte.2021.100275.
https://doi.org/10.1016/j.jcte.2021.100275
PMid:34868882 PMCid:PMC8626567
- Tschritter
O, Fritsche A, Shirkavand F, Machicao F, Häring H, Stumvoll M.
Assessing the shape of the glucose curve during an oral glucose
tolerance test. Diabetes Care. 2003;26(4):1026-1033. doi:
10.2337/diacare.26.4.1026. https://doi.org/10.2337/diacare.26.4.1026
PMid:12663568
- Cai
X, Han X, Zhou X, Zhou L, Zhang S, Ji L. Associated Factors with
Biochemical Hypoglycemia during an Oral Glucose Tolerance Test in a
Chinese Population. J Diabetes Res. 2017;2017:3212814. doi:
10.1155/2017/3212814. https://doi.org/10.1155/2017/3212814
PMid:28913363 PMCid:PMC5585643
- De
Sanctis V, Gamberini MR, Borgatti L, Atti G, Vullo C, Bagni B. Alpha
and beta cell evaluation in patients with thalassaemia intermedia and
iron overload. Postgrad Med J. 1985;61(721):963-7. doi:
10.1136/pgmj.61.721.963. https://doi.org/10.1136/pgmj.61.721.963
PMid:3906615 PMCid:PMC2418482
- Goedecke
JH, Dave JA, Faulenbach MV, Utzschneider KM, Lambert EV, West S,
Collins M, Olsson T, Walker BR, Seckl JR, Kahn SE, Levitt NS. Insulin
response in relation to insulin sensitivity: an appropriate beta-cell
response in black South African women. Diabetes Care.
2009;32(5):860-5.doi: 10.2337/dc08-2048. https://doi.org/10.2337/dc08-2048
PMid:19196884 PMCid:PMC2671086
- Matsuda
M, DeFronzo RA. Insulin sensitivity indices obtained from oral glucose
tolerance testing: comparison with the euglycemic insulin clamp.
Diabetes Care. 1999;22(9):1462-70. doi: 10.2337/ diacare. 22.9.1462.
https://doi.org/10.2337/diacare.22.9.1462
PMid:10480510
- Matthews
DR, Hosker JP, Rudenski AS, Naylor BA, Treacher DF, Turner RC.
Homeostasis model assessment: insulin resistance and beta-cell function
from fasting plasma glucose and insulin concentrations in man.
Diabetologia. 1985;28(7):412-9. doi:10.1007/BF00280883. https://doi.org/10.1007/BF00280883
PMid:3899825
- Utzschneider
KM, Prigeon RL, Faulenbach MV, Tong J, Carr DB, Boyko EJ, Leonetti DL,
McNeely MJ, Fujimoto WY, Kahn SE. Oral disposition index predicts the
development of future diabetes above and beyond fasting and 2-h glucose
levels. Diabetes Care. 2009;32(2):335-41.doi: 10.2337/dc08-1478. https://doi.org/10.2337/dc08-1478
PMid:18957530 PMCid:PMC2628704
- Taher
AT, Porter J, Viprakasit V, Kattamis A, Chuncharunee S, Sutcharitchan
P, Siritanaratkul N, Galanello R, Karakas Z, Lawniczek T, Ros J, Zhang
Y, Habr D, Cappellini MD. Deferasirox reduces iron overload
significantly in nontransfusion-dependent thalassemia: 1-year results
from a prospective, randomized, double-blind, placebo-controlled study.
Blood. 2012;120(5):970-7. doi: 10.1182/blood-2012-02-412692. https://doi.org/10.1182/blood-2012-02-412692
PMid:22589472
- Brittenham
GM, Farrell DE, Harris JW, Feldman ES, Danish EH, Muir WA, Tripp JH,
Bellon EM. Magnetic-susceptibility measurement of human iron stores. N
Engl J Med.1982;307(27):1671-5. doi: 10.1056/NEJM198212303072703. https://doi.org/10.1056/NEJM198212303072703
PMid:7144866
- Pepe
A, Meloni A, Rossi G, Midiri M, Missere M, Valeri G, Sorrentino F,
D'Ascola DG, Spasiano A, Filosa A, Cuccia L, Dello Iacono N, Forni G,
Caruso V, Maggio A, Pitrolo L, Peluso A, De Marchi D, Positano V, Wood
JC. Prediction of cardiac complications for thalassemia major in the
widespread cardiac magnetic resonance era: a prospective multicentre
study by a multi-parametric approach. Eur Heart J Cardiovasc Imaging.
2018;19(3):299-309. doi: 10.1093/ehjci/jex012. https://doi.org/10.1093/ehjci/jex012
PMid:28200076
- Alder
R, Roesser EB. Introduction to probability and statistics. WH Freeman
and Company Eds. Sixth Edition. San Francisco (USA), 1975.
- Farmakis
D, Porter J, Taher A, Domenica Cappellini M, Angastiniotis M,
Eleftheriou A. 2021 Thalassaemia International Federation Guidelines
for the Management of Transfusion-dependent Thalassemia. Hemasphere.
2022;6(8):e732. doi: 10.1097/HS9.0000000000000732. https://doi.org/10.1097/HS9.0000000000000732
PMid:35928543 PMCid:PMC9345633
- Dissanayake
R, Samarasinghe N, Waidyanatha S, Pathirana S, Neththikumara N,
Dissanayake VHW, Wetthasinghe K, Gooneratne L, Wickramasinghe P.
Assessment of iron overload in a cohort of Sri Lankan patients with
transfusion dependent beta thalassaemia and its correlation with
pathogenic variants in HBB, HFE, SLC40A1, and TFR2 genes. BMC Pediatr.
2022;22(1):344. doi: 10.1186/s12887-022-03191-8. https://doi.org/10.1186/s12887-022-03191-8
PMid:35705926 PMCid:PMC9199146
- Aimaretti
G, Boschetti M, Corneli G, Gasco V, Valle D, Borsotti M, Rossi A,
Barreca A, Fazzuoli L, Ferone D, Ghigo E, Minuto F. Normal
age-dependent values of serum insulin growth factor-I: results from a
healthy Italian population. J Endocrinol Invest. 2008;31:445-449. doi:
10.1007/BF03346389. https://doi.org/10.1007/BF03346389
PMid:18560263
- Shah
F, Huey K, Deshpande S, Turner M, Chitnis M, Schiller E, Yucel A, Moro
Bueno L, Oliva EN. Relationship between Serum Ferritin and Outcomes in
β-Thalassemia: A Systematic Literature Review. J Clin Med. 2022
;11(15):4448. doi: 10.3390/jcm11154448. https://doi.org/10.3390/jcm11154448
PMid:35956067 PMCid:PMC9369259
- Aguirre
LG, Urrunaga-Pastor D, Moncada-Mapelli E, Guarnizo-Poma M,
Lazaro-Alcantara H, Benites-Zapata VA; Insulin Resistance and Metabolic
Syndrome Research Group. High serum ferritin levels are associated with
insulin resistance but not with impaired glucose tolerance in a healthy
people population. Diabetes Metab Syndr. 2017;11 Suppl 2:S983-S988.
doi: 10.1016/j.dsx.2017.07.026. https://doi.org/10.1016/j.dsx.2017.07.026
PMid:28755842
- Kim
CH, Kim HK, Bae SJ, Park JY, Lee KU. Association of elevated serum
ferritin concentration with insulin resistance and impaired glucose
metabolism in Korean men and women. Metabolism. 2011 Mar;60(3):414-420.
doi: 10.1016/j.metabol.2010.03.007. https://doi.org/10.1016/j.metabol.2010.03.007
PMid:20423745
- Berdoukas
V, Farmaki K, Wood JC, Coates T. Iron chelation in thalassemia: time to
reconsider our comfort zones. Expert Rev Hematol. 2011;4(1):17-26. doi:
10.1586/ehm.10.74. https://doi.org/10.1586/ehm.10.74
PMid:21322775
- Cheesman
S, Shah R, Trompeter S, Eleftheriou P, Hylton B, Garbowski MW, Porter
J. Real-World Experience of Switching from Deferasirox Dispersible to
Film-Coated Tablets: Impact on Adherence to Chelation Therapy, Iron
Overload and Renal Function. Blood. 2018;132 (Supplement 1):1062-1062.
doi.org/10.1182/blood-2018-99-119030. https://doi.org/10.1182/blood-2018-99-119030
- Farmaki
K, Tzoumari I, Pappa C, Chouliaras G, Berdoukas V. Normalisation of
total body iron load with very intensive combined chelation reverses
cardiac and endocrine complications of thalassaemia major. Br J
Haematol. 2010;148(3):466-475. doi: 10.1111/j.1365-2141.2009.07970.x. https://doi.org/10.1111/j.1365-2141.2009.07970.x
PMid:19912219
- De
Sanctis V, Daar S, Soliman AT, Tzoulis P, Karimi M, Kattamis C. The
evolution of glucose-insulin homeostasis in children with β-thalassemia
major (β -TM): A twenty-year retrospective ICET- A observational
analysis from early childhood to young adulthood. Acta Biomed. 2022 Jul
1;93(3):e2022243. doi: 10.23750/abm.v93i3.12643. https://doi.org/10.1530/endoabs.81.EP278
- De
Sanctis V, Soliman A, Tzoulis P, Daar S, Fiscina B, Kattamis C. The
Pancreatic changes affecting glucose homeostasis in transfusion
dependent β- thalassemia (TDT): a short review. Acta Biomed. 2021;92
(3):e2021232. doi: 10.23750/abm.v92i3.11685.
- Himoto
T, Masaki T. Associations between Zinc Deficiency and Metabolic
Abnormalities in Patients with Chronic Liver Disease. Nutrients.
2018;10(1):88.doi: 10.3390/nu10010088. https://doi.org/10.3390/nu10010088
PMid:29342898 PMCid:PMC5793316
- DeFronzo
RA, Tobin JD, Andres R. Glucose clamp technique: a method for
quantifying insulin secretion and resistance. Am J Physiol.
1979;237(3):E214-23. doi: 10.1152/ajpendo.1979.237.3.E214. https://doi.org/10.1152/ajpendo.1979.237.3.E214
PMid:382871
- Kramer
CK, Vuksan V, Choi H, Zinman B, Retnakaran R. Emerging parameters of
the insulin and glucose response on the oral glucose tolerance test:
reproducibility and implications for glucose homeostasis in individuals
with and without diabetes. Diabetes Res Clin Pract. 2014;105(1):88-95.
doi: 10.1016/ j. diabres.2014.04.023. https://doi.org/10.1016/j.diabres.2014.04.023
PMid:24842248
- Lin
YC, Chen HS. Longer time to peak glucose during the oral glucose
tolerance test increases cardiovascular risk score and diabetes
prevalence. PLoS ONE, 2017: 12(12): e0189047. doi: 10.1371/
journal.pone.0189047. https://doi.org/10.1371/journal.pone.0189047
PMid:29216249 PMCid:PMC5720677
- Bervoets
L, Mewis A, Massa G. The shape of the plasma glucose curve during an
oral glucose tolerance test as an indicator of Beta cell function and
insulin sensitivity in end-pubertal obese girls. Horm Metab Res.
2015;47(6):445-51. doi: 10.1055/s-0034-1395551. https://doi.org/10.1055/s-0034-1395551
PMid:25506681
- Tura
A, Morbiducci U, Sbrignadello S, Winhofer Y, Pacini G, Kautzky-Willer
A. Shape of glucose, insulin, C-peptide curves during a 3-h oral
glucose tolerance test: any relationship with the degree of glucose
tolerance? Am J Physiol Regul Integr Comp Physiol. 2011;300(4):R941-8.
doi: 10.1152/ajpregu.00650.2010. https://doi.org/10.1152/ajpregu.00650.2010
PMid:21248305
- Bergman
M, Manco M, Sesti G, Dankner R, Pareek M, Jagannathan R, Chetrit A,
Abdul-Ghani M, Buysschaert M, Olsen MH, Nilsson PM, Medina JL, Roth J,
Groop L, Del Prato S, Raz I, Ceriello A. Petition to replace current
OGTT criteria for diagnosing prediabetes with the 1-hour post-load
plasma glucose ≥ 155 mg/dl (8.6 mmol/L). Diabetes Res Clin Pract.
2018;146:18-33. doi: 10.1016/j. diabres. 2018.09.017. https://doi.org/10.1016/j.diabres.2018.09.017
PMid:30273707
- De
Sanctis V., Soliman A.T., Tzoulis P., Daar S., Di Maio S., Fiscina B.,
Kattamis C.Glucose metabolism and insulin response to oral glucose
tolerance test (OGTT) in prepubertal patients with
transfusion-dependent β-thalassemia (TDT): A long-term retrospective
analysis.Mediterr J Hematol Infect Dis 2021, 13(1): e2021051, https://doi.org/10.4084/MJHID.2021.051 PMid:34527203 PMCid:PMC8425353
- Taher
AT, Musallam KM, Cappellini MD. β-Thalassemias. N Engl J Med.
2021;384(8):727-743. doi: 10.1056/NEJMra2021838. https://doi.org/10.1056/NEJMra2021838
PMid:33626255