Fengming Xu1,2,*, Cheng Tang1,2,*, Yiling Huang1,2, Linlin Liang1,2, Fuling Huang1,2, Gaohui Yang2,3, Peng Peng1,2.
1 Department
of Radiology, The First Affiliated Hospital of Guangxi Medical
University, Nanning, 530021, Guangxi Zhuang Autonomous Region, China.
2 NHC
Key Laboratory of Thalassemia Medicine (Guangxi Medical University),
Guangxi Zhuang Autonomous Region, People’s Republic of China.
3 Department
of Hematology, The First Affiliated Hospital of Guangxi Medical
University, Nanning, 530021, Guangxi Zhuang Autonomous Region, China.
* These authors have contributed equally to this work and share the first authorship.
Published: March 1, 2023
Received: November 3, 2022
Accepted: February 19, 2023
Mediterr J Hematol Infect Dis 2023, 15(1): e2023020 DOI
10.4084/MJHID.2023.020
This is an Open Access article distributed
under the terms of the Creative Commons Attribution License
(https://creativecommons.org/licenses/by-nc/4.0),
which permits unrestricted use, distribution, and reproduction in any
medium, provided the original work is properly cited.
|
|
Abstract
Background: To explore the feasibility and accuracy of liver iron deposition based on dual-energy CT in thalassemia patients.
Materials and methods:
105 thalassemia patients were examined with dual-energy CT and MR liver
scanning. Dual-energy CT was performed to measure CT values on 80kVp,
140kVp, and virtual iron content (VIC) imaging; ΔH was figured out by
the difference in CT values between 80kVp and 140kVp. Using the liver
iron concentration (LIC) obtained by FerriScan as a gold standard, the
correlation between CT measurements and LIC was evaluated. Receiver
operating characteristic (ROC) analysis was used to evaluate the
diagnostic performance for dual-energy CT in liver iron quantification
and stratification.
Results:
The correlation analysis between CT measurements and LIC showed that
80kVp, 140kVp, VIC, and ΔH all had a high positive correlation with LIC
(P<0.001). The correlation analysis among different degree groups of
VIC, ΔH, and LIC showed that the normal, moderate, and severe groups of
VIC and ΔH had moderate or high positive correlations with that of LIC
(P<0.01), but the mild group had no correlation (P>0.05). ROC
analysis revealed that the corresponding optimal cutoff value of VIC
was -2.8, 6.3,11.9 HU (corresponds to 3.2,7.0,15.0 mg/g dry weight)
respectively, while the ΔH were 5.1, 8.4, 17.8HU, respectively. The
area under the receiver operating characteristic curves (AUCs) for both
VIC and ΔH increased with LIC thresholds.
Conclusion:
Dual-energy CT can accurately quantify and stratify liver iron
deposition, contributing to predicting the status of liver iron
deposition in thalassemia patients.
|
Introduction
Thalassemia
is a group of inherited blood disorders characterized by a decrease or
absence of one or more globin chains; it is the most common monogenic
disease in the world.[1,2] According to the severity
of the disease, thalassemia is classified into mild, moderate, and
severe thalassemia. Mild thalassemia usually does not require
treatment, but moderate and severe thalassemia require regular blood
transfusion and iron chelation therapy.[1] The
compensatory enhancement of bone marrow hematopoietic function and
intestinal iron absorption in thalassemia patients are significantly
increased. Furthermore, blood transfusion further increases the iron
deposition in the liver, heart, and endocrine organs, ultimately
resulting in organ dysfunction.[3-5]
The liver is the main storage site of iron during iron overload, accounting for about 70% of the total body iron.[5]
Studies have shown that hepatic iron overload is an independent factor
causing liver damage, which progresses to hepatocyte degeneration,
cirrhosis, and hepatocellular cancer.[4-6] Patients with elevated liver iron content (LIC) are at high risk of early death.[1,3] So, treating thalassemia requires a combination with iron chelation therapy.[7]
The lower, upper, and intensive LIC thresholds in clinical iron
chelation therapy were 3.2, 7.0, and 15.0 mg iron per gram of dry
tissue, respectively.[5,8,9]
Therefore, the accurate quantitation of liver iron content is
significant for evaluating the severity of the disease and formulating
the iron chelation therapy plan.[10]
Percutaneous liver biopsy (PLB) is the gold reference standard for determining liver iron concentration.[10] However, it is invasive and has high sampling variability, making it unsuitable for repeated use.[10] Non-invasive methods, such as magnetic resonance imaging (MRI) and dual-energy computed tomography (CT), are available.[8-12]
FerriScan (Resonance Health & Resonance Health Analysis Services,
Claremont, Australia) is a commercially available MR imaging-based R2
technique that accurately and effectively quantifies LIC. FerriScan was
approved by the US Food and Drug Administration.[12-13] However, this technology also has many limiting problems:[15]
MRI data of patients need to be sent to FerriScan for off-site
post-processing and analysis. Sending patient data to another location
requires approval from the relevant center, and the time cost required
will prolong the time to obtain LIC results. Additional analysis costs
will also increase the cost of LIC monitoring. This has resulted in
liver iron quantification using FerriScan technology being limited to a
few large medical centers. More importantly, this technology can
quantify the upper limit of LIC is 43mg/g dry weight.
With the
development of new techniques in CT, dual-energy CT has made great
progress in quantifying liver iron content. CT is helpful for
quantifying liver iron overload and may solve the problem that MRI
cannot measure extremely severe liver iron overload. Dual-energy CT
differential method (ΔH method) and the three-material decomposition
algorithm (overlay method) are the two main measurement methods in
dual-energy CT.[16,17] A previously performed phantom
study by Fischer et al. showed that three material decomposition
algorithms could specifically reflect the liver iron content and
obtained iron-specific algorithm-based virtual iron content (VIC)
images with dual-energy analysis.[18] Some previous
studies also showed that dual-energy CT could accurately quantify
clinically important hepatic iron accumulation.[19]
However, according to the commonly used classification system of liver
iron accumulation, there are few studies on the classification of liver
iron accumulation by dual-energy analysis. Further research and
confirmation are needed on quantifying and stratifying liver iron
deposition by Dual-energy CT.
Thus, the purpose of our study was
to adopt dual-energy CT for evaluating the liver iron content in
thalassemia patients and compare it with MRI, explore the
quantification and stratification of liver iron deposition based on
dual-energy CT, and find a non-invasive and simple method for liver
iron quantification.
Materials and Methods
Number of Patients.
This retrospective study was approved by the institutional review board
(2022-E364-01). Informed consent was obtained from all patients. One
hundred-five thalassemia patients were included from August 2013 to
April 2015. Inclusion criteria: patients with a genetic diagnosis of
moderate thalassemia or severe thalassemia, transfusion-dependent; age
≥ 5 years; a history of transfusion with at least 10 units of red blood
cells (1 unit = 200mL red blood cells) before the examination; have
received irregular or regular iron chelation therapy or requiring iron
chelation therapy. Exclusion criteria: patients who could not sign
informed consent or refused to perform CT or MR examination, had
claustrophobia syndrome or were equipped with pacemakers, ferromagnetic
metal implants, or others if were regarded unsafe for MRI examination.
CT Acquisition.
All CT examinations were performed using the same 128-slice dual-energy
CT scanner (Somatom Definition Flash, Siemens Healthcare, Forchheim,
Germany). The scan range was from the diaphragm to the lower edge of
the liver, including the entire liver. The examination procedure used
dual-energy (DE, 80 and 140kVp) with a tin filter to improve the
separation of the two energy spectra. The CARE Dose 4D technique was
used to adjust tube currents automatically. Other CT parameters were as
follows: 64 × 0.6mm and 128 × 0.6mm detector collimation, 150
mAs/rotation, 400 mAs/rotation effective tube currents, 500ms gantry
rotation time, 0.6 pitch, 512 × 512 matrix, 1.5 mm slice thickness, 1
mm increment.
CT data analysis.
VIC imaging was performed at dual-energy analysis using the
three-material decomposition theory. The two groups of reconstructed
images obtained from DECT (DE, 80 and 140kVp) scanning were sent to the
post-processing workstation (Single Dual Energy), and the dual
energy-virtual plain scanning function was selected (Dual Energy- liver
VNC). DECT images were reconstructed using a reconstruction kernel of
D30f with a slice thickness of 1.5 mm and a slice spacing of 1 mm. An
iron-specific slope value of 1.9 was used in the presetting of the
liver VNC algorithm.[19]
The CT values of lipid and liver tissues were set as default. The pixel
component distribution map of the iron element was extracted by
automatic computer calculation and displayed as orange and red
superimposed images of different proportions. The VIC images were
obtained by setting the ratio of overlay to 100%.
In
VIC images regions with uniform density and without intrahepatic blood
vessels and bile ducts was regarded as Region of Interests (ROI). Two
and three ROIs were randomly selected from the left and right hepatic
parenchyma separately, and the size of each was about 3-4cm2; the average value of the five CT values was VIC value.
MR Image Analysis.
All MRI examinations were performed according to the FerriScan's 1.5T
MR (Siemens Avanto 1.5T MR, Siemens Healthcare, Forchheim, Germany)
scanning standard.[15] Liver iron MR imaging data were uploaded to the FerriScan center, and LIC value was obtained through FerriScan.
Statistical analysis.
Statistical analysis was performed using software SPSS 22.0 and MedCalc
v15.8. The Kolmogorov-Smirnov test was used to test the normal
distribution of the parameters. Spearman or Pearson correlation
analysis was used to investigate the relationship between CT
measurements and LIC. FerriScan-LIC was set as a standard of reference
for determining the liver iron deposition grade. The least significant
difference (LSD) test and homogeneity test for variance were used to
compare the differences between any grades of VIC and ΔH. Receiver
operating characteristic (ROC) analysis was used to judge the
thresholds of VIC and ΔH corresponding to each LIC grade. The threshold
was derived from the Youden index, which maximized the sum of
sensitivity and specificity. The area under the ROC curve (AUC) was
calculated for VIC and ΔH. Two paired ROC curves were compared using
the z-test. P<0.05 was considered a statistically significant
difference.
Results
Correlation analysis between CT measurements and LIC in thalassemia patients.
Of the 105 patients, the LIC values measured by MR were higher than
43.0 mg Fe/g dry weight in 3 patients, and no specific value was
reported. The correlation analysis between CT measurements and LIC in
102 thalassemia patients showed that 80kVp, 140kVp, VIC, and ΔH all had
a high positive correlation with LIC (P<0.01), VIC and ΔH had a much
higher positive correlation with LIC, the correlation coefficients were
0.883 and 0.907 (Table 1). The linear regression equations between CT measurements and LIC are shown in Table 2. The scatter plots among VIC, ΔH, and LIC are shown in Figure 1. The images of a patient with VIC, ΔH and LIC are shown in Figure 2.
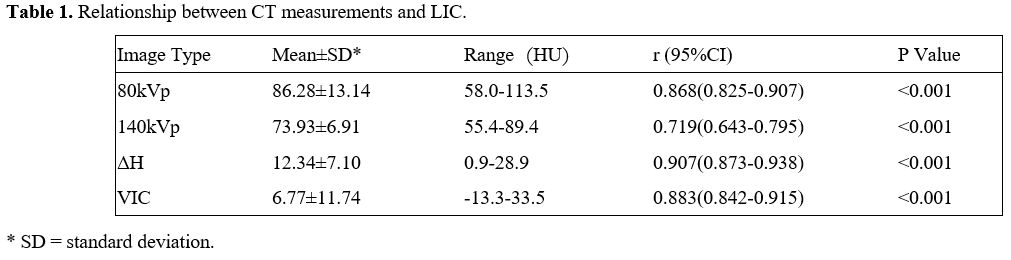 |
Table
1. Relationship between CT measurements and LIC. |
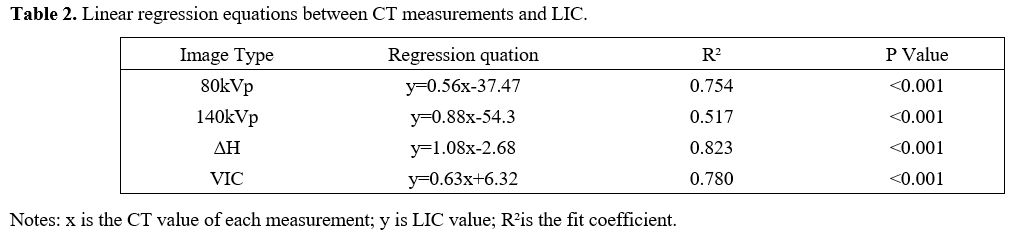 |
Table 2. Linear regression equations between CT measurements and LIC. |
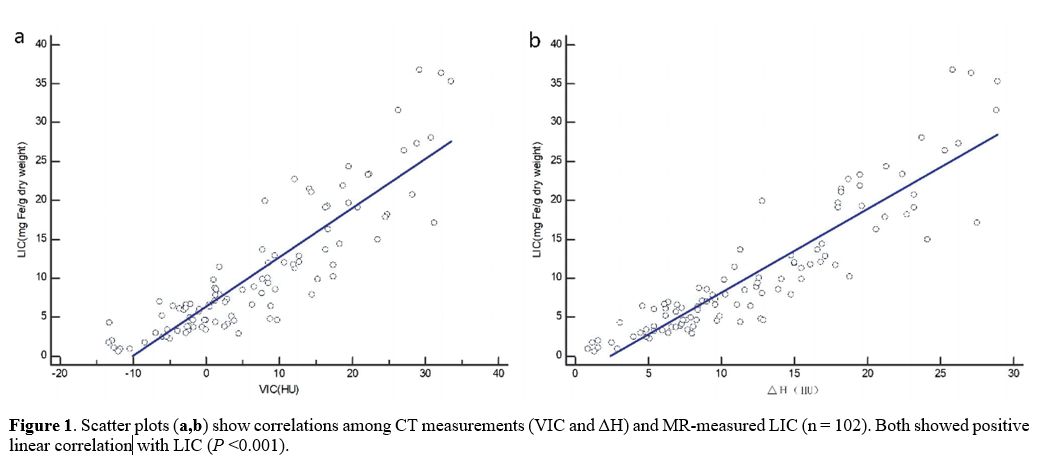 |
Figure
1. Scatter plots (a,b)
show correlations among CT measurements (VIC and ΔH) and MR-measured
LIC (n = 102). Both showed positive linear correlation with LIC (P
<0.001). |
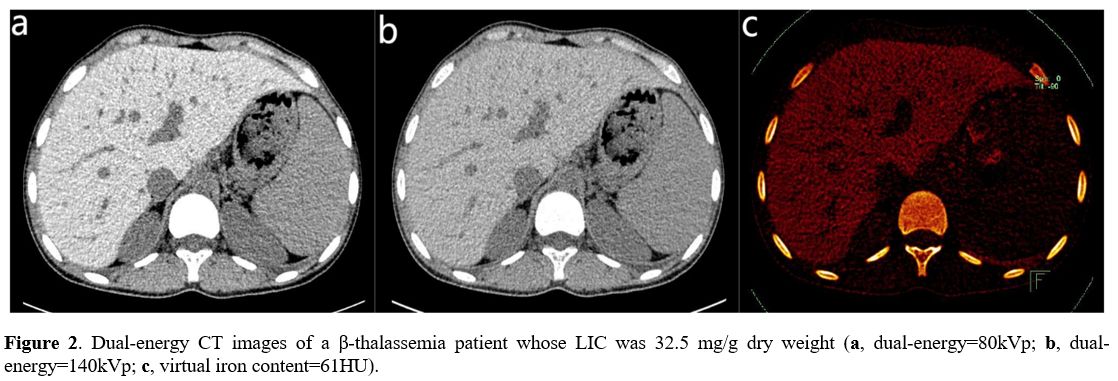 |
Figure
2. Dual-energy CT images of a β-thalassemia patient whose LIC was 32.5
mg/g dry weight (a, dual-energy=80kVp; b, dual-energy=140kVp; c,
virtual iron content=61HU).
|
Correlation analysis among different VIC, ΔH, and LIC degree groups in thalassemia patients.
According to the clinical iron chelation therapy, the thresholds of LIC
lower limit, upper limit, and more intensive therapy are 3.2, 7.0, and
15.0 mg Fe/g dry weight, respectively.[9]
Based on these thresholds and the common grading system, the patients
were divided in four groups: normal (n=13), mild (n=35), moderate
(n=30) and severe (n=24) iron overload groups. The correlation
analysis among different degree groups of VIC, ΔH, and
LIC showed that the normal, moderate, and severe groups of VIC and ΔH
had moderate or high positive correlations with that of LIC (P<0.01), but the mild group had no correlation (P>0.05) (Table 3).
After LSD test and homogeneity test for variance in the four groups of
VIC and ΔH, results showed that the differences between any two groups
had statistical significance (P<0.01) (Table 4).
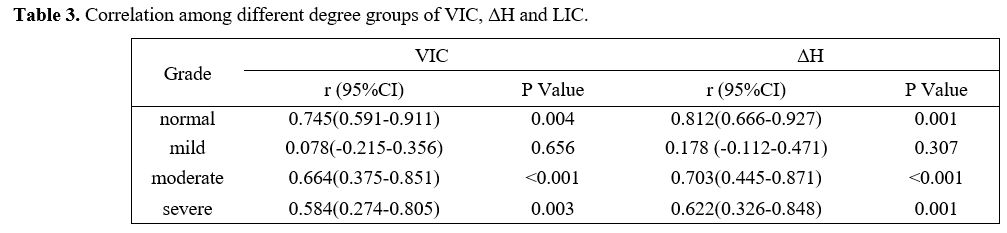 |
Table 3. Correlation among different degree groups of VIC, ΔH and LIC. |
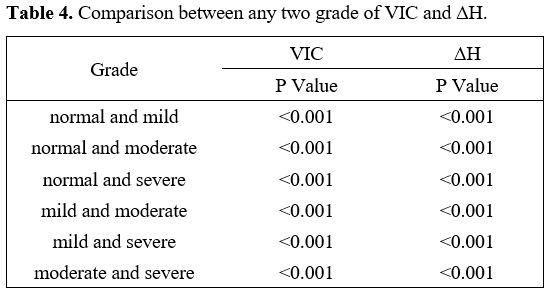 |
Table 4. Comparison between any two grade of VIC and ΔH.
|
Diagnostic performance of grading based on LIC levels in thalassemia patients.
The LIC obtained from FerriScan was set as a reference standard for
determining the liver iron deposition grading. For discriminating
clinically significant LIC thresholds (3.2, 7.0, 15.0 mg Fe/g dry
weight), ROC analysis revealed that the corresponding optimal cutoff
value of VIC were -2.8, 6.3, 11.9 HU, respectively, while the ΔH were
5.1, 8.4, 17.8HU, respectively (Table 5).
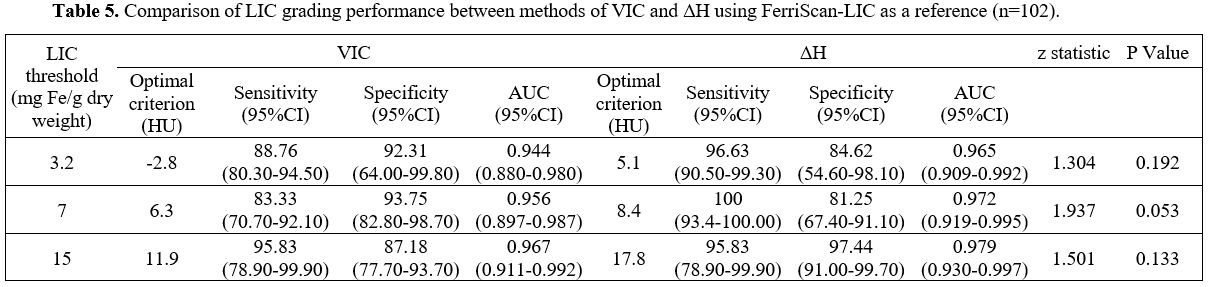 |
- Table 5. Comparison of LIC grading performance between methods of VIC and ΔH using FerriScan-LIC as a reference (n=102).
|
The
AUC values of VIC and ΔH both increased with the increase of LIC
thresholds. The AUC values were all above 0.940. It suggested that VIC
and ΔH have high diagnostic performance for liver iron deposition
grading.
At thresholds of 3.2 and 7.0 mg Fe/g dry weight, VIC
showed sensitivities of 88.76% and 83.33%, respectively, which were
relatively lower than those of ΔH (96.63% and 100%). However, the
specificities of VIC (92.31% and 93.75%) were higher than those of ΔH
(84.62% and 81.25%). At the threshold of 15 mg Fe/g dry weight, VIC and
ΔH both showed sensitivities of 95.83%, and the specificity of ΔH
(97.44%) was higher than that of VIC (87.18%). The comparative analysis
between the AUCs of VIC and ΔH showed no significant difference in all
thresholds. These results indicated that VIC and ΔH have the same
diagnostic performance for the clinical significance of liver iron
deposition grading. Both can accurately quantify and grade liver iron
concentration.
Discussion
An
accurate assessment of the degree of hepatic iron deposition is
essential for the quantitative classification of hepatic iron
deposition and the determination of the need for iron chelation
therapy.[1,8,11] MR is a mature non-invasive detection technology, and Ferriscan-LIC is also an internationally recognized gold standard.[13-15] However, when LIC>43mg/g dry weight, MRI cannot quantify the LIC.[20,21]
In recent years, various dual-energy CT techniques have been gradually
improved and applied in clinical practice. Dual-energy CT differential
method (ΔH method) and the three-material decomposition algorithm
(overlay method) are two primary methods of determining liver iron
content. ΔH is the difference between two CT values at high and low
voltages in the region of interest, which reflects the mixed
information of multiple substances, including all information about
liver parenchyma, fat, iron, etc.[22] This method was
first used in 1982 by Goldberg et al. who carried out a study on an
animal model with hemochromatosis using 120kVp and 80kVp, whose results
showed that the liver iron concentration predicted by CT was highly
correlated with the actual one.[23] Hereafter, the
dual-energy CT measurement method has gradually attracted people's
attention as a new non-invasive method. Three-material decomposition
algorithm was used for calculating iron content by using iron-specific
slope value and estimating iron concentration through formula
conversion. An in vitro study by Fischer et al. confirmed that the
interference of hepatic tissue and intrahepatic fat could be eliminated
by applying a three-material decomposition algorithm, specifically
reflecting liver iron content.[18]
This study showed that VIC and ΔH had a significant positive
correlation with LIC which is similar with the findings of Joe and
colleagues.[19] In 2012 Joe et al performed a
quantitative study of hepatic iron on liver transplant recipients and
liver donors by using dual-energy CT, the results indicated that ΔH was
positively correlated with hepatic iron deposition.[19]
However, its correlation coefficient
was lower than that of our study (0.430 Vs. 0.907). The reason could be
that the clinical subjects of the two studies were different. The
subjects of our study were mainly transfusion-dependent β-thalassemia
major patients (with irregular iron chelation treatment) with liver
iron overload caused by ineffective hematopoiesis and long-term blood
transfusion. In the study of Joe the patients were liver transplant
recipients and liver donors, in these patients liver iron concentration
was normal to mild, instead the range of liver iron concentration
in our study was greater (from normal to severe).[19]
ΔH probably reflects the mixed information of multiple substances and
the interference of fat may not be completely eliminated. The
above liver transplantation study indicated that ΔH had a weak but
statistically significant negative correlation with fat deposition
degree. Probably, because of the disease characteristics of the cases
in our study, the amount of fat deposition in the liver is lower than
in the context of liver transplantation. Therefore there may be less
interference of fat on ΔH and the correlation coefficient of ΔH method
was higher than that of the above study. The VIC image is based on the
three-material decomposition algorithm, and the iron ratio slope value
is used. In Fischer experiment, an experiment on the interference of
fat factor on quantitative hepatic iron was designed.[18]
Fat deposition in the liver of subjects was not analyzed in our study,
while the same iron-specific slope value as the above experiment was
used, so it could be ensured to eliminate the effect of fat on liver
iron quantification. In a recent study of LUO et al,[24]
dual-energy CT and MR relaxation techniques were used on patients with
suspected liver iron overload, the results indicated that VIC and ΔH
had highly positive linear correlation with LIC.[24]
Its correlation coefficient was compared with the result of our study,
indicating that VIC and ΔH could be used for quantitative liver iron
deposition, however, the effect of fat on liver iron quantification,
especially the respective quantification of combined deposition of iron
and fat, is worthy of further clinical study and discussion.
For
CT quantitative analysis of liver iron content, quantification and
grading also shall be carried out accordance with clinical liver iron
grading diagnosis system. The results related to VIC, ΔH and LIC of
liver iron deposition grading in our study showed that VIC and ΔH were
positively correlated with LIC of normal, moderate and severe group,
and were not correlated with that of mild group, while VIC and ΔH of
different degrees groups had statistically significant between-group
difference, indicating that the degree of hepatic iron on CT could be
graded according to LIC thresholds. However, VIC and ΔH were not
correlated with LIC of mild group, which could be due to the difference
in examination technology. Iron deposition in the liver during MRI
scanning results in inhomogeneities of the magnetic field, which
accelerate signal dephasing in MRI sequences, thereby increasing the R2
value.[25] This indicates that MR-related
techniques are more sensitive in quantifying non-heavy iron overload.
While the detection of iron by dual-energy CT is realized depending on
X-ray attenuation absorption of substance, the degree of X-ray
attenuation is closely related to substance content. In mild liver iron
deposition, the attenuation of hepatic CT value is not changed
obviously, which result in decreased sensibility of dual-energy CT.
When the liver iron content is further increased, the sensibility of
dual-energy CT is also improved further.[24]
Therefore, CT measurements is less correlated with LIC in mild group.
In addition, 7.0 mg Fe/g of liver iron concentration is a clinically
significant threshold and also the target value for monitoring the
efficacy of iron chelation therapy.[12,28]
In our study, VIC and ΔH were above this threshold and had a high
positive correlation with LIC. Therefore, quantifying and grading liver
iron concentration by dual-energy CT have a certain clinical
application value. However, the application of dual-energy CT in
quantitative analysis of mild liver iron deposition needs further
study. In fact, the assessment and follow-up of iron are done with MRI,
such as T2* technology.[12,28]
However, using the MRI T2* technique is greatly limited in quantifying
the LIC in patients with heavy hepatic iron overload, especially with
the use of the 3T MRI.[29]
Dual-energy CT could be a second line examination in patients that are
unable to undergo MRI, especially in heavy hepatic iron overload and
older patients when radiation dose is less an issue.
In paired ROC
analysis, both VIC and ΔH have high diagnostic performance for liver
iron deposition grading, the diagnostic performance of which increased
with the increase of LIC thresholds. However, the specificity of VIC in
mild and moderate groups is higher than that of ΔH, and the specificity
of ΔH is higher than that of VIC in the severe group. The cause may be
that in mild and moderate iron deposition, the interference of the fat
factor is eliminated by VIC, and ΔH may be affected by the intrahepatic
fat. In the case of mild iron deposition, the CT value of VIC is
negative, which may be related to the iron-specific slope value. This
slope is based on a phantom study and could not be optimal for the
clinical study of patients. Similarly, the clinical study of iodine
quantitation also reports some negative values.[30]
Besides, the emergence of negative CT value could also be affected by
imaging motion or hardening artifact, which results in a decrease in
the sensitivity of VIC. In the case of severe iron deposition, hepatic
iron is relatively high, the attenuation of CT value is changed, the
sensitivity of VIC is improved, and the specificity is decreased. In
severe iron deposition, the difference in CT values of fat and hepatic
tissues at two voltages is negligible, which makes the specificity of
ΔH much higher. In our study, there is no statistically significant
difference between AUC values of VIC and ΔH in all ranges of LIC (P>0.05),
indicating that the diagnostic performance of VIC and ΔH is not
different for clinically significant liver iron deposition grading,
both can achieve precise quantification and grading of liver iron
concentration. The interference of the fat factor is eliminated by VIC,
which is more likely to be the new indicator for the efficacy
assessment of iron chelation therapy.
There are some limitations
in our study. First, FerriScan-LIC rather than LIC obtained through
liver biopsy is selected as the reference. The T2* technique can also
be used to evaluate liver iron overload.[31]
The
technique is easy to perform and does not require off-site evaluation
since many softwares allow the evaluation of T2* of the organs of the
upper abdomen and the heart. However, since few of the patients in this
study were willing to perform multiple radiology examinations
simultaneously, none had an MRI T2* scan. The direct correlation
between VIC and LIC obtained from DE CT and MRI T2* could be evaluated
in a future study. Second, although clinically potential liver iron
deposition cases were included, according to deposition grading
thresholds, their sample size was relatively small; therefore,
measurement errors may exist.
Conclusions
VIC
and ΔH have a significant positive correlation with FerriScan-LIC. In
addition, accurate quantification and grading of liver iron overload by
dual-energy CT concerning LIC threshold is conducive to the dynamic and
non-invasive observation of liver iron deposition in thalassemia
patients and provides a diagnostic basis for the evaluation of the
efficacy of iron chelation therapy. However, further clinical studies
with larger sample size are needed to confirm the value of dual-energy
CT to quantitative liver iron.
Acknowledgements
We
are very grateful to Bumin Liang of School of the International
Education, Guangxi Medical University for retouching the language and
meaning of the article. This work was supported by grants from the
Natural Science Foundation of China (81760305, 81641066), Advanced
Innovation Teams and Xinghu Scholars Program of Guangxi Medical
University, and Innovation Project of Guangxi Graduate Education
(YCSW2021135), and Guangxi Zhuang Autonomous Region Health Committee
Self-financed Scien-tific Research Project (Z20200519).
Author Contributions
Material
preparation and data collection were performed by Fengming Xu, Cheng
Tang, Yiling Huang, Linlin Liang, Fuling Huang and Gaohui Yang. Data
analysis were performed by Fengming Xu, Cheng Tang and Yiling Huang.
The first draft of the manuscript was written by Fengming Xu, Cheng
Tang and Peng Peng and all authors commented on previous versions of
the manuscript. All authors read and approved the final manuscript.
Peng Peng contributed to the study conception and design.
Data Availability
The
dataset used in support of the findings of this study are available
from the corresponding author at email address upon request.
Ethics Approval
This
study was performed in line with the principles of the Declaration of
Helsinki. And the study was approved by the Ethics Committee of the
First Affiliated Hospital of Guangxi Medical University
(No.2022-E364-01). gxi Graduate Education
(YCSW2021135), and Guangxi Zhuang Autonomous Region Health Committee
Self-financed Scien-tific Research Project (Z20200519).
Conflict of Interest
The
authors declare that the research was conducted in the absence of any
commercial or financial relationships that could be construed as a
potential conflict of interest.
References
- Kattamis A, Kwiatkowski JL, Aydinok Y. Thalassaemia. Lancet. 2022 Jun 18;399(10343):2310-2324. https://doi.org/10.1016/S0140-6736(22)00536-0 PMid:35691301
- De
Sanctis V., Kattamis C., Canatan D., Soliman A. T., Elsedfy H., Karimi
M., Daar S., Wali Y., YassinM., Soliman N., Sobti P., Al Jaouni S., El
Kholy M., Fiscina B., Angastiniotis M. β-thalassemia distribution in
the old world: an ancient disease seen from a historical standpoint.
Mediterr J Hematol Infect Dis 2017, 9(1): e2017018 https://doi.org/10.4084/mjhid.2017.018 PMid:28293406 PMCid:PMC5333734
- Wood J. C. (2008). Cardiac iron across different transfusion-dependent diseases. Blood Rreviews, 22 Suppl 2(Suppl 2), S14-S21. https://doi.org/10.1016/S0268-960X(08)70004-3
- Al-Khabori,
M., Daar, S., Al-Busafi, S. A., Al-Dhuhli, H., Alumairi, A. A., Hassan,
M., Al-Rahbi, S., & Al-Ajmi, U. (2019). Non-invasive assessment and
risk factors of liver fibrosis in patients with thalassemia major using
shear wave elastography. Hematology (Amsterdam, Netherlands), 24(1),
183-188. https://doi.org/10.1080/10245332.2018.1540518 PMid:30453843
- Kanbour
I., Chandra P., Soliman A., De Sanctis V., Nashwan A., Abusamaan S.,
Moustafa A.,Yassin M.A..Severe liver iron concentrations (lic) in 24
patients with β-thalassemia major: correlations with serum ferritin,
liver enzymes, and endocrine complications. Mediterr J Hematol Infect
Dis 2018, 10(1): e201806 https://doi.org/10.4084/mjhid.2018.062 PMid:30416694 PMCid:PMC6223579
- De
Sanctis V., Soliman A.T., Daar S., Alansary N., Kattamis A., Skafida
M., Galati M.C., Christou S., Campisi S., Messina G., Yassin M.A.,
Canatan D., Di Maio S., Al Jaouni S., Raiola G., Karimi M., Kaleva V.,
Kakkar S., Mariannis D., Kattamis C.A concise review on the frequency,
major risk factors and surveillance of hepatocellular carcinoma (HCC)
in β-thalassemias: past, present and future perspectives and the ICET-A
experience. Mediterr J Hematol Infect Dis 2020, 12(1): e2020006 https://doi.org/10.4084/mjhid.2020.006 PMid:31934316 PMCid:PMC6951357
- Olivieri, N. F., & Brittenham, G. M. (1997). Iron-chelating therapy and the treatment of thalassemia. Blood, 89(3), 739-761 https://doi.org/10.1182/blood.V89.3.739 PMid:9028304
- Werner,
S., Krauss, B., Haberland, U., Bongers, M., Starke, U., Bakchoul, T.,
Enkel, S., Nikolaou, K., & Horger, M. (2019). Dual-energy CT for
liver iron quantification in patients with haematological disorders.
European Radiology, 29(6), 2868-2877. https://doi.org/10.1007/s00330-018-5785-4 PMid:30406312
- Imajo,
K., Kessoku, T., Honda, Y., Hasegawa, S., Tomeno, W., Ogawa, Y.,
Motosugi, U., Saigusa, Y., Yoneda, M., Kirikoshi, H., Yamanaka, S.,
Utsunomiya, D., Saito, S., & Nakajima, A. (2022). MRI-Based
Quantitative R2* Mapping at 3 Tesla Reflects Hepatic Iron Overload and
Pathogenesis in Nonalcoholic Fatty Liver Disease Patients. Journal of
Magnetic Resonance Imaging: JMRI, 55(1), 111-125. https://doi.org/10.1002/jmri.27810 PMid:34184822
- Rose
C, Vandevenne P, Bourgeois E, Cambier N, Ernst O. Liver iron content
assessment by routine and simple magnetic resonance imaging procedure
in highly transfused patients. Eur J Haematol. 2006 Aug;77(2):145-9. https://doi.org/10.1111/j.0902-4441.2006.t01-1-EJH2571.x PMid:16608501
- Henninger,
B., Alustiza, J., Garbowski, M., & Gandon, Y. (2020). Practical
guide to quantification of hepatic iron with MRI. European Radiology,
30(1), 383-393. https://doi.org/10.1007/s00330-019-06380-9 PMid:31392478 PMCid:PMC6890593
- Khadivi
Heris, H., Nejati, B., Rezazadeh, K., Sate, H., Dolatkhah, R.,
Ghoreishi, Z., & Esfahani, A. (2021). Evaluation of iron overload
by cardiac and liver T2* in β-thalassemia: Correlation with serum
ferritin, heart function and liver enzymes. Journal of Cardiovascular
and Thoracic Research, 13(1), 54-60. https://doi.org/10.34172/jcvtr.2021.18 PMid:33815703 PMCid:PMC8007896
- Jhaveri,
K. S., Kannengiesser, S., Ward, R., Kuo, K., & Sussman, M. S.
(2019). Prospective Evaluation of an R2* Method for Assessing Liver
Iron Concentration (LIC) Against FerriScan: Derivation of the
Calibration Curve and Characterization of the Nature and Source of
Uncertainty in the Relationship. Journal of Magnetic Resonance Imaging:
JMRI, 49(5), 1467-1474. https://doi.org/10.1002/jmri.26313 PMid:30291649
- Xu
F.,Yi J.,Liang B.,Tang C.,Feng Q.,Peng P. Comparative study on the
measurement of liver LICdw between Ferriscan and T2* based LICdw
obtained by different software's. Mediterr J Hematol Infect Dis
2022,14(1): e2022072. https://doi.org/10.4084/MJHID.2022.072 PMid:36425151 PMCid:PMC9652007
- Padeniya,
P., Siriwardana, S., Ediriweera, D., Samarasinghe, N., Silva, S.,
Silva, I., Ahamed, N., Niriella, M., & Premawardhena, A. (2020).
Comparison of liver MRI R2(FerriScan®) VS liver MRI T2* as a measure of
body iron load in a cohort of beta thalassaemia major patients.
Orphanet Journal of Rare Diseases, 15(1), 26. https://doi.org/10.1186/s13023-020-1301-4 PMid:31969179 PMCid:PMC6977251
- Abadia,
A. F., Grant, K. L., Carey, K. E., Bolch, W. E., & Morin, R. L.
(2017). Spatial Distribution of Iron Within the Normal Human Liver
Using Dual-Source Dual-Energy CT Imaging. Investigative Radiology,
52(11), 693-700. https://doi.org/10.1097/RLI.0000000000000393 PMid:28562414
- Luo,
X. F., Xie, X. Q., Cheng, S., Yang, Y., Yan, J., Zhang, H., Chai, W.
M., Schmidt, B., & Yan, F. H. (2015). Dual-Energy CT for Patients
Suspected of Having Liver Iron Overload: Can Virtual Iron Content
Imaging Accurately Quantify Liver Iron Content? Radiology, 277(1),
95-103. https://doi.org/10.1148/radiol.2015141856 PMid:25880263
- Fischer,
M. A., Reiner, C. S., Raptis, D., Donati, O., Goetti, R., Clavien, P.
A., & Alkadhi, H. (2011). Quantification of liver iron content with
CT-added value of dual-energy. European Radiology, 21(8), 1727-1732. https://doi.org/10.1007/s00330-011-2119-1 PMid:21472472
- Joe,
E., Kim, S. H., Lee, K. B., Jang, J. J., Lee, J. Y., Lee, J. M., Han,
J. K., & Choi, B. I. (2012). Feasibility and accuracy of
dual-source dual-energy CT for non-invasive determination of hepatic
iron accumulation. Radiology, 262(1), 126-135. https://doi.org/10.1148/radiol.11110060 PMid:22106352
- St
Pierre TG, Clark PR, Chua-anusorn W, Fleming AJ, Jeffrey GP, Olynyk JK,
Pootrakul P, Robins E, Lindeman R. Noninvasive measurement and imaging
of liver iron concentrations using proton magnetic resonance. Blood.
2005;105(2):855-861. https://doi.org/10.1182/blood-2004-01-0177 PMid:15256427
- St
Pierre, T. G., El-Beshlawy, A., Elalfy, M., Al Jefri, A., Al Zir, K.,
Daar, S., Habr, D., Kriemler-Krahn, U., & Taher, A. (2014).
Multicenter validation of spin-density projection-assisted R2-MRI for
the non-invasive measurement of liver iron concentration. Magnetic
Resonance in Medicine, 71(6), 2215-2223. https://doi.org/10.1002/mrm.24854 PMid:23821350 PMCid:PMC4238736
- Pickhardt,
P. J., Graffy, P. M., Reeder, S. B., Hernando, D., & Li, K. (2018).
Quantification of Liver Fat Content With Unenhanced MDCT: Phantom and
Clinical Correlation With MRI Proton Density Fat Fraction. AJR.
American Journal of Roentgenology, 211(3), W151-W157. https://doi.org/10.2214/AJR.17.19391 PMid:30016142 PMCid:PMC6615548
- Goldberg,
H. I., Cann, C. E., Moss, A. A., Ohto, M., Brito, A., & Federle, M.
(1982). Non-invasive quantitation of liver iron in dogs with
hemochromatosis using dual-energy CT scanning. Investigative Radiology,
17(4), 375-380. https://doi.org/10.1097/00004424-198207000-00013 PMid:7129818
- Luo,
X. F., Xie, X. Q., Cheng, S., Yang, Y., Yan, J., Zhang, H., Chai, W.
M., Schmidt, B., & Yan, F. H. (2015). Dual-Energy CT for Patients
Suspected of Having Liver Iron Overload: Can Virtual Iron Content
Imaging Accurately Quantify Liver Iron Content?. Radiology, 277(1),
95-103. https://doi.org/10.1148/radiol.2015141856 PMid:25880263
- Ghugre,
N. R., & Wood, J. C. (2011). Relaxivity-iron calibration in hepatic
iron overload: probing underlying biophysical mechanisms using a Monte
Carlo model. Magnetic Resonance in Medicine, 65(3), 837-847. https://doi.org/10.1002/mrm.22657 PMid:21337413 PMCid:PMC3065944
- Hoffbrand,
A. V., Taher, A., & Cappellini, M. D. (2012). How I treat
transfusional iron overload. Blood, 120(18), 3657-3669. https://doi.org/10.1182/blood-2012-05-370098 PMid:22919029
- Belmont,
A., & Kwiatkowski, J. L. (2017). Deferiprone for the treatment of
transfusional iron overload in thalassemia. Expert Review of
Hematology, 10(6), 493-503. https://doi.org/10.1080/17474086.2017.1318052 PMid:28448199
- Doyle,
E., Ghugre, N., Coates, T. D., & Wood, J. C. (2020). Fixing the MRI
R2-iron calibration in liver. American Journal of Hematology, 95(5),
E120-E122. https://doi.org/10.1002/ajh.25754 PMid:32048331
- d'Assignies,
G., Paisant, A., Bardou-Jacquet, E., Boulic, A., Bannier, E., Lainé,
F., Ropert, M., Morcet, J., Saint-Jalmes, H., & Gandon, Y. (2018).
Non-invasive measurement of liver iron concentration using 3-Tesla
magnetic resonance imaging: validation against biopsy. European
Radiology, 28(5), 2022-2030. https://doi.org/10.1007/s00330-017-5106-3 PMid:29178028
- Toepker,
M., Moritz, T., Krauss, B., Weber, M., Euller, G., Mang, T., Wolf, F.,
Herold, C. J., & Ringl, H. (2012). Virtual non-contrast in
second-generation, dual-energy computed tomography: reliability of
attenuation values. European Journal of Radiology, 81(3), e398-e405. https://doi.org/10.1016/j.ejrad.2011.12.011 PMid:22236702
- Wood,
J. C., Zhang, P., Rienhoff, H., Abi-Saab, W., & Neufeld, E. J.
(2015). Liver MRI is more precise than liver biopsy for assessing total
body iron balance: a comparison of MRI relaxometry with simulated liver
biopsy results. Magnetic Resonance Imaging, 33(6), 761-767. https://doi.org/10.1016/j.mri.2015.02.016 PMid:25708262
[TOP]