Received: May 19, 2015
Accepted: November 9, 2015
Mediterr J Hematol Infect Dis 2016, 8(1): e2016003, DOI 10.4084/MJHID.2016.003
This article is available on PDF format at:

| This is an Open Access article distributed
under the terms of the Creative Commons Attribution License (https://creativecommons.org/licenses/by-nc/4.0), which permits unrestricted use, distribution, and reproduction in any medium, provided the original work is properly cited. |
|
Abstract Background: Treatment of
hepatitis C virus (HCV) infection based on peginterferon-α (pegIFNα)
and ribavirin induces important changes in cytokine release and T cell
activation. Objective: Immune response to pegIFNα-ribavirin therapy was explored in patients coinfected by HCV and HIV. Methods: Concentrations of 25 cytokines and CD8+ T cell activation were monitored in HCV/HIV coinfected patients classified as sustained virological responders (SVR, n=19) and non-responders (NR, n=11). Results: High pretreatment concentrations of IP-10 (CXCL-10) and MCP-1 (CCL-2) were associated with a poor anti-HCV response. PegIFNα-ribavirin therapy increased CD8+ T cell activation and induced significant changes in levels of eleven cytokines related to both Th1 and Th2 responses in SVR (IL-1β, IL-1RA, IL-4, IL-5, IL-6, IL-7, IL-12p40/70, IL-13, IP-10, eotaxin, MCP-1) but of only six cytokines in NR (IL-1β, IL-2, IL-5, IL-12p40/70, IL-13, eotaxin). The highest rise in MIP-1β and MCP-1 levels was observed four weeks after anti-HCV treatment initiation in SVR compared to NR (p=0.002 and p=0.03, respectively), whereas a decrease in IL-8 concentration was associated with treatment failure (p= 0.052). Conclusions: Higher and broader cytokine responses to pegIFNα-ribavirin therapy were observed in SVR patients compared to NR. Changes in IL-8, MIP-1β and MCP-1 serum concentrations may be associated with efficacy of pegIFNα- and ribavirin-based therapies in patients coinfected by HCV and HIV. |
Introduction
Infection by hepatitis C virus (HCV) and HIV shared common routes of
transmission and thus confections with the two viruses are frequent.
HCV infection is seen in 15–30% of HIV-infected patients in Western
Europe, with almost 20 000 HIV-infected individuals chronically
infected with HCV in France.[1,2] Since the
introduction of antiretroviral therapy (ART), HCV-related liver
diseases have become leading causes of morbidity and mortality in
HIV-infected individuals.[3,4]
Faster progression
to cirrhosis has been observed in patients coinfected with HCV and HIV
by comparison with subjects infected with HCV alone.[5] HIV/HCV coinfection is also associated with higher HCV viral levels in serum.[6]
Finally, ART-related adverse events are more frequent in HCV/HIV
coinfected individuals, with increased difficulties in optimally
treating HIV infection.[7,8]
Until recently, a
combination of pegIFN and ribavirin has been the standard-of-care for
treatment of chronic HCV patients. In coinfected individuals
pegINFα-ribavirin therapy is less efficacious than in single HCV
infection.[9,10] Approximately 30% of patients
receiving a combination of ribavirin with pegIFN have a sustained
virological response when infected with HCV genotype 1 and 4.[9] This rate increases to 60% when genotype 2 and 3 are involved.[10]
Most of the current anti-HCV therapeutic options remained based on
pegIFN and/or ribavirin in addition to protease inhibitors or NS5A or
NS5B inhibitors.[11]
PegIFN constitutes an
active immunotherapy triggering innate immune response and T cell
activation. The cytokine response to pegIFNα-based regimens plays
probably an important role in treatment outcome. IFNα stimulates Th1
cells and limits secretion of Th2 related cytokines such as IL-4 or
IL-10.[12] IFNα signals through Janus kinase signal
transducer, an activator of transcription pathway, and induction of
IFN-stimulated genes.[13] Ribavirin synergies this effect by reducing IL-10 production, enhancing autocrine IFN-β and IL-8 secretion.[14-16]
Several immune factors are predictive of virological response on
pegIFNα-ribavirin-based therapy: pretreatment concentration of
IFNα-inducible protein 10 (IP-10, also called CXCL-10), polymorphisms
near the interleukin-28B gene coding for the IFNα-3, and CD4+ T cell count in HIV/HCV coinfected individuals.[18,19]
Progressive impairment of immune functions and T cell exhaustion
induced by prolonged exposure to virus antigens are fundamental
features of HIV infection. Inhibitory networks, such as the programmed
cell death protein-1 (PD-1) and IL-10 play a key role in this process.[20,21] PD-1 is upregulated on CD8+ and CD4+ T cells and mediates a dysfunction partially reversible on ART.[22-24]
PD-1 signalling impacts the expression of both Th1 and Th2 cytokines
but limits particularly the capacity of Th1 and IFNγ secretion by CD4+ and CD8+ T cells.[21]
Although
HCV clearance depends on immune response induced by pegIFNα-ribavirin
therapy, the dynamics of cytokine response and T cell activation in
individuals coinfected with HIV and HCV remain poorly characterized.[25] In this study, we monitor serum concentration of 25 cytokines alongside with the level of CD8+ T cell activation in HIV/HCV coinfected patients initiating anti-HCV therapy.
Methods
Patient samples:
Patients coinfected by HIV/HCV followed at Montpellier University
Hospital and initiating anti-HCV therapy were included consecutively
between January 2007 and January 2010 after providing written informed
consent. The study was approved by the local institution ethical
committee (DC-2011-1405). Chronic hepatitis was proved by the presence
of serum HCV antibodies and detectable viral RNA. HCV genotype, HCV and
HIV-1 viral loads, CD4+
T cell count, and liver enzyme levels were all determined using
standard procedures. All patients received pegIFNα2a 180 microg/week
plus ribavirin 800 to 1,200 mg daily; patients infected with HCV
genotype 2 and 3 received 800 mg daily and genotype 1 and 4 received a
weight based dose: 1,000 mg/day for persons less than 75 kg and 1200
mg/day over 75 kg.
Subjects were ranged into two distinct groups based on HCV response to therapy:
i)
Sustained virological responders (SVR) when serum HCV RNA was
undetectable 24 weeks after completing therapy, and
ii) non
responders (NR) when HCV RNA decrease was < 2 log copies/mL at week
12 or when HCV RNA was detectable at the end of treatment.
iii) Patient relapsing in the 24 weeks period after therapeutic cessation were excluded from the study.
Routine laboratory testing:
Serum HCV RNA was quantified using COBAS AmpliPrep/COBAS TaqMan HCV
assay (Roche Diagnostic Systems). HCV genotypes were determined using
INNO-LiPA HCV II test (Innogenetics). Alanine aminotransferase (ALT)
dosages were executed using standard methods.
Quantitation of serum cytokine concentrations: Cytokines were quantified in serum samples obtained before initiation of treatment, and four weeks after the start of PegIFNα-based
therapy. A multiplexed microbead assay was used according to
manufacturer's instructions (cytokine twenty-five-plex kit, Life
Technologies Ltd, Paisley, UK) and an FIDIS™ apparatus (BMD). Twenty
five cytokines were quantified in duplicate: IL-1β, IL-1RA, IL-2,
IL-2R, IL-4, IL-5, IL-6, IL-7, IL-8, IL-10, IL-12p40/70, IL-13, IL-15,
IL-17, eotaxin, GM-CSF, IFN-α, IFN-γ, IP-10, MCP-1, MIG, MIP-1α,
MIP-1β, RANTES, and TNF-α. Data were analyzed using the MLX-Booster
program (BMD). Mean concentrations (pg/ml) of cytokines were all
superior to the detection limits, defined as the mean background value
plus 2 SD.
Analysis of CD8+/CD38bright T cells: Activation of CD8+
T cells was assessed by flow cytometry analysis on EDTA-treated fresh
whole blood using FC 500 apparatus (Beckman Coulter, Miami, Florida). T
cell activation was explored at day 0, week 4 and week 12 after
initiation of pegIFNα-ribavirin therapy. The expression of CD38bright on CD8+
T cells was analyzed as previously described using a two-colour
staining with anti-CD8 and anti-CD38 conjugated to fluorescein
isothiocyanate (FITC) and phycoerythrin (PE), respectively (Beckman
Coulter).[26] The positive threshold for CD38bright
analysis was established using the CellQuant CD38/CD8 kit for
quantitation of CD38 cell surface expression (BioCytex, Marseille,
France) and was defined as 8,500 CD38 binding sites/cells. The CD8+/CD38bright values were expressed as the percentage of CD38bright cells from the CD8+ T cell populations.
Statistical Analysis:
The Mann–Whitney U test and Kruskal–Wallis test were used to analyze
continuous variables where appropriate. The Friedman test was used to
evaluate changes in serum cytokine levels over time. A mixed model was
used to analyze the association between T cell activation during
anti-HCV therapy and therapeutic response. Statistical analyses were
done using SPSS software version 18.0J.
Results
Clinical characteristics at baseline: Thirty HCV/HIV coinfected patients receiving pegIFNα-ribavirin
therapy were included in the study. Nineteen (63%) were classified as
SVR and eleven (37%) as NR. Patient characteristics are shown in Table 1.
Pretreatment levels of soluble and cellular inflammatory markers: IP-10 levels were higher in the NR group than in the SVR group, P=0.021 (Table 2).
Individuals from the NR group also had higher pretreatment
concentrations of MCP-1, P=0.0009. A trend for a higher serum
concentration of IL-8 was also observed in patients of the NR group
compared to the SVR group, P=0.106.
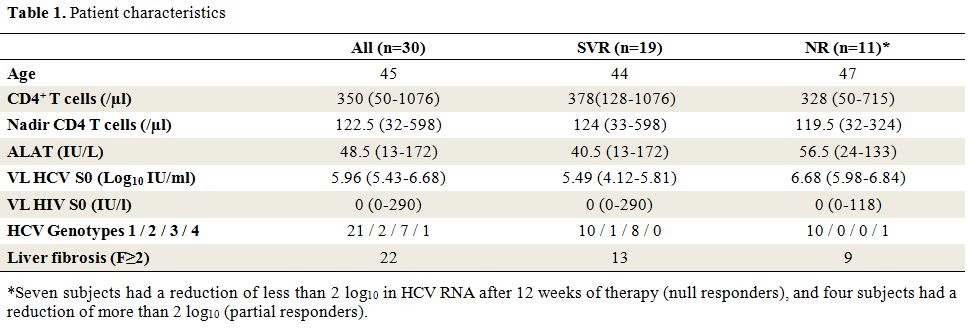 |
Table 1. Patient characteristics |
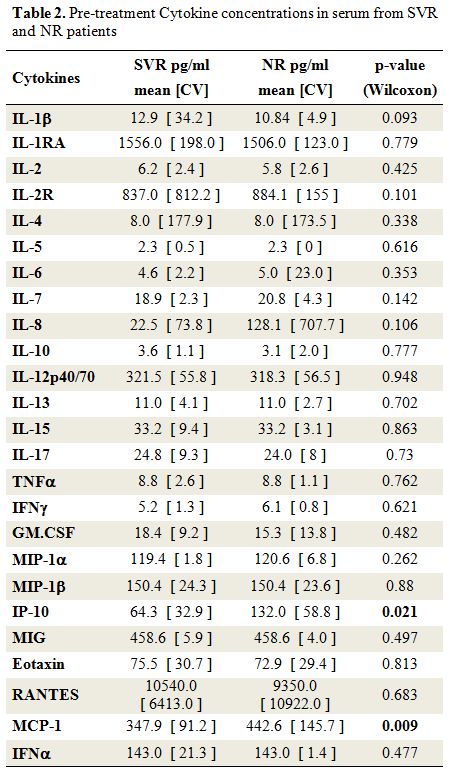 |
Table 2. Pre-treatment Cytokine concentrations in serum from SVR and NR patients |
Cytokines change after therapeutic initiation of HCV treatment: Initiation of anti-HCV treatment elicited IFNα rise in both SVR and NR patients (Figure 1 and Supplemental Table 1). This enhancement of IFNα in serum was similar in the two groups. Besides IFNα, the anti-HCV therapy induced a significant increase in the serum levels of eleven cytokines in SVR patients, including cytokines related to Th1-dominant immune responses (IL-12p40/70, IP-10), Th2-type cytokines (IL-4, IL-5, and IL-13), and pro-inflammatory cytokines (IL-1β, IL-1RA, IL-6, IL-7). By comparison, levels of only six cytokines rose in the NR group (Supplemental Table 1). Finally, when results were analyzed without consideration of the HCV therapeutic response (combining SVR and NR patients), we also observed an increase of IL-2, IL-10, and RANTES concentrations four weeks after initiation of anti-HCV treatment (Supplemental Table 1).
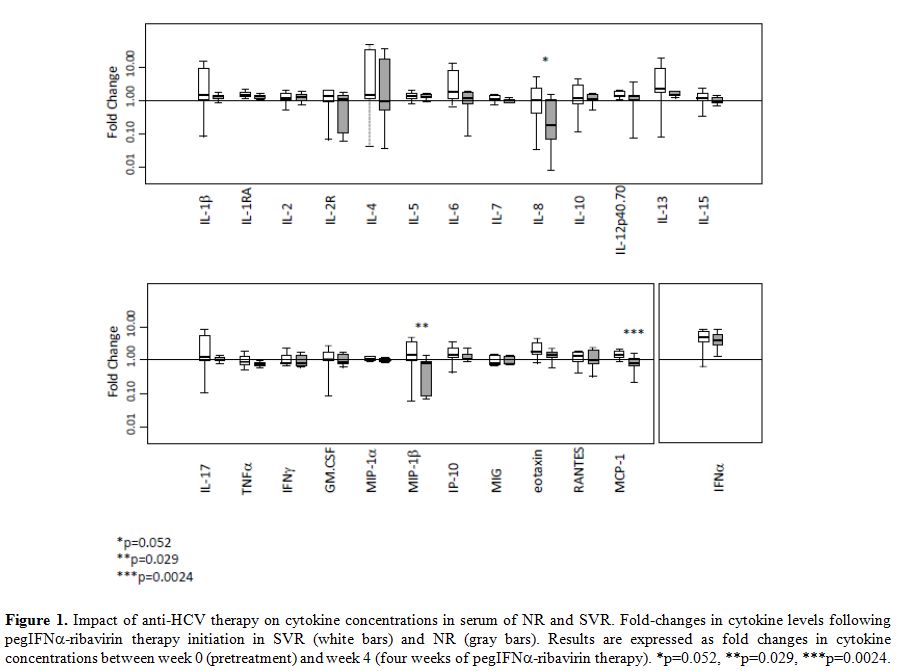 |
Figure 1. Impact of anti-HCV therapy on cytokine concentrations in serum of NR and SVR. Fold-changes in cytokine levels following pegIFNα-ribavirin therapy initiation in SVR (white bars) and NR (gray bars). Results are expressed as fold changes in cytokine concentrations between week 0 (pretreatment) and week 4 (four weeks of pegIFNα-ribavirin therapy). *p=0.052, **p=0.029, ***p=0.0024. |
|
|
Supplemental Table 1. Fold changes in serum cytokines level four week after initiation of pegIFN-ribavirin therapy. |
Comparison of the cytokine level changes induced by pegIFN-ribavirin between SVR and NR group: Changes in cytokines were compared among SVR and NR using the ratio between baseline and four weeks of treatment (Figure 1).
A sharp increase of MCP-1 and MIP-1β concentration was observed after
initiation of anti-HCV therapy in the SVR group whereas the value
decreased or remained stable in the NR group (p=0.0024 and p=0.029,
respectively). Furthermore, the IL-8 concentration remains stable after
a one-month period of pegIFNα-ribavirin
therapy in most of the patients responding to anti-HCV treatment,
whereas this concentration declined in NR patients (p=0.052).
Changes in T cell activation over the three-months period of therapy initiation: The impact of pegIFNα-ribavirin on T cell activation was explored at day 0, week 4 and week 12 (Figure 2). CD8+ T cell activation before the treatment tends to be higher in NR patients compared to the SVR patients, (p=0.066, Figure 2). Anti-HCV therapy induced a major increase in CD38bright expression on CD8 T+
cells in the two groups of patients (p<0.001). No significant
differences were observed between the two groups in the slope of CD38
cell surface expression of CD8+ T
cells suggesting that the over time changes of this activation marker
not be associated with a better immune response to therapy.
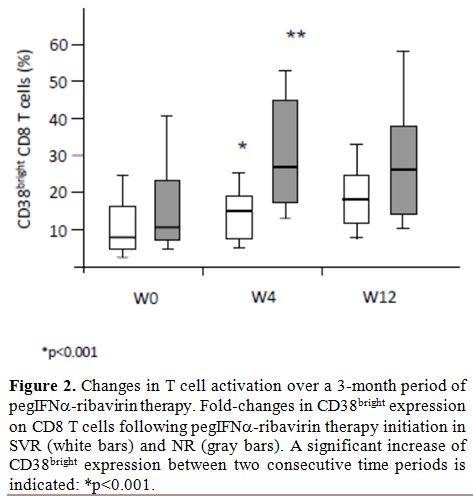 |
Figure 2. Changes in T cell activation over a 3-month period of pegIFN-ribavirin therapy. Fold-changes in CD38bright expression on CD8 T cells following pegIFNα-ribavirin therapy initiation in SVR (white bars) and NR (gray bars). A significant increase of CD38bright expression between two consecutive time periods is indicated: *p<0.001. |
Discussion
Although the virological response to pegIFNα/ribavirin-based
therapy is intimately associated with the host immunity, the monitoring
of HCV treatment is based on the serum HCV-RNA level decay regardless
of the immune response. In this study, CD8+
T cell activation and levels of 25 cytokines were analyzed in HIV/HCV
coinfected patients with favourable versus unfavourable therapeutic
outcome.
PegIFNα/ribavirin administration induced a dramatic change in serum cytokine concentrations and CD8+ T-cell activation level. We observed that the HCV clearance under pegIFNα/ribavirin therapy was associated with broader and higher cytokine responses in SVR than in NR.
Multianalyte
assays make possible to analyze a wide an array of cytokines using a
small sample volume rapidly. In the present study, the level of 25
cytokines and CD8+ T-cell activation were analyzed at baseline and week four after the initiation of pegIFNα/ribavirin
therapy. Comparison between different multiplex bead assays has shown
variable agreement among kits evidencing that absolute cytokine
concentrations differ across commercial assays.[27,28]
As a consequence, multisite comparisons between cytokine concentrations
obtained with different methods are difficult to interpret because of
the lack of standardization. However, these methods are useful for
longitudinal studies, and a similar rank order of cytokine
concentrations between samples is preserved between the different
commercial kits. Hence, we considered comparisons based on fold change
under pegIFNα-ribavirin
therapy as a valuable method for identifying a predictor of therapeutic
success or failure. Even if interferon-free regimen progressively
substitute pegIFNα-containing
regimen for treatment of hepatitis C it remains of particular
importance to describe immune response after initiation of pegIFNα. Indeed, IFNα remains
the only drug approved for treatment of chronic hepatitis D and the
only treatment used for a limited period for hepatitis B.
Baseline
serum concentration of IP-10 and MCP-1 (monocyte chemotactic protein 1)
were higher in NR than in SVR. A significant increase was observed
after treatment initiation in 15 out of 25 soluble biomarkers tested.
The strongest increased was observed for IFNα
as an expectable consequence of the anti-HCV therapy, with more than
4-fold rise between week 0 and week 4. Increase in cytokine
concentrations after pegIFNα-ribavirin
administration was observed for pro-inflammatory- and Th1-related
cytokines such as IL-12 or IP-10, but also for Th2-related cytokines
such as IL-4 or IL-13. Activation of T cells accompanied this
phenomenon as shown by the increased cell surface expression of CD38 on
CD8+ T cells.
Based on
therapeutic outcome distinct cytokine patterns were identified.
Differences in cytokine concentrations were observed at baseline and
following anti-HCV initiation. In agreement with previous studies in
individuals coinfected we observed the pretreatment serum level of
IP-10 was higher in the NR group than in the SVR group.[19]
Circulating IP-10 concentration is well correlated with intrahepatic
IP-10 messenger RNA expression during chronic HCV infection.[29]
The high baseline hepatic IFN-stimulated genes expression is associated
with a lower chance to be SVR to IFN-based therapy when HIV-uninfected.[30-33]
Interestingly, the pre-treatment MCP-1 concentration was also found at
a higher concentration in the NR group. This pro-inflammatory chemokine
is involved in the migration and infiltration of monocytes and CD4+
memory T lymphocytes. Intra-hepatic and serum MCP-1 levels are
associated with liver inflammation and fibrosis during chronic HCV
infection.[34,35] MCP-1 plays a significant role in
the recruitment of monocytes by interacting with their cell-surface
adhesion-molecules that are over expressed during chronic HCV
infection.[36] Association between MCP-1 baseline level, and response to pegIFNα-ribavirin therapy has been recently reported in HIV-uninfected patients.[37] Both chronic HCV and HIV infections induce expression and release of MCP-1 in humans.[38,39] HIV proteins like gp120[40] and transactivator protein Tat[41,42]
have shown strong immunomodulatory capacity through MCP-1 stimulation.
MCP-1 has also been shown to promote Th2 responses by polarizing Th0
cells towards a Th2 phenotype[43] and is thought to be one of the key factors involved in HIV pathogenesis.[44]
Hence, MCP-1 pretreatment level may be associated with the promotion of
the Th1 dominant response and HCV clearance under pegIFNα-ribavirin therapy in HIV/HCV coinfected patients.
Cytokine response to pegIFNα/ribavirin
therapy differed qualitatively between SVR and NR. The cytokine
response appeared more restricted in NR than in SVR since only six
versus 11 cytokines rise significantly following the commencement of
anti-HCV therapy. As a possible consequence of high IP-10 and MCP-1
baseline level, the boost of circulating IP-10 and MCP-1 levels was not
observed in the NR after four weeks of pegIFNα-ribavirin
treatment. Circulating IP-10 is considered as a marker of the
pre-therapeutic activation level of IFN-stimulated genes. The defect in
IP-10 response observed four weeks after starting pegIFNα-ribavirin
treatment can be viewed as a marker of the overexpression of
IFN-stimulated genes leading to a poor capacity response to exogenous
IFN injections.
Four weeks after initiation of pegIFNα-ribavirin,
a higher MIP-1β (macrophage inflammatory protein-1β) and MCP-1
secretions were observed in SVR when compared to NR. Of interest, a
trend for a paradoxical decrease of MIP-1β was also observed at the
same time in the NR group. The concentration of MIP-1β was halved in
the NR group at week four compared to baseline whereas MCP-1β level
tends to increase in the SVR group. This observation is consistent with
a previous study showing that HCV clearance is more frequent in
patients experiencing strong MIP-1β and MIP-1β response to pegIFNα-based therapy.[45,46]
MIP-1β (also named CCL4) is a chemokine linked to the Th1 response.
MIP-1β is involved in T cell recruitment mediated by CCR5 and CCR1 in
the liver of HCV infected patients.[38] The amplitude of MCP-1 variation in response to pegIFNα/RBV is probably dependent on baseline MCP-1 level as for IP-10. IL-8 dynamic response to pegIFNα-ribavirin
therapy also appears different in the two groups. IL-8 serum levels
tend to be elevated at baseline in NR and to diminish following pegIFNα-ribavirin initiation. High IL-8 mRNA is involved in liver inflammation[47-49] and inhibition of the IFNα antiviral response in vitro.[50] Pretreatment level of IL-8 has also been found associated with poor virological response to pegIFNα-ribavirin therapy.[51]
Evolution of IL-8 concentration may reflect the combined effect of
pegIFN plus ribavirin since ribavirin induces its secretion through the
activation of activator protein 1.[14]
In this study, relapse patients were not included in the group of patients that did not recover from HCV under pegIFNα-ribavirin.
Subjects who experience relapse had patterns of virological response
different from NR with a rapid decline in HCV RNA during the first week
of treatment.[52,53] Hence, relapse patients should be explored a part from NR and SNR groups.
Our
study had limitations related to its retrospective nature and the small
number of subjects included. HCV genotypes and fibrosis stage were not
taken into account in the analysis and IL-28 polymorphism, which is
also known to predict the hepatic responsiveness to IFN-based therapy,
was not assessed. The study was not designed to establish clinical
performances of immunological markers useful for HCV therapeutic
prediction and/or monitoring but showed that different ongoing trends
of cytokine response to pegIFNα/ribavirin can be observed in SVR and NR patients infected with HIV.
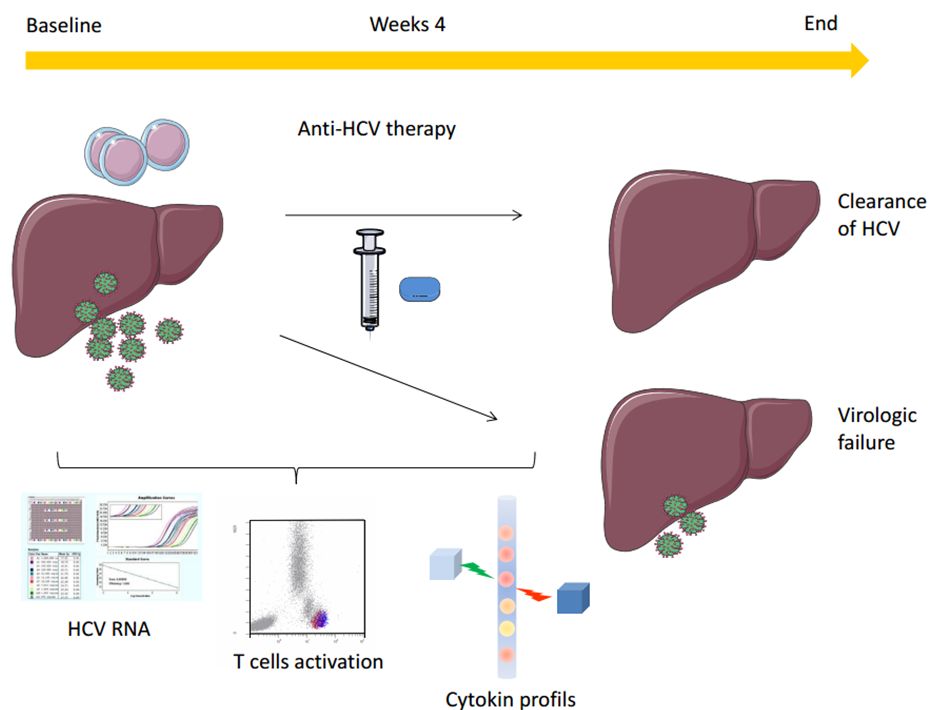 |
Figure 3 |
Conclusions
HIV/HCV coinfected patients, showing a high IP-10 and MCP-1 baseline level alongside with a reduced capacity to produce or to maintain broader secretion of cytokines, including MIP-1β, IL-4, IL-6 or IL-8, may have a poor response to regimens based on Peg-IFN and ribavirin. Anti-HCV treatment based on drugs having immunomodulating activities may benefits from immunomonitoring using multiplex techniques.
Acknowledgements
This work has been supported by grants from Agence Nationale de Recherche sur le SIDA et les hépatites virales (ANRS), UMR Inserm U1058, and the Ministère Français de la Coopération for Ph.D. grants of Tam Truong Nguyen.References

[TOP]