Received: September 19, 2015
Accepted: December 1, 2015
Mediterr J Hematol Infect Dis 2016, 8(1): e2016004, DOI 10.4084/MJHID.2016.004
This article is available on PDF format at:

Seham M. Ragab1,Eman A. Badr2 and Ahmed S. Ibrahim1
| This is an Open Access article distributed
under the terms of the Creative Commons Attribution License (https://creativecommons.org/licenses/by-nc/4.0), which permits unrestricted use, distribution, and reproduction in any medium, provided the original work is properly cited. |
|
Abstract Background: Osteoporosis is a
major complication of beta thalassemia major (TM). Increased oxidative
stress and its controlling genes were linked to osteoporosis. Ile105
Val variant is a functional polymorphism of Glutathione S-transferase
P1 (GSTP1), with reduced anti-oxidative property. No data are available
about this variant or its association with osteoporosis among
thalassemia patients yet. Objectives: To investigate Ile105Val polymorphism and its possible association with bone mineral density (BMD) values in a group of TM children. Methods: Thirty five TM children and 30 age and sex matched healthy controls were included. Liver and renal functions, serum ferritin, calcium, phosphorous, alkaline phosphatase and osteocalcin were assayed. BMD was determined by DXA with calculation of Z-scores at lumbar spine (LS) and femoral neck (FN). Height for age Z-score (HAZ) adjusted BMD Z-scores were calculated. GSTP1 Ile105Val polymorphism was studied by polymerase chain reaction-restriction fragment length polymorphism. Results: The relative frequency of 105 Val allele was significantly higher in TM patients than the controls (p<0.0001). Significant association between genotype subgroups and BMD parameters was detected. Compared to wild homozygotes, polymorphic homozygotes had lower LS-BMD (p=0.029), LS-BMD Z –score (p=0.008), LS- BMDhaz - Z-score (p=0.011), FN- BMD (p=0.001), FN- BMD Z –score (p=0.02) and FN-BMDhaz - Z-score (p=0.001). They exhibited higher osteocalcin levels compared to heterozygotes and wild homozygotes (p=0.012, p=0.013, respectively). Conclusion: Ile105Val polymorphism was frequent among TM patients and could increase their susceptibility to reduced BMD. Large sample studies are required to confirm these findings. |
Introduction
Thalassemia major (TM) is the severest form of beta (β)-thalassemia.
It is characterized by life-threatening anemia and iron overload.[1] As
a result of regular blood transfusions and increased compliance with
iron chelation therapy, the life expectancy of β-thalassemia patients
has greatly improved over the last years. However, this improvement is
often accompanied by a series of grave complications including
osteoporosis.[2]
Osteoporosis is a skeletal disease characterized
by low bone mineral density (BMD) and deterioration of bone tissue
micro-architecture with increased fracture risk.[3]
Thalassemia
osteopathy is multi-factorial and culminates in a state of increased
bone turnover with excessive bone resorption and remodeling. Hormonal
deficiency, bone marrow expansion, high iron stores, deferoxamine
toxicity, small body size, low baseline hemoglobin (Hb), delayed
puberty and calcium/vitamin D deficiency are important risk factors.[4]
However,
BMD is a complex quantitative trait that is genetically controlled in
50–90% of the cases according to twin and family studies.[5]
Genetic
factors implication in osteoporosis among thalassemia patients has
become a topic of widespread interest during the last decade.
Polymorphisms of several genes, known to influence BMD, including
collagen type I A1 (COLIA1),[6] vitamin D receptor (VDR)[7] and
transforming growth factor-beta (TGF-β)[8] have been previously
investigated among thalassemia patients. However, the results were
controversial.[9]
Glutathione S-transferases (GSTs) are a
super-family of genes whose gene products are enzymes responsible for
catalyzing the bio-transformation of a variety of electrophilic
compounds. Thus, they perform a pivotal role in the detoxification of
activated metabolites of pro-carcinogens.[10]
GSTP1 -a pi class of
the GST enzyme family- is the most prevalent isoform in
non-hepatic tissues.[11] Its gene is located on chromosome 11q13.[12]
Ile105Val polymorphism is a single nucleotide polymorphism in GSTP1
gene, caused by substitution of isoleucine for valine at amino acid
codon 105. This substantially diminishes the enzyme activity and
reduces its effective detoxification capacity.[13]
There is a
growing body of evidence associating increased oxidative stress and low
circulating antioxidants levels with reduced BMD and
osteoporosis.[14-16]
Few studies have addressed the association
between osteoporosis and polymorphisms of genes coding for enzymes
involved in the anti-oxidative defense system.[17-20]
However, the
published data about the association between GSTP1 polymorphism and
osteoporosis are so scarce. There are no reports about this
polymorphism among thalassemia patients. Therefore, this study aimed to
investigate the frequency of GSTP1 (Ile105Val) polymorphism and its
possible association with BMD values in a group of Egyptian children
and adolescents with β -TM.
Materials and Methods
Study population:
This cross sectional case-control study included 35 children and
adolescents with TM (23 males and 12 females) who were recruited from
the regular attendants of the Pediatric Hematology Clinic, Menoufia
University Hospital, Egypt. Their ages ranged from 10-18 years with a
mean age of 13.74 ±3.31 years. They were on regular packed red cell
transfusion since infancy to maintain pre-transfusion hemoglobin (Hb)
above 7.5 gm/dl and post transfusion Hb above 10gm/dl. Although, out of
the international recommendation for TM transfusion, this regimen was
the applicable one according to packed RBCs availability in our center
and the compliance degree of our patients. Patients with diabetes
mellitus (DM), abnormal thyroid functions, abnormal renal functions,
serological evidence of hepatitis B or C and those under hormonal
replacement therapy were excluded.
Thirty (15 males and 15
females), age, sex and ethnicity matched healthy children were involved
as a control group. Their ages ranged from 10-18 years with a mean age
of 14.33±2.66 years. They had normal complete blood count (CBC), Hb
electrophoresis with no previous history of anemia, blood transfusion,
liver or renal disease or family history of hemolytic anemia. They had
been randomly selected from children presenting to our general
outpatient clinic for follow up or with non-specific complaints.
The included adolescents (21 in the patient group and 22 in the controls) were non-smokers.
All
included children were of native Egyptian ethnicity, which were born
and lived in Menoufia governorate (one of Nile Delta governorates of
North Egypt).
The study was conducted between July 2012 and
December 2014. Informed consent was taken from the legal guardians of
the included children before participation and ethical clearance from
Faculty of Medicine, Menoufia University ethical committee was obtained.
Included
patients were subjected to detailed history and thorough clinical
examination. Clinico-demographic data were collected including history
of chelation during the last year and vitamin D and calcium
supplementation. Special emphasis was given for the presence of bone
pain and the history bone fractures. All patients were under regular
chelation therapy. Twenty two children (62.9%) were on regular
subcutaneous deferoxamine (DFO) infusion (30–50 mg/kg/day, 5 days/
week), 7(20 %) were on oral deferasirox (20–30 mg/kg/day) and 6
children (17.1%) were on oral deferiprone (75-100 mg/kg/day). Their
compliance for chelation therapy was 60-70% (mean of 64.4± 3.8 %,
median of 65%). According to our national recommended protocol for
thalassemia management, all patients were supplemented with vitamin D
(400 IU/day) and calcium (500 mg/day). History of splenectomy was
documented in 10 patients (28.6%).
For each participant, body
weight and height were measured by the standard methods with estimation
of body mass index (BMI = weight in kg/height in m2).
Height, weight and BMI for age Z-scores were calculated using the 2000
growth charts from the Centers for Disease Control and Prevention.[21] Sexual maturity stage was assessed according to the criteria of Tanner.[22]
Bone mineral density:
BMD evaluation was performed using dual energy X-ray absorptiometry
(DXA) (Norland–XR-46, USA, version 3.9.6/2.3.1) at lumbar spines (LS)
(L1-L4) and femoral neck (FN). The BMD, results were converted to age-
and gender-specific z scores based on the normative reference data for
BMD in Egyptian children.
Due to the considerable height deficits
for TM patients, BMD z -scores were then adjusted for height-for-age z
score (HAZ) using the equations provided by Zemel et al.[23]
According to the Pediatric Position Development Conference (PDC) of The
International Society of Clinical Densitometry (ISCD),[24]
BMD Z -scores of less than or equal to - 2, without a clinically
significant fracture history, was defined as low BMD for chronologic
age. While, osteoporosis was defined as BMD Z-scores of less than or
equal to - 2 with a clinically significant fracture history with the
term of osteopenia is no longer be used.
Laboratory investigations:
Laboratory investigations included CBC using AC920 Autocounter
(pre-transfusion values were considered for the patient group) and
quantitative colorimetric measurement of serum alanine aminotransferase
(ALT), aspartate aminotransferase (AST), blood urea, serum creatinine,
calcium (Ca), phosphorus (Ph) and total alkaline phosphatase (TALK).
Serum ferritin was estimated by a two-site immune-luminometric assay
(Byk- Sangtec Diagnostica). The mean serum ferritin level in the
previous 2 years was calculated (on the average of four determinations
per year) for each patient. Determination of osteocalcin in the serum
was performed by the Enzyme-Linked Immunosorbant Assay (ELISA) method
(Human Osteocalcin ELISA, Diagnostic Systems Laboratories, Inc.,
Webster, TX, USA).
GSTP1 genotyping:
Genomic DNA was extracted from peripheral blood leukocytes using the
QIAamp DNA Blood Mini Kit (Qiagen Hilden, Germany). DNA eluted in
buffer AE was stored at -20° C for polymerase chain reaction (PCR).
The GSTP1 Ile105Val substitution was detected by allele specific PCR restriction fragment length polymorphism (PCR-RFLP).[25]
PCR
was carried out to a total volume of 25 μl of solution containing 10 ×
PCR buffer [16.6 mmol/l (NH4)2SO4, 20.0 mmol/l MgCl2, pH 8.8, 1.2 μl
Dimethyl sulfoxide (DMSO), 1.2 μl Dithiothreitol (DTT); Genecraft,
Germany)], 100 ng of genomic DNA, 1 U of Taq DNA polymerase(Genecraft,
Germany), 200 μmol/l deoxynucleoside triphosphates(dNTPS); (Stratagene,
USA) and 25 pmol of GSTP1 primers(forward primer; 5-GTA GTT TGC CCA
AGGTCA AG-3 and reverse primer 5-AGC CAC CTG AGG GG TAAG -3., Midland,
Texas).PCR amplification was performed in a programmable Perkin Elmer
thermal cycler 2400 (USA) as follows: 94°C for 3 minutes followed by 5
cycles at 94°C for 15 seconds, 64°C for 30 seconds and 72°C for 1
minute during which the annealing temperature decreased by 1°C for each
cycle. This was followed by 30 cycles of denaturation at 94°C for 15
seconds, annealing at 59°C for 30 seconds and extension at 72°C for 1
minute followed by a final polymerization step at 72°C for 5 minutes. A
negative control (PCR without template) was included in each set of PCR
reactions. The amplification products were separated by electrophoresis
through 3% agarose gel stained with ethidium bromide with one band was
observed (442bp). The PCR product of the GSTP1 gene was then digested
by 5 U Alw261 restriction enzyme (Fermentas). The mixture was incubated
for 4 hours at 37ºC then 10 μl of the products were loaded into 3%
agarose gel containing ethidium bromide for electrophoresis and was
visualized under ultraviolet trans-illuminator. The digestion products
resulted in 329 and 113bp bands for Ile/Ile (AA; wild homozygote), 329,
216 and113bp bands for Ile/Val (AG; heterozygote for the polymorphism)
and 216 and 113bp bands for Val/Val (GG; homozygote for the
polymorphism) genotypes (Figure 1).
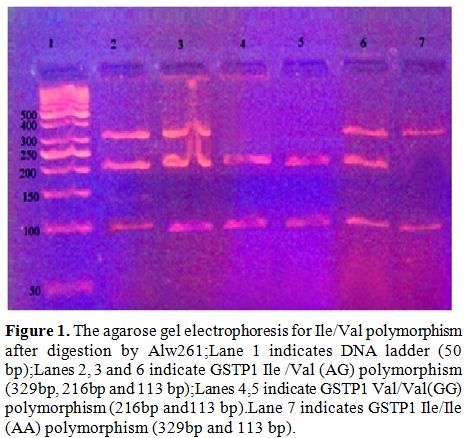 |
Figure 1. The agarose gel electrophoresis for Ile/Val polymorphism after digestion by Alw261; Lane 1 indicates DNA ladder (50 bp);Lanes 2, 3 and 6 indicate GSTP1 Ile /Val (AG) polymorphism (329bp, 216bp and 113 bp);Lanes 4,5 indicate GSTP1 Val/Val(GG) polymorphism (216bp and113 bp).Lane 7 indicates GSTP1 Ile/Ile (AA) polymorphism (329bp and 113 bp). |
Statistical Analysis.
The data were processed on an IBM-PC compatible computer using SPSS
version 16 (SPSS Inc., Chicago, IL, USA). Continuous variables were
presented as mean ± SD, while for categorical variables, numbers (%)
were used. Allele frequencies were estimated by the gene counting.
Chi-square (χ2) test was used for comparison of the categorical
variables. Student’s t- and ANOVA tests were used to compare continuous
parametric variables in two and more than two groups, respectively.
While Mann-Whitney (U) and Kruskal–Wallis tests were used for comparing
non parametric variables in two and more than two groups, respectively.
The least significant difference test (for parametric variables) and
Tukey’s honest significant difference (HSD) test (for non-parametric
variables) were applied for comparisons between individual groups when
appropriate. Pearson and Spearman Rank correlation coefficients were
applied for parametric and non-parametric data respectively. All tests
were two-tailed and p value <0.05 was considered statistically
significant.
Results
Patients characteristics:
Weight Z–score <-2 was found in 13 patients (37.1%), height Z-score
<-2 was found in 11 patients (31.4%) while BMI Z –score <-2 was
found in 8 patients (22.9%). All patients had history of bone pain.
Long bone fractures of the lower limb were documented in 2 patients
(5.7%) and were related to minor trauma.
Children with TM had
significantly lower body weight, height, BMI and their Z-scores
compared to the controls. Delayed puberty was found in 57.14% of the
patients (20/35). Patients had significantly lower pre-transfusion Hb,
significantly higher ALT, ALK, the mean yearly ferritin and osteocalcin
levels without significant difference in AST, blood urea, serum
creatinine, calcium or phosphorous compared to the controls (Table 1).
Hypocalcemia was diagnosed in 3 patients (8.57%) and hyperphosphatemia
was found in 2 patients (5.71%). These 5 patients had
hypo-parathyrodism.
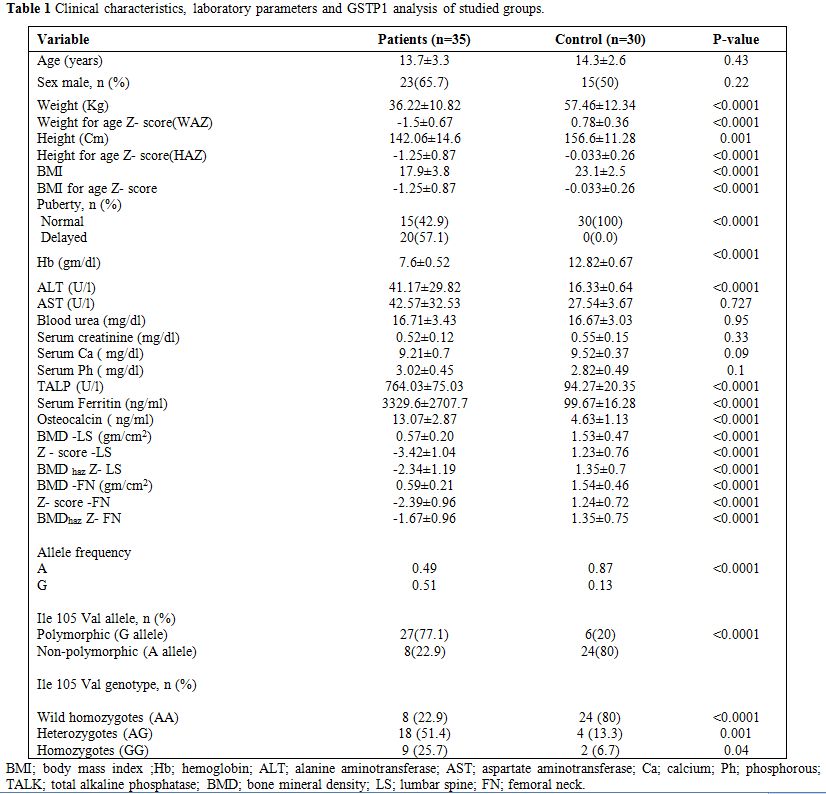 |
Table 1. Clinical characteristics, laboratory parameters and GSTP1 analysis of studied groups. |
DXA study revealed significant lower BMD values and Z
–scores as well as BMD haz Z-scores at both LS and FN in TM patients
compared to the controls (p<0.0001) (Table 1).
Low for chronological age BMD Z–scores at LS and FN were found in
88.57% (31/35) and 57.14% (20/35) of the patients respectively.
Applying HAZ adjusted values, low for chronological age BMDhaz
Z scores were found in 51.43% (18/35) and in 40% (14/35) of the
patients at LS and FN respectively. Osteoporosis was diagnosed in 2
male patients (5.7%). There was no significant difference between males
and females in any of the tested parameters including DXA scan
parameters (p>0.05) (Table 3).
Both
BMD Z-score at LS and its HAZ adjusted values had significant inverse
correlation with serum ferritin (r=-0.525, p=0.001 and r=-0.433,
p=0.009, respectively; Figure 2). Both FN-BMD Z-score and its HAZ
adjusted values had a negative correlation trend with serum ferritin
(r=-0.33, p=0.05).
GSTP1 genotyping:
The 105Val allele was found in 50.77% (33/65) of all studied children
(the patients and the controls), with an allele frequency of 0.338 in
the whole group, 0.51 in the patient group and 0.13 in the control
group. The allele frequency and the polymorphism relative subgroups
frequency (homozygotes and heterozygotes) were significantly prevalent
in TM children compared to the controls (p<0.0001) (Table 1).
Comparison of different GSTP1 genotypes:
Among children with TM, no significant difference was found in the
clinical parameters between Ile105Val polymorphism genotype subgroups.
Patients with Ile105Val polymorphism (homozygotes and heterozygotes)
had significant lower BMD- LS, BMD LS-Z- score, FN- BMD and FN - BMD
haz Z-score (p<0.05) with modest significant lower BMDhaz
Z-score at LS (p=0.05) than those without this polymorphism. No
significant difference was found in any of the tested biochemical
parameters between patients with Ile105Val polymorphism and those who
do not carry this polymorphism. Significant association was found
between Ile105Val polymorphism genotype subgroups and BMD (p<0.05).
Post hoc analysis revealed that heterozygotes had significant
lower FN-BMD and FN-BMDhaz Z-score
(p=0.006 and 0.02, respectively) with modest lower LS- BMD (p=0.05) and
LS- BMD Z-score (p=0.08) compared to the wild homozygotes. In
comparison to wild homozygotes, Ile105Val polymorphism homozygotes had
significant lower LS-BMD (p=0.029), LS-BMD Z–score (p=0.008), LS- BMDhaz Z-score (p=0.011),FN- BMD (p=0.001),FN- BMD Z–score (p=0.02) and FN- BMDhaz Z-score (p=0.001). Polymorphism homozygotes also had a trend of lower LS- BMDhaz
Z-score than the heterozygotes (p=0.09). Osteocalcin level was
significantly higher in the polymorphic homozygotes compared to
heterozygotes and wild homozygotes (p=0.012 and p=0.013, respectively).
No significant difference was observed regarding the other tested
parameters (Table 2, Figure 3).
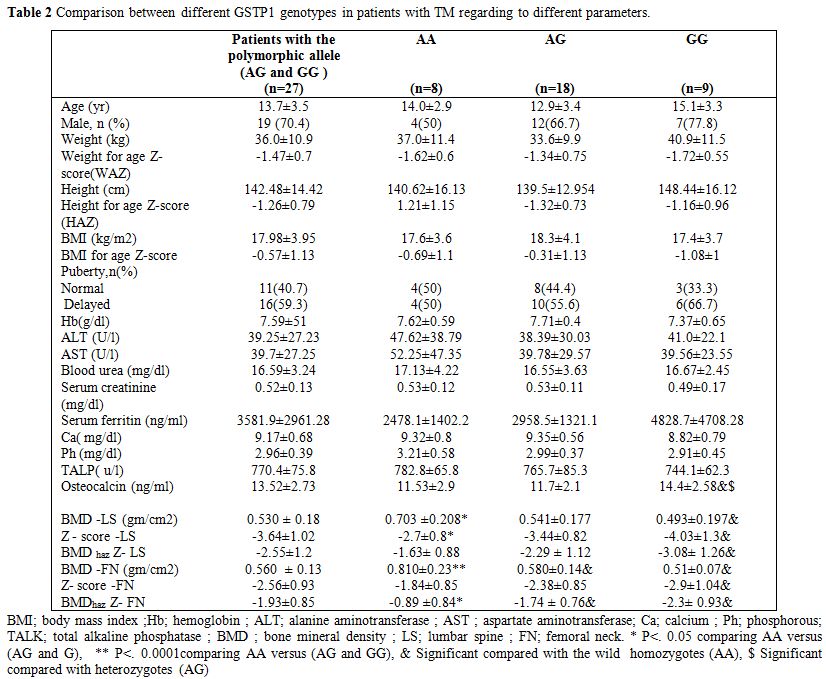 |
Table 2. Comparison between different GSTP1 genotypes in patients with TM regarding to different parameters. |
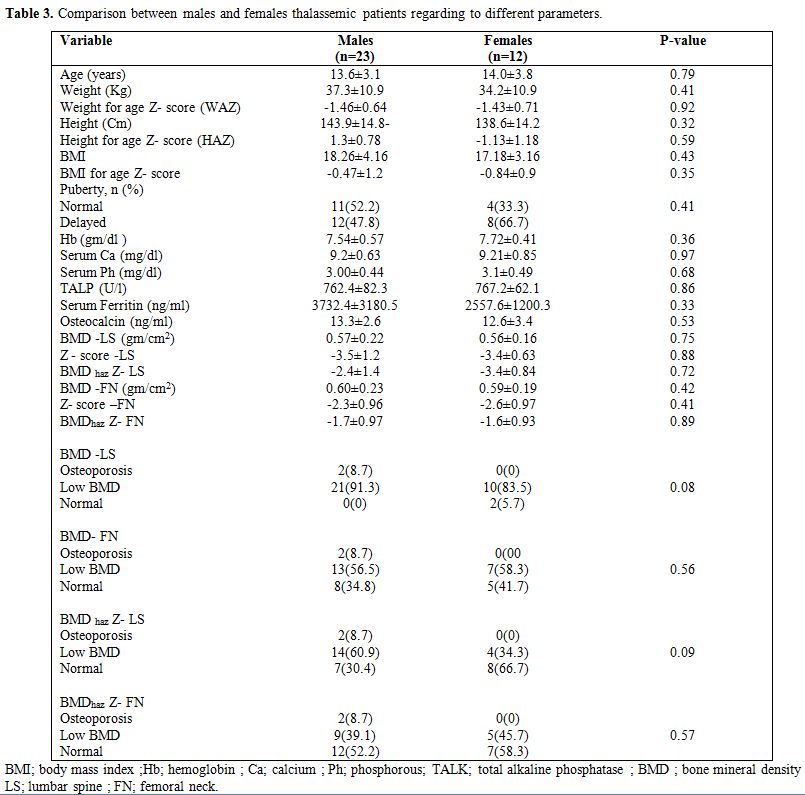 |
Table 3. Comparison between males and females thalassemic patients regarding to different parameters. |
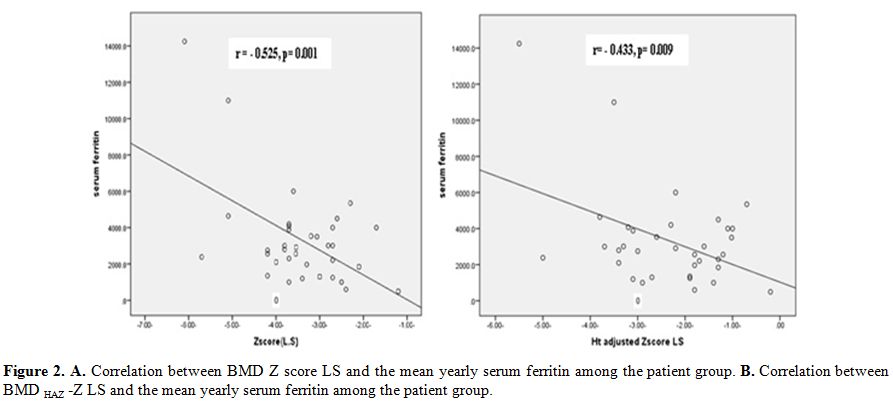 |
Figure 2. A. Correlation between BMD Z score LS and the mean yearly serum ferritin among the patient group. B. Correlation between BMD HAZ -Z LS and the mean yearly serum ferritin among the patient group |
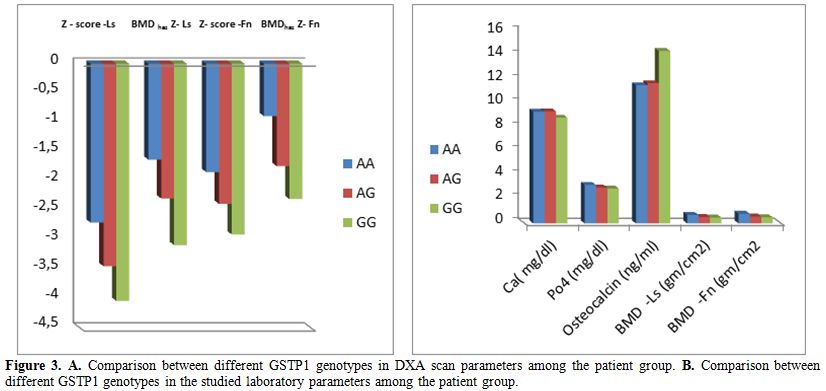 |
Figure 3. A. Comparison between different GSTP1 genotypes in DXA scan parameters among the patient group. B. Comparison between different GSTP1 genotypes in the studied laboratory parameters among the patient group. |
Discussion
Several lines of evidence have found a tight association between oxidative stress and its genetic control and reduced BMD.[14-20]
For
the first time, we investigated the frequency of GSTP1 Ile105Val
polymorphism in a group of children with TM compared to age, sex and
race matched healthy non-related Egyptian children.
Distinct ethnic differences exist in the frequency of this polymorphism.[26]
The
polymorphic allele was found in 50.77% (33/65) of all included
children. The detected allele frequency of 0.338 and genotype
distribution (49.23%, 33.85% and 16.92% for Ile/Ile, Ile/Val and
Val/Val genotypes, respectively) are more or less similar to what was
reported among Africans (0.343 for the allele frequency and the 45.14%,
41.09% and 13.77 for Ile/Ile, Ile/Val and Val/Val genotypes,
respectively.[27,28]
Little data are available
about Ile 105Val polymorphism among Egyptians. In 300 Egyptians
subjects (112 with type 2 DM and 188 healthy), this polymorphism was
found in 23.33 % of the studied group (70 out of 300); all were
heterozygotes with an allele frequency of 0.116.[29]
The difference between these results and that of our study could be
related to the difference in the sample size or the included primary
disease category.
Ile 105Val polymorphism (both in hetero- and
homozygous states) was significantly prevalent among TM patients than
the controls. As far as we know, no similar studies were done among
patients with thalassemia to compare. Nevertheless, this polymorphism
was studied among patients with sickle cell anemia (SCA) with
contradictory results. In a Brazilian study, significant higher
frequency of 105Val polymorphism both in hetero- and homozygous
states was found among SCA patients than the controls.[30]
However, similar allele frequencies and genotype distribution of this
polymorphism were found in 50 Egyptian SCA patients and healthy
controls in another study.[31] Higher frequency of
105Val polymorphism among β-thalassemia patients detected in this work
and among SCA patients in the previous Brazilian study[30] compared to the healthy controls may suggest genetic linkage between,GSTP1 gene (11q13) and β- globin gene (11p15).
Oxidative
stress related osteopathy may be related to several mechanisms.
Reactive oxygen species (ROS) could antagonize Wnt signaling required
for osteo-blastogenesis, thereby attenuating bone formation.[32]
Furthermore, hydrogen peroxide-induced oxidative stress inhibits
osteoblastic differentiation via extracellular signal-regulated kinases
(ERKs) and ERK dependent nuclear factor-κB (NF-κB) signaling pathway.[33]
GSTP1 iso-enzymes play a regulatory role in cellular signaling involved in controlling stress response.[34]
Its bone protective action is exerted through coordinated
regulation of stress kinases (increase p38, ERK, and NF-κB activities
together with suppression of JNK signaling), thus contributing in
protection against ROS-mediated bone cell apoptosis.[33,35]
Ile105Val
polymorphism is located within the active site of the enzyme. This
augments its importance in reducing enzyme activity with increased cell
sensitization to free radical-mediated damage.[36] Hence, it may be considered as a possible predisposing factor for ROS associated diseases like osteoporosis.
Thalassemia
major is a disease of enhanced oxidative stress and high ROS levels, in
which iron overload is the master player via the Fenton reaction.[37]
So,
this disease is a good candidate for the influence of genetic
polymorphism affecting the oxidative process especially Ile 105 Val
polymorphism. To our knowledge, this study is the first attempt to
evaluate the effect of this polymorphism with regard to BMD among
thalassemia patients. It also has the novelty of application of HAZ
adjusted BMD Z–scores as a more reliable measure for children with
linear growth or maturation delay like TM children.[24]
Ile
105Val polymorphism was significantly prevalent among our studied TM
children - with their high prevalence of low BMD - compared to the
controls. In addition, the salient finding of this study was the
presence of significant association between 105Val allele even in the
heterozygous state and reduced BMD in these children. These findings
could raise the assumption that this polymorphism plays a role in their
predisposition to reduced BMD.
Osteocalcin is an important marker of bone turnover.[38]
Its detected high level among the studied TM patients could indicate
that these patients had preserved bone formation despite severe bone
destruction.[39]
Among the studied TM patients,
105Val allele in the homozygous state was significantly associated with
high osteocalcin level. This finding could suggest a possible role of
this polymorphism in enhancing bone turnover among thalassemia patients.
Data from the only similar published study performed on Slovenian women,[40]
revealed some consistent findings with this study. The authors reported
significant association between Ile105Val genotype subgroups and
osteocalcin levels in osteopenic post-menopausal women being
significantly higher in 105Val polymorphism homozygotes compared to the
wild homozygotes. In contrast to our results, the researchers detected
non-significant increase in BMD values at all tested sites (LS and FN)
in the heterozygotes with non-significant reduction of these values in
the homozygotes of this polymorphism. Co-inheritance of 105Val and 114
Val alleles caused borderline significant lower BMD –FN values and
increased osteocalcin concentrations compared to carriers lacking this
combination.
The discordance between our results and that of the
Slovenian study might be partly due to the difference in the included
populations and to what is known that the 105 Val allele exhibits
different activity, affinity and thermo-stability according to
substrates.[41] Furthermore, phenotypic expression of
GSTP1 polymorphisms could be mediated by interactions with other
polymorphic loci of other GST family genes.[40]
The
underlying mechanisms of iron induced low BMD are not fully elucidated
yet. In vitro data indicated that iron-induced bone damage was
predominantly attributable to ROS mediated disequilibrium between bone
formation and resorption.[42]
Although less
reliable, serum ferritin is the wildly accepted parameter of iron
overload among thalassemia patients in clinical practice.[43]
The
results of this study revealed significant inverse correlation between
LS-Z-score and its HAZ adjusted values with the mean yearly serum
ferritin level indicating the contribution of iron overload on reduced
BMD which comes in line with what was reported.[4]
Few
previous studies have investigated the effect GSTM1 and GSTT1 genes
polymorphisms on iron overload among thalassemia patients with
controversial results[44-47] without data for GSTP1 polymorphism in this regard.
No
significant association was found between 105Val polymorphism and the
mean yearly serum ferritin as an estimate for iron overload among the
studied TM patients. So, we could assume that, the deleterious impact
of 105Val allele on BMD among TM patients was not through favoring more
iron overload, but it could be through enhancing iron generated ROS
damaging effect.
Iron overload-induced hypogonadotropic hypogonadism with delayed puberty is another mechanism of osteoporosis in TM patients.[39]
In this work delayed puberty did not differ among different Ile105Val
genotypes, a finding that excludes delayed puberty as a conflicting
factor. Moreover, exclusion of smokers eliminates the confounding
effect of smoking.
The small sample size and the single locality are the limitation of this study. So, our results could be considered preliminary.
Regarding
the effect of ethnicity, it is known that, the vast majority of the
Egyptians (98%) have the Egyptian (Arabs) ethnicity, while other
ethnicities constitute the minority [Berber, Nubian, Bedouin, and Beja
about 1%, Greek, Armenian, other European (primarily Italian and
French) about 1%]. All participants of this study (the patients and the
controls) were ethnically homogeneous as they are native Peasant
Egyptians. Moreover, all of them originated from the same environment
and have similar lifestyles. This could reduce the possibility of
ethnic difference influence.
Conclusions
Ile 105Val polymorphism was significantly prevalent among the studied TM children compared to the controls. This polymorphism was associated with a remarkable reduction of BMD and elevation of osteocalcin levels especially among the homozygotes. This could highlight the significant relevance of this polymorphism as a candidate gene for osteoporosis in TM patients. The results affirm the hypothesis that ineffective ROS detoxification may be a risk for decreased BMD values. Multicenter studies with large samples and on other ethnic populations are required to confirm these findings.
References

[TOP]