Diagnosis and Prognosis Evaluation of Severe Pneumonia by Lung Ultrasound Score Combined with Serum Inflammatory Markers

Bo Fu1, Peng Zhang2 and JunHua Zhang2.

Department of Ultrasound Diagnosis, Gansu Provincial Hospital, Lanzhou City, Gansu Province, 730000, China.
2 Department of Intensive Care Medicine, Gansu Gem Flower Hospital, Lanzhou City, 730060, Gansu Province, China.


Correspondence to: JunHua Zhang, Department of Intensive Care Medicine, Gansu Gem Flower Hospital, No. 733 Fuli West Road, Xigu District, Lanzhou City, 730060, Gansu Province, China, Email: zhangjhstary@dmu-edu.cn.

Published: November 1, 2023
Received: February 08, 2023
Accepted: October 01, 2023
Mediterr J Hematol Infect Dis 2023, 15(1): e2023057 DOI 10.4084/MJHID.2023.057

This is an Open Access article distributed under the terms of the Creative Commons Attribution License
(
https://creativecommons.org/licenses/by-nc/4.0), which permits unrestricted use, distribution, and reproduction in any medium, provided the original work is properly cited.

Abstract

Introduction: To analyze the significance of lung ultrasound score (LUS) combined with serum inflammatory indexes in different severities of severe pneumonia and its clinical value on prognosis.
Methods: 100 patients with severe pneumonia treated in the Gansu Provincial Hospital from June 2017 to June 2021 were selected as the research objects. According to the acute physiology and chronic health (APACHE II) score, they were divided into a low-risk group (28 cases), a medium-risk group (39 cases) and a high-risk group (33 cases). The general clinical data of the patients (age, gender, smoking history, and underlying diseases) were collected, the lung ultrasound score (LUS) of the patients was measured, and the serum inflammatory indicators (IL-6, IL-10, TNF-α, CRP and NLR) levels; Pearson correlation analysis to evaluate the correlation between LUS score, serum inflammatory index levels and disease severity; receiver operating characteristic (ROC) curve analysis to evaluate the prognostic value of the combined diagnosis of LUS score and serum inflammatory index for the severity of severe pneumonia.
Results: With the increase in the severity of severe pneumonia, the LUS score and the level of inflammation in the body continued to increase, and LUS combined with serum inflammatory indexes could distinguish the severity of low-risk, medium-risk and high-risk severe pneumonia and had high diagnostic value. In addition, the combined diagnosis of LUS and serum inflammatory markers is also closely related to the prognosis of patients with severe pneumonia, which can distinguish the prognosis.
Conclusion: LUS combined with serum inflammatory indicators (IL-6, IL-10, TNF-α, CRP and NLR) can differentiate the severity and prognosis of severe pneumonia, which may be a new direction for diagnosing severe pneumonia and guide early clinical intervention.


Introduction

Pneumonia is one of the most common clinical infectious diseases, which refers to the terminal pulmonary airway, which occurs after the body is damaged by pathogens, drugs, physical and chemical factors, and immune factors.[1-3] Bacterial pneumonia is the most common inflammation of the alveoli and pulmonary interstitium.[4] Severe pneumonia is a pulmonary infection that progresses from lung tissue inflammation to a certain stage to form organ dysfunction.[5] According to statistics, about 20% of hospitalized patients with pneumonia are severe patients, and the disease develops rapidly, with a fatality rate as high as 30%-50%, which seriously endangers the life and health of patients.[6-8] At present, most of the criteria for clinical diagnosis of severe pneumonia refer to the 2009 Infectious Diseases Society of America (IDSA)/American Thoracic Society (ATS) guidelines. In order to simplify procedures, an attempt is made to optimize the clinical diagnosis of severe pneumonia by adopting new simplified standards; however, it is relatively time-consuming and may cause delays in the treatment of critically ill patients.[9,10] Therefore, continuously optimizing the clinical diagnosis of severe pneumonia has become a research hotspot in recent years.[11]
Lung ultrasound is a means of analyzing lung lesions based on ultrasound artefacts.[12] When lung lesions occur, the total amount of gas in the alveoli decreases, and the mixture of liquid and gas produces high-acoustic impedance ultrasound artefacts.[13] The normal and abnormal images are judged according to the artefacts.[14] With the rapid development of modern ultrasound technology, it has a wide range of clinical application prospects.[15] Lung ultrasound score (LUS) has gradually become one of the green means of lung disease examination.[16] In addition to obtaining accurate imaging results, necessary laboratory inflammatory markers are also very important, including interleukin-6 (IL-6), interleukin-10 (IL-10), tumor necrosis factor-α (TNF-α), C-reactive protein (CRP), neutrophil/lymphocyte ratio (NLR) and other large release are important factors that cause secondary injury, which not only helps in the clinical assessment of the condition but also can determine the prognosis and outcome of patients.[17-19] In recent years, the research on LUS and serum inflammatory indicators has been increasing, and it is believed that the combination of the two can reflect the degree of infection and disease status of patients.[20] However, there are few studies on applying LUS and serum inflammatory indicators in severe pneumonia, and no obvious answer has been given. This article will analyze the clinical data of 100 patients with severe pneumonia treated in our hospital from June 2017 to June 2021 and analyze the significance of LUS combined with serum inflammatory indexes in different severities of severe pneumonia and its clinical value on prognosis.

Materials and Methods

General information. One hundred patients with severe pneumonia treated in Gansu Provincial Hospital from June 2017 to June 2021 were selected as the research objects. Inclusion criteria: meet the diagnostic criteria established by the American Society of Infectious Diseases and Thoracic Society in 2007 (Table 1); age 18-70; good patient compliance; complete clinical data. Exclusion criteria: patients with severe liver and kidney insufficiency; patients with low immune function; patients with severe diseases of the blood system and immune system; patients with immunosuppression; patients with advanced liver cirrhosis, acute stroke, and malignant tumors. The study conformed to clinical ethical standards and was approved by the Gansu Baoshi Flower Hospital ethics committee (Approval Number:201703GS71). All patients or their families gave informed consent to this study.

Table 1
Table 1. Diagnostic criteria for severe pneumonia.

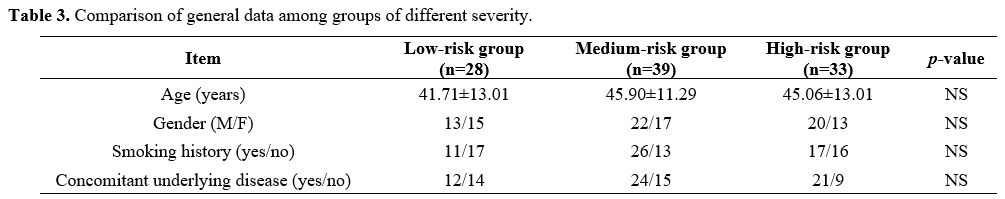
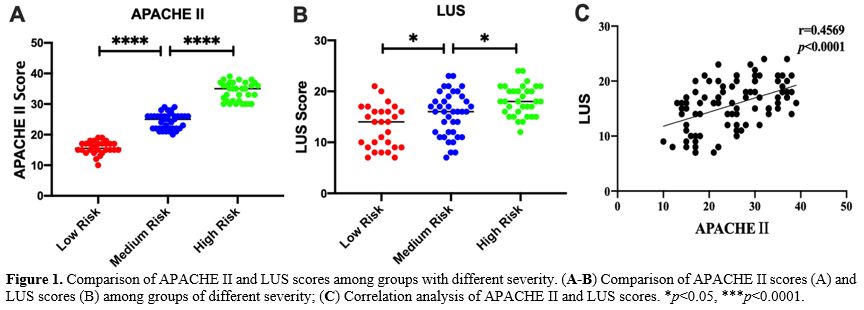
Collecting data. Electronic medical records were used to collect general information about all patients, including age, gender, smoking history, and underlying diseases. Acute Physiological and Chronic Health Score (APACHE II) was performed within 24 hours of admission to assess the severity of the disease.
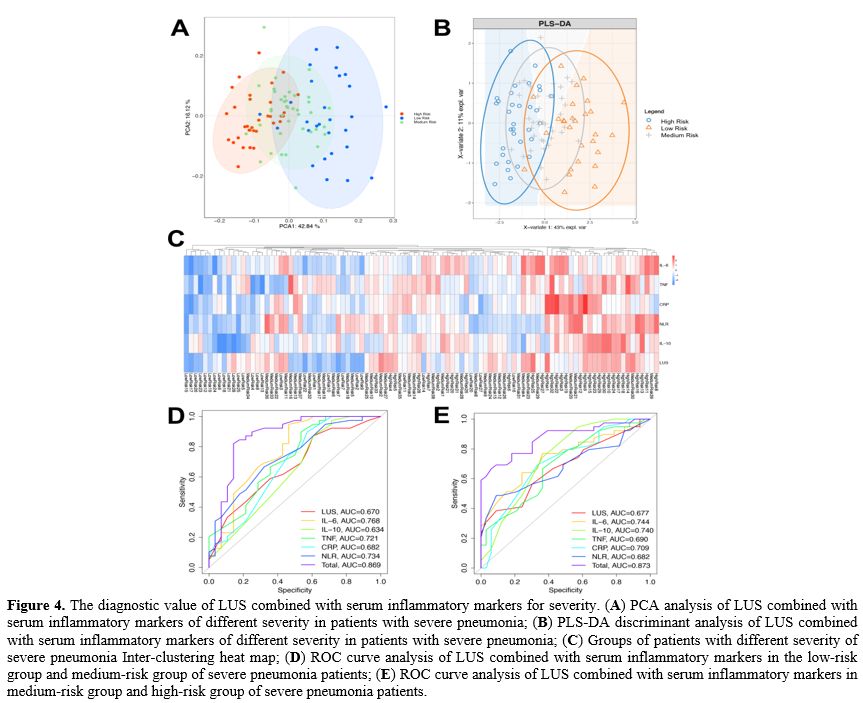
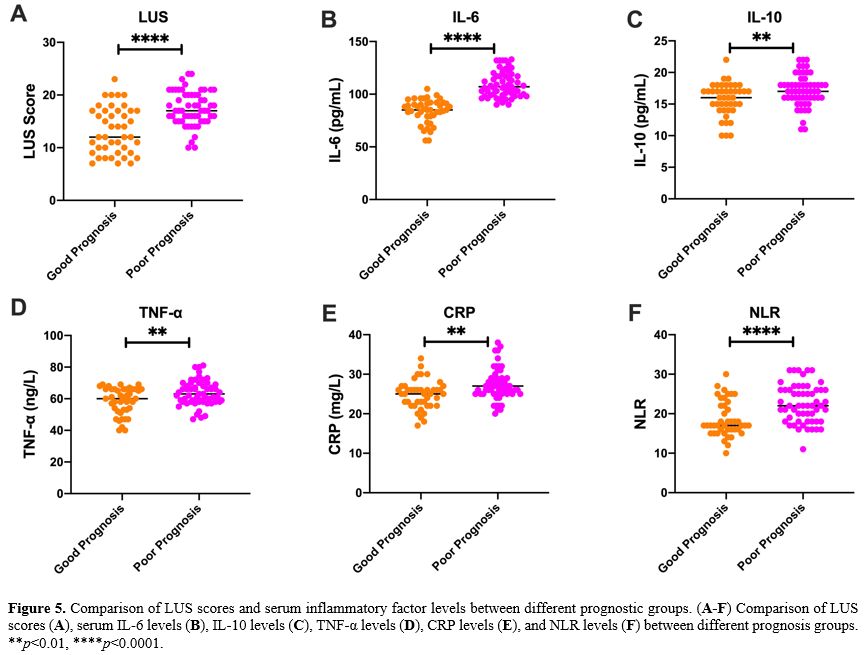
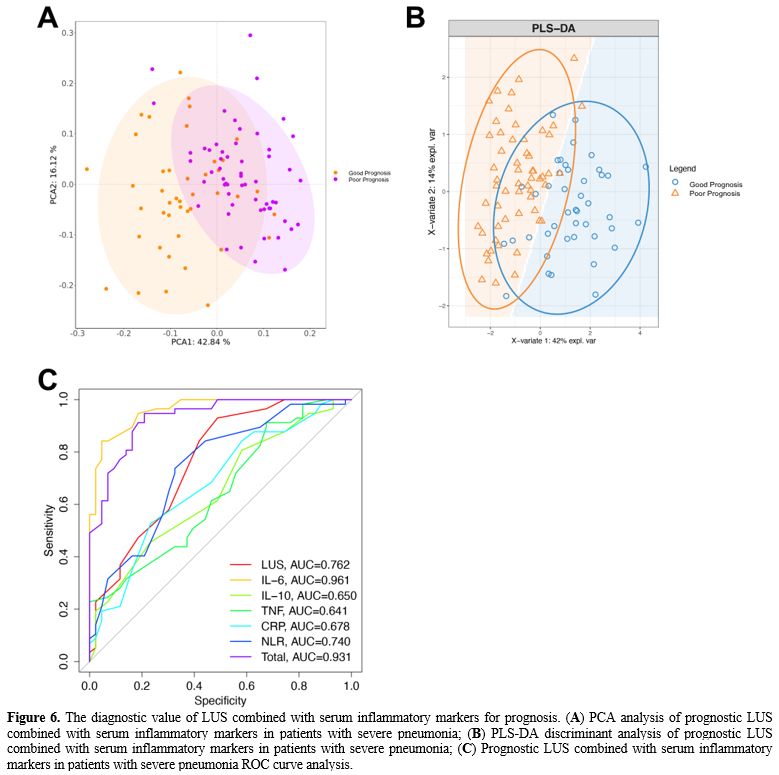
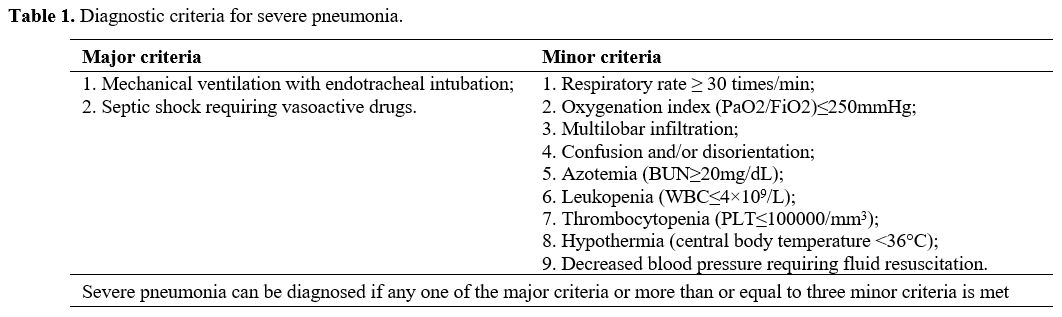
Grouping method. According to the severity of the disease, patients with severe pneumonia were divided into low-risk (LR) group (APACHE II score <20 points), medium-risk (MR) group (APACHE II score of 20-30 points) and high-risk (HR) group (APACHE II score ≥30 points). All patients were followed up for 30 days and were divided into a good prognosis (GP) group (recovered and discharged without sequelae) and a poor prognosis (PP) group (patients died or survived but had severe sequelae) according to their prognosis.
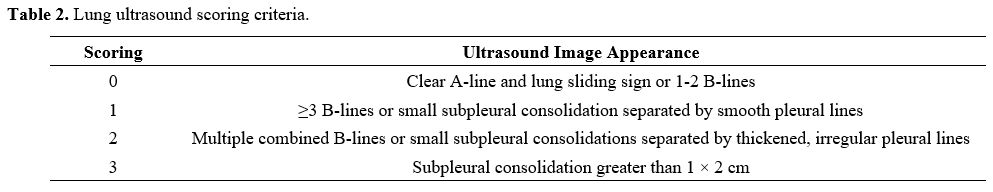
Lung Ultrasound Score (LUS). Lung ultrasonography was performed within 24 hours after admission using a SonoSound portable ultrasonograph (Sonosite, USA). The reference method was used to perform lung ultrasound division. The patient is supine and examined using the twelve-zone method. Each side is divided into three zones: anterior, lateral, and posterior, through the anterior and posterior axillary lines. Further division occurs within these zones; the three zones are divided into upper and lower parts at the horizontal position of the fourth rib space of the anterior chest (second or third rib space for women) connected by two nipples.[21,22]. Examination field: Examine each lung area in the longitudinal plane, examine each intercostal space present in this area in the transverse plane, and examine at least one complete respiratory cycle at each point. Each area was scored according to the examination results (Table 2), and all areas were aggregated to calculate the final score.[23] When there were multiple ultrasound findings in one area, the maximum value was taken. The lowest score is 0, and the highest score is 36. The higher the score, the more severe the mixed lung disease.


Table 2
Table 2. Lung ultrasound scoring criteria.

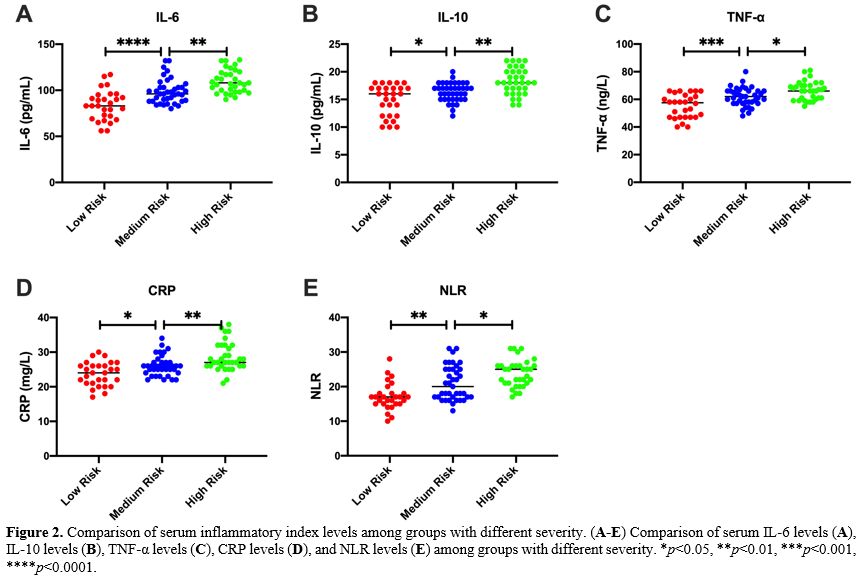
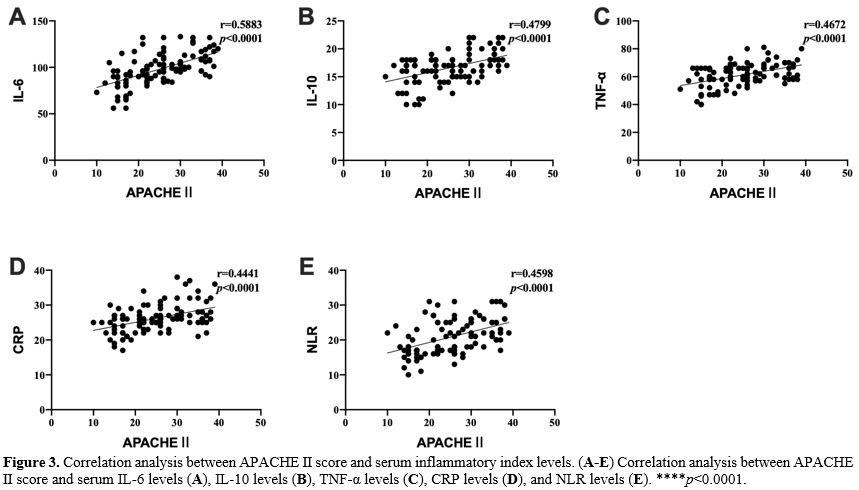
Detection of serum inflammatory markers. 5 mL of peripheral blood was drawn from the patient 24 h after admission, and serum samples were collected by centrifugation at 3000 g for 15 min. Serum IL-6, IL-10, TNF-α, CRP and NLR (neutrophil/lymphocyte) were detected using a Multiskan FC microplate reader (Thermo Company, USA) and ELISA kit (Nanjing et al., China). According to the ELISA kit instructions, add 50 μL of the diluted standards and samples to a 96-well plate and incubate at 37 °C for 30 min. After washing five times with the washing solution, add 50 μL of Reagent A (negative control tube) and 50 μL of Reagent B (assay tube) and incubated at 37 °C for 10 min, then 50 μL of stop solution was added to each well. Read the absorbance on a microplate reader and determine the sample concentration according to the standard curve.
Statistical methods. SPSS 22.0 statistical software was used to analyze and process the data, and GraphPad 8.0 software was used for drawing. T-test or chi-square test was used to compare two groups, and the one-way analysis of variance or Kruskal Wallis test was used to compare multiple groups. p < 0.05 was considered statistically significant.

Results

Comparison of general data among groups of different severity. Among all 100 patients with severe pneumonia, there was no significant difference in age, gender, smoking history and underlying diseases between groups of different severity (p>0.05) (Table 3).

Table 3
Table 3.. Comparison of general data among groups of different severity.

Comparison of APACHE Ⅱ and LUS scores among groups with different severity. The APACHE II and LUS scores exhibited significant variations across the three groups as the disease severity escalated. (p < 0.05) (Figure 1A-B). The relationship between the APACHE II score and the LUS score was examined by performing the Pearson correlation analysis; the results showed that the LUS score was positively correlated with the APACHE II score (p < 0.0001) (Figure 1C).

Figure 1
Figure 1. Comparison of APACHE II and LUS scores among groups with different severity. (A-B) Comparison of APACHE II scores (A) and LUS scores (B
among groups of different severity; (C) Correlation analysis of APACHE II and LUS scores. *p<0.05, ***p<0.0001.

Comparison of serum inflammatory index levels among groups with different severity. Subsequently, we analyzed the expression patterns of serum inflammatory markers among patients with severe pneumonia. The results showed that with the increase in the severity of severe pneumonia, the levels of IL-6, IL-10, TNF-α, CRP and NLR in serum gradually increased (p < 0.0001, p < 0.01, p < 0.05, p < 0.001 ) (Figure 2). Moreover, the results showed that the APACHE Ⅱ score was closely related to IL-6, IL-10, TNF-α, CRP and NLR levels, suggesting that with the increase in the severity of severe pneumonia, the level of inflammation in the body was also increasing (p < 0.0001) (Figure 3).

Figure 2 Figure 2. Comparison of serum inflammatory index levels among groups with different severity. (A-E) Comparison of serum IL-6 levels (A), IL-10 levels (B),
TNF-α levels (C), CRP levels (D), and NLR levels (E) among groups with different severity. *p<0.05, **p<0.01, ***p<0.001, ****p<0.0001.


Figure 3
Figure 3. Correlation analysis between APACHE Ⅱ score and serum inflammatory index levels. (A-E) Correlation analysis between APACHE Ⅱ score and serum
IL-6 levels (A), IL-10 levels (B), TNF-α levels (C), CRP levels (D), and NLR levels (E). ****p<0.0001.

The diagnostic value of LUS combined with serum inflammatory markers for severity. Unsupervised PCA analysis and supervised PLS-DA discriminant analysis were conducted on severe pneumonia patients with LUS (Figure 4A-B), and the results showed that patients with severe pneumonia of different severity were similar within groups and significantly different between groups. The heat map of cluster analysis showed that the LR, MR, and HR groups were hierarchically clustered, suggesting that LUS combined with serum inflammatory markers could distinguish different severity of severe pneumonia (Figure 4C).
The diagnostic value of LUS and serum inflammatory index on the severity of severe pneumonia was analyzed by ROC curve and AUC. The results showed that the diagnostic value of LUS combined with serum inflammatory markers for severity was higher than the single diagnostic value of LUS score and serum IL-6, IL-10, TNF-α, CRP and NLR levels (Figure 4D-E).


Figure 4
Figure 4. The diagnostic value of LUS combined with serum inflammatory markers for severity. (A) PCA analysis of LUS combined with serum inflammatory 
markers of different severity in patients with severe pneumonia; (B) PLS-DA discriminant analysis of LUS combined with serum inflammatory markers of 
different severity in patients with severe pneumonia; (C) Groups of patients with different severity of severe pneumonia Inter-clustering heat map; (D) ROC 
curve analysis of LUS combined with serum inflammatory markers in the low-risk group and medium-risk group of severe pneumonia patients; (E) ROC 
curve analysis of LUS combined with serum inflammatory markers in medium-risk group and high-risk group of severe pneumonia patients.

Comparison of LUS scores and serum inflammatory factor levels between different prognostic groups. All patients were followed up for 30 days; 43 cases were in the GP group, and 57 were in the PP group. Among them, the LUS score and the serum inflammatory factor levels of the PP group were significantly higher than those of the GP group (p < 0.0001, p < 0.0001, p < 0.01) (Figure 5A-F), suggesting that the LUS score and serum inflammatory factor levels are also related to the prognosis of patients with severe pneumonia.

Figure 5
Figure 5. Comparison of LUS scores and serum inflammatory factor levels between different prognostic groups. (A-F) Comparison of LUS scores (A), serum 
IL-6 levels (B), IL-10 levels (C), TNF-α levels (D), CRP levels (E), and NLR levels (F) between different prognosis groups. **p<0.01, ****p<0.0001.

The diagnostic value of LUS combined with serum inflammatory markers for prognosis. Unsupervised PCA and PLS-DA discriminant analyses were performed on the prognosis of severe pneumonia patients with LUS combined with serum inflammatory indicators. The results suggested that the prognosis of patients with severe pneumonia was similar within the group, and the difference between the groups was significant (Figure 6A-B). The diagnostic value of LUS and serum inflammatory markers in the prognosis of severe pneumonia was analyzed by ROC curve and AUC. The results showed that the diagnostic value of LUS combined with serum inflammatory markers for prognosis was higher than the single diagnostic value of LUS score and serum IL-10, TNF-α, CRP and NLR levels, suggesting that LUS combined with serum inflammatory markers had a higher prognosis for severe pneumonia. (Figure 6C).

Figure 6
Figure 6.. The diagnostic value of LUS combined with serum inflammatory markers for prognosis. (A) PCA analysis of prognostic LUS combined with serum 
inflammatory markers in patients with severe pneumonia; (B) PLS-DA discriminant analysis of prognostic LUS combined with serum inflammatory markers 
in patients with severe pneumonia; (C) Prognostic LUS combined with serum inflammatory markers in patients with severe pneumonia ROC curve analysis.


Discussion

Severe pneumonia is one of the most common critical infectious diseases in clinical practice.[24] It is mainly characterized by ferocity and rapid progress. Most patients often develop from a simple pulmonary infection to a systemic one.[25] The local inflammation in pneumonia results from pathogen infection and the body's reactivity. The entry of infectious agents into the lungs can stimulate alveolar macrophages, produce a large number of inflammatory factors, and mediate the migration of inflammatory cells in the peripheral circulation, exacerbating the severity of pneumonia. Therefore, timely and effective assessment of the severity of the patient's disease and constant treatment guidance to achieve clinical stability as soon as possible are of great significance in reducing the mortality rate and improving the prognosis of patients with severe pneumonia. This study analyzed the diagnostic value of LUS combined with serum inflammatory markers for the severity and prognosis of severe pneumonia and evaluated its feasibility in the prevention and management of severe pneumonia. The results showed that with the increase in the severity of severe pneumonia, the LUS score and the level of inflammation in the body continued to increase, and the combination of LUS and serum inflammatory indicators could distinguish the severity of low-risk, medium-risk and high-risk severe pneumonia, with a higher diagnosis value. In addition, the combined diagnosis of LUS and serum inflammatory markers is also closely related to the prognosis of patients with severe pneumonia, which can distinguish the prognosis and guide early clinical intervention.
IL-6, IL-10, TNF-α, and CRP are widely recognized as canonical inflammatory factors and significantly contribute to the pathogenesis of diverse inflammatory disorders. These factors possess the ability to stimulate human neutrophils and lymphocytes, thereby eliciting immune responses.[26] Moreover, NLR represents a promising biomarker that can effectively reflect immune dysregulation and systemic inflammatory reactions within the organism.[27] Studies in recent years have shown that the levels of IL-6, IL-10, TNF-α, CRP and NLR are closely related to the pathogenesis of pneumonia.[28,29] Some studies have shown that in cases of COVID-19, especially in severe cases, the level of such inflammatory-related factors and indicators is valuable for judging the prognosis of severe COVID-19 and is closely related to the severity of the disease.[30,31] Consistent with the results of this study, as the severity of severe pneumonia increases, the levels of IL-6, IL-10, TNF- α, CRP and NLR were significantly increased.
Additionally, patients with an unfavorable prognosis exhibited heightened levels of pro-inflammatory factors. The serum inflammatory factor levels were closely related to the severity and prognosis of severe pneumonia. To some extent, it partially reflects the immune inflammatory characteristics exhibited by patients with severe pneumonia, thereby holding substantial importance in elucidating the pathogenesis and forecasting outcomes. However, the integration of multiple inflammatory factors with clinical practice has the potential to enhance the accuracy and precision of predictions. Based on this, we explored the clinical utility of combining inflammatory factors with LUS in predicting the severity and prognosis of severe pneumonia.
The lung ultrasound (LUS) significance in the diagnosis and assessment of pneumonia has been acknowledged.[32-34] Our findings indicate a positive association between the disease severity and the LUS score. Additionally, we performed correlation analysis, which revealed a positive correlation between the LUS score and the clinical Acute Physiology and Chronic Health Evaluation II (APACHE II) score. Furthermore, LUS, in conjunction with clinical manifestations and laboratory findings, exhibits a notable level of sensitivity and specificity, thereby serving as a valuable tool for guiding pneumonia treatment and monitoring disease progression.[34,35] In order to assess the diagnostic and predictive efficacy of serum inflammatory factor levels and LUS scores, we employed unsupervised PCA analysis, supervised PLS-DA analysis, and cluster heatmap analysis. Our findings indicate that integrating serum factor levels and NLR with LUS scores effectively differentiates the severity and prognosis of patients with severe pneumonia. Furthermore, using ROC curves and AUC to examine the combination of serum inflammatory-related factors and NLR with LUS scores demonstrates a heightened diagnostic value. The combined diagnosis of LUS and serum inflammatory markers helps judge the disease progression of patients with severe pneumonia, identifying disease prognosis as early as possible and providing guidance for early clinical diagnosis and treatment.


Conclusion

LUS combined with serum inflammatory indicators (IL-6, IL-10, TNF-α, CRP and NLR) can differentiate the severity and prognosis of severe pneumonia, and that may be a new direction for severe pneumonia diagnosis and early clinical intervention guide.


References   

  1. Cheng Y N, Huang W C, Wang C Y, et al. Compared the Microbiota Profiles between Samples from Bronchoalveolar Lavage and Endotracheal Aspirates in Severe Pneumonia: A Real-World Experience[J]. J Clin Med,2022,11(2). https://doi.org/10.3390/jcm11020327 PMid:35054022 PMCid:PMC8778781
  2. Zhang H, Luo M. Correlation between serum vitamin D expression and changes of immune indexes in children with pneumonia of different degrees[J]. Pak J Pharm Sci,2021,34(6(Special)):2467~2472.
  3. Goyal J P, Kumar P, Mukherjee A, et al. Risk Factors for the Development of Pneumonia and Severe Pneumonia in Children[J]. Indian Pediatr,2021,58(11):1036~1039. https://doi.org/10.1007/s13312-021-2369-1 PMid:34837363 
  4. Tang H, Yuan Z, Li J, et al. The application of ambroxol hydrochloride combined with fiberoptic bronchoscopy in elderly patients with severe pneumonia: A meta-analysis and systematic review[J]. Medicine (Baltimore),2022,101(4):e28535. https://doi.org/10.1097/MD.0000000000028535 PMid:35089191 PMCid:PMC8797486
  5. Yang F, Li J, Qi B, et al. Clinical Symptoms and Outcomes of Severe Pneumonia Caused by Chlamydia psittaci in Southwest China[J]. Front Cell Infect Microbiol,2021,11:727594. https://doi.org/10.3389/fcimb.2021.727594 PMid:35071027 PMCid:PMC8770948 
  6. Bai L, Yang L, Shi X, et al. Effect of PDCA circulation nursing intervention on prognosis of patients with severe pneumonia[J]. Am J Transl Res,2022,14(1):252~263.
  7. Niu L, Xiao L, Zhang X, et al. Comparative Efficacy of Chinese Herbal Injections for Treating Severe Pneumonia: A Systematic Review and Bayesian Network Meta-Analysis of Randomized Controlled Trials[J]. Front Pharmacol,2021,12:743486. https://doi.org/10.3389/fphar.2021.743486 PMid:35082663 PMCid:PMC8784988 
  8. Tian Y, Li Y, Jiang Z, et al. Urea-to-Albumin Ratio and In-Hospital Mortality in Severe Pneumonia Patients[J]. Can J Infect Dis Med Microbiol,2021,2021:5105870. https://doi.org/10.1155/2021/5105870 PMid:34721746 PMCid:PMC8556110 
  9. Zhou J, Lin J, Zhao Y, et al. Deregulated Expression of miR-483-3p Serves as a Diagnostic Biomarker in Severe Pneumonia Children with Respiratory Failure and Its Predictive Value for the Clinical Outcome of Patients[J]. Mol Biotechnol,2022,64(3):311~319. https://doi.org/10.1007/s12033-021-00415-7 PMid:34637043 
  10. Guo J, Zhang N, Liu G, et al. Upregulated expression of long non-coding RNA MEG3 serves as a prognostic biomarker in severe pneumonia children and its regulatory mechanism[J]. Bioengineered,2021,12(1):7120~7131. https://doi.org/10.1080/21655979.2021.1979351 PMid:34558385 PMCid:PMC8806474 
  11. Lei J, Wang L, Li Q, et al. Identification of RAGE and OSM as New Prognosis Biomarkers of Severe Pneumonia[J]. Can Respir J,2022,2022:3854191. https://doi.org/10.1155/2022/3854191 PMid:35035643 PMCid:PMC8759921 
  12. Xing W, He C, Li J, et al. Automated lung ultrasound scoring for evaluation of coronavirus disease 2019 pneumonia using two-stage cascaded deep learning model[J]. Biomed Signal Process Control,2022,75:103561. https://doi.org/10.1016/j.bspc.2022.103561 PMid:35154355 PMCid:PMC8818345 
  13. Haaksma M E, Smit J M, Heldeweg M, et al. Extended Lung Ultrasound to Differentiate Between Pneumonia and Atelectasis in Critically Ill Patients: A Diagnostic Accuracy Study[J]. Crit Care Med,2021. https://doi.org/10.1097/CCM.0000000000005303 PMid:34582414 
  14. Maggi L, Biava A M, Fiorelli S, et al. Lung Ultrasound: A Diagnostic Leading Tool for SARS-CoV-2 Pneumonia: A Narrative Review[J]. Diagnostics (Basel),2021,11(12). https://doi.org/10.3390/diagnostics11122381 PMid:34943618 PMCid:PMC8699896 
  15. Sansone F, Attanasi M, Di Filippo P, et al. Usefulness of Lung Ultrasound in Paediatric Respiratory Diseases[J]. Diagnostics (Basel),2021,11(10). https://doi.org/10.3390/diagnostics11101783 PMid:34679481 PMCid:PMC8534634 
  16. Guitart C, Esteban E, Becerra J, et al. A training plan to implement lung ultrasound for diagnosing pneumonia in children[J]. Pediatr Res,2021. https://doi.org/10.1038/s41390-021-01928-2 PMid:34969992 PMCid:PMC9586858
  17. Matsuse H, Yanagihara K, Mukae H, et al. Association of plasma neutrophil elastase levels with other inflammatory mediators and clinical features in adult patients with moderate and severe pneumonia[J]. Respir Med,2007,101(7):1521~1528. https://doi.org/10.1016/j.rmed.2007.01.001 PMid:17296292 
  18. Ni M, Tian F B, Xiang D D, et al. Characteristics of inflammatory factors and lymphocyte subsets in patients with severe COVID-19[J]. J Med Virol,2020,92(11):2600~2606. https://doi.org/10.1002/jmv.26070 PMid:32470153 PMCid:PMC7283881
  19. Chen C, Shi L, Li Y, et al. Disease-specific dynamic biomarkers selected by integrating inflammatory mediators with clinical informatics in ARDS patients with severe pneumonia[J]. Cell Biol Toxicol,2016,32(3):169~184. https://doi.org/10.1007/s10565-016-9322-4 PMid:27095254 PMCid:PMC4882347
  20. Ciuca I M, Dediu M, Pop L L. Pediatric pneumonia (PedPne) lung ultrasound score and inflammatory markers: A pilot study[J]. Pediatr Pulmonol,2022,57(2):576~582. https://doi.org/10.1002/ppul.25760 PMid:34786878
  21. Caroselli C, Blaivas M, Marcosignori M, et al. Early Lung Ultrasound Findings in Patients With COVID-19 Pneumonia: A Retrospective Multicenter Study of 479 Patients.[J] .J Ultrasound Med, 2022, 41: 2547-2556. https://doi.org/10.1002/jum.15944 PMid:35040507 PMCid:PMC9015547
  22. Norbedo S, Blaivas M, Raffaldi I, et al. Lung Ultrasound Point-of-View in Pediatric and Adult COVID-19 Infection.[J] .J Ultrasound Med, 2021, 40: 899-908. https://doi.org/10.1002/jum.15475 PMid:32894621
  23. Fischer E A, Minami T, Ma I, et al. Lung Ultrasound for Pleural Line Abnormalities, Confluent B-Lines, and Consolidation: Expert Reproducibility and a Method of Standardization[J]. J Ultrasound Med,2021. https://doi.org/10.1002/jum.15894 PMid:34845735
  24. Cilloniz C, Torres A, Niederman M S. Management of pneumonia in critically ill patients[J]. BMJ,2021,375:e65871. https://doi.org/10.1136/bmj-2021-065871 PMid:34872910
  25. Mizgerd J P. Pathogenesis of severe pneumonia: advances and knowledge gaps[J]. Curr Opin Pulm Med,2017,23(3):193~197. https://doi.org/10.1097/MCP.0000000000000365 PMid:28221171 PMCid:PMC5492380
  26. Kyriakidis I, Samara P, Papa A, Serum TNF-α, sTNFR1, IL-6, IL-8 and IL-10 levels in Weil's syndrome.[J] .Cytokine, 2011, 54: 117-20. https://doi.org/10.1016/j.cyto.2011.01.014 PMid:21316985
  27. Kilercik M, Demirelce O, Serdar M A, et al. A new haematocytometric index: Predicting severity and mortality risk value in COVID-19 patients[J]. PLoS One,2021,16(8):e254073. https://doi.org/10.1371/journal.pone.0254073 PMid:34351940 PMCid:PMC8341498
  28. Howie S R, Morris G A, Tokarz R, et al. Etiology of severe childhood pneumonia in the Gambia, West Africa, determined by conventional and molecular microbiological analyses of lung and pleural aspirate samples[J]. Clin Infect Dis,2014,59(5):682~685. https://doi.org/10.1093/cid/ciu384 PMid:24867789 PMCid:PMC4130311
  29. Wang C, Deng R, Gou L, et al. Preliminary study to identify severe from moderate cases of COVID-19 using combined hematology parameters[J]. Ann Transl Med,2020,8(9):593. https://doi.org/10.21037/atm-20-3391 PMid:32566620 PMCid:PMC7290538
  30. Ni M, Tian F, Xiang D, et al. Characteristics of inflammatory factors and lymphocyte subsets in patients with severe COVID-19.[J] .J Med Virol, 2020, 92: 2600-2606. https://doi.org/10.1002/jmv.26070 PMid:32470153 PMCid:PMC7283881
  31. Seyit M, Avci E, Nar R, et al. Neutrophil to lymphocyte ratio, lymphocyte to monocyte ratio and platelet to lymphocyte ratio to predict the severity of COVID-19.[J] .Am J Emerg Med, 2021, 45: 569. https://doi.org/10.1016/j.ajem.2020.12.069 PMid:33422404 PMCid:PMC7774006
  32. Pata D., Buonsenso D., Valentini P.Comparison of the clinical and laboratory features of COVID and Influenza in children.Mediterr J Hematol Infect Dis 2022, 14(1): e2022065, https://doi.org/10.4084/MJHID.2022.065 PMid:36119462 PMCid:PMC9448268
  33. Liu J, Liu F, Liu Y, et al. Lung ultrasonography for the diagnosis of severe neonatal pneumonia.[J] .Chest, 2014, 146: 383-388. https://doi.org/10.1378/chest.13-2852 PMid:24833216
  34. Chen J, He C, Yin J, et al. Quantitative Analysis and Automated Lung Ultrasound Scoring for Evaluating COVID-19 Pneumonia With Neural Networks.[J] .IEEE Trans Ultrason Ferroelectr Freq Control, 2021, 68: 2507-2515. https://doi.org/10.1109/TUFFC.2021.3070696 PMid:33798078 PMCid:PMC8864919
  35. Elabbas A, Choudhary R, Gullapalli D, et al. Lung Ultrasonography Beyond the Diagnosis of Pediatrics Pneumonia.[J] .Cureus, 2022, 14: e22460. https://doi.org/10.7759/cureus.22460 PMid:35371734 PMCid:PMC8942135