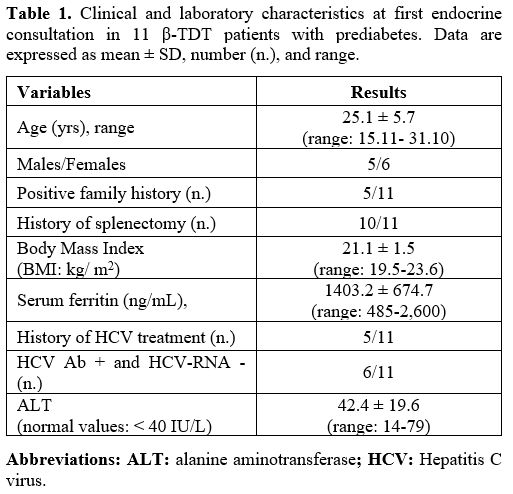
The mean SF level was 1403.2 ± 674.7 ng/mL (range: 485-2,600) (Table 1). Mild iron overload (SF: < 1.000 ng/mL) was present in 4 patients with combined GI, moderate iron overload (SF: >1.000 ng/mL and < 2.000 ng/mL) in 5 patients (2 with IGT and 3 with combined GI), and severe iron overload (SF: >2.000 ng/mL) in 2 patients (1 with IGT and 1 with combined GI).
 |
|
Glucose metabolism and insulin response during OGTT
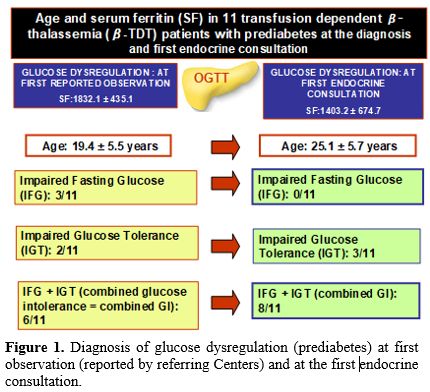
At first consultation. At the first consultation for prediabetes, IGT and combined GI were documented in 3 and 8 β-TDT patients, respectively (Figure 1).
 |
|
Of note, the first documentation of glucose dysregulation reported by the referring Centers (IFG: 3 patients; IGT: 2 patients and combined GI: 6 patients) was reported 5.3 ± 2.6 years earlier (range 2-10 years), at a mean age of 17.6 ± 3.3 years (Figure 1).
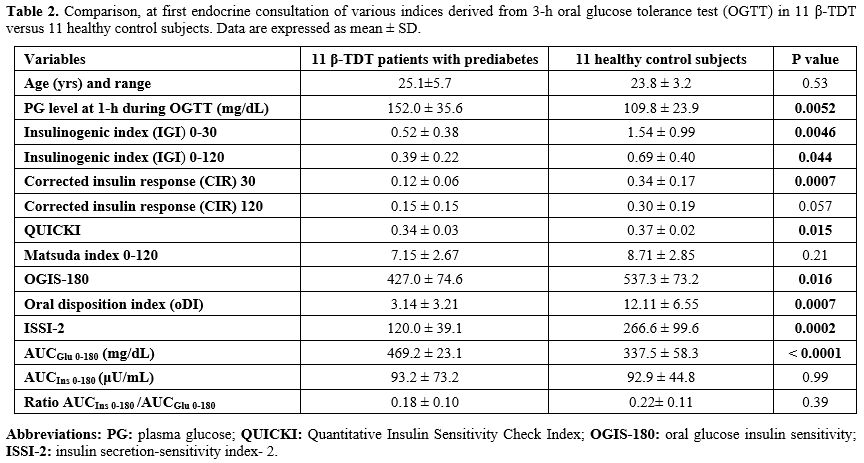
The PG and insulin concentrations, at baseline and during the 3-h OGTT, in β-TDT patients with prediabetes compared to controls are reported in Figures 2 and 3.
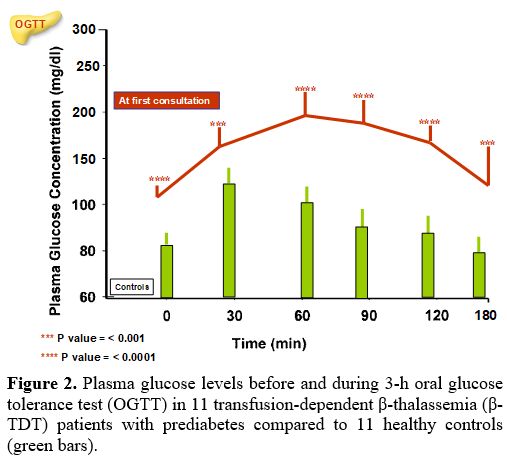 |
Figure 2. Plasma glucose levels before and during 3-h oral glucose tolerance test (OGTT) in 11 transfusion-dependent β-thalassemia (β-TDT) patients with prediabetes compared to 11 healthy controls (green bars). |
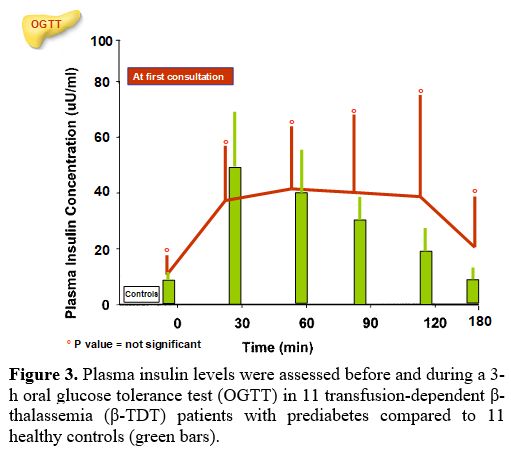 |
Figure 3. Plasma
insulin levels were assessed before and during a 3-h oral glucose
tolerance test (OGTT) in 11 transfusion-dependent β-thalassemia (β-TDT)
patients with prediabetes compared to 11 healthy controls (green bars). |
The WHO and ADA have proposed different cut-off values for the diagnosis of IFG. In this retrospective study, we adopted the latter criteria of 100-125 mg/dL (5.6 -6.9 mmol/L) to increase the sensitivity for early detection of GD. Using WHO criteria, only 2/11 patients (18.1%) with glucose dysregulation had an FPG ≥ 110 mg/dL (5.6 mmol/L), while the percentage was substantially higher (8/11, 72.7%) as per the ADA criteria.
All patients had a PG level at 1-h during OGTT ≥ 155 mg/dL (mean: 192.3 ±21.1 mg/dL; range: 162-233 mg/dL) and a mean PG level at 2-h during OGTT of 162.4 ± 14.8 mg/dL (range:142-187 mg/dL).
Seven of 11 patients (63.6 %) had a plasma insulin peak between 90 and 120 minutes after glucose load.
Overall, indices of insulin secretion (IGI and CIR), sensitivity/resistance (QUICKI, OGIS-180), oDI, ISSI-2, and AUCGlu 0-180 (mg/dL) were statistically different from controls (Table 2).
 |
|
At last observation. DM was diagnosed after a mean interval of 12.4 ± 4.7 months (6-22 months) following the first consultation. The comparison of PG and insulin levels during OGTT and indices of insulin secretion, sensitivity/resistance, and oDI compared to the first consultation are reported in Figures 4 and 5 and Table 3. Four patients with "borderline" PG level at 2-h during OGTT (range: 202-213 mg/dL) underwent a second OGTT test, which confirmed the diagnosis of DM.
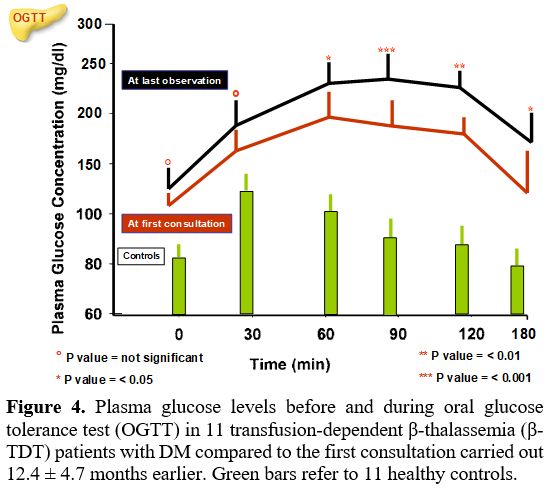 |
Figure 4. Plasma glucose levels before and during oral glucose tolerance test (OGTT) in 11 transfusion-dependent β-thalassemia (β-TDT) patients with DM compared to the first consultation carried out 12.4 ± 4.7 months earlier. Green bars refer to 11 healthy controls. |
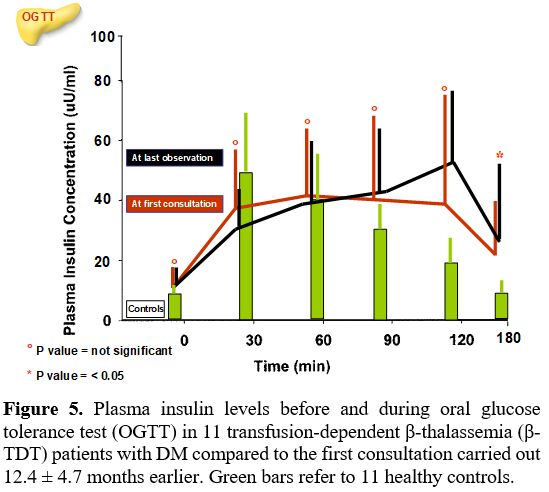 |
Figure 5. Plasma insulin levels before and during oral glucose tolerance test (OGTT) in 11 transfusion-dependent β-thalassemia (β-TDT) patients with DM compared to the first consultation carried out 12.4 ± 4.7 months earlier. Green bars refer to 11 healthy controls. |
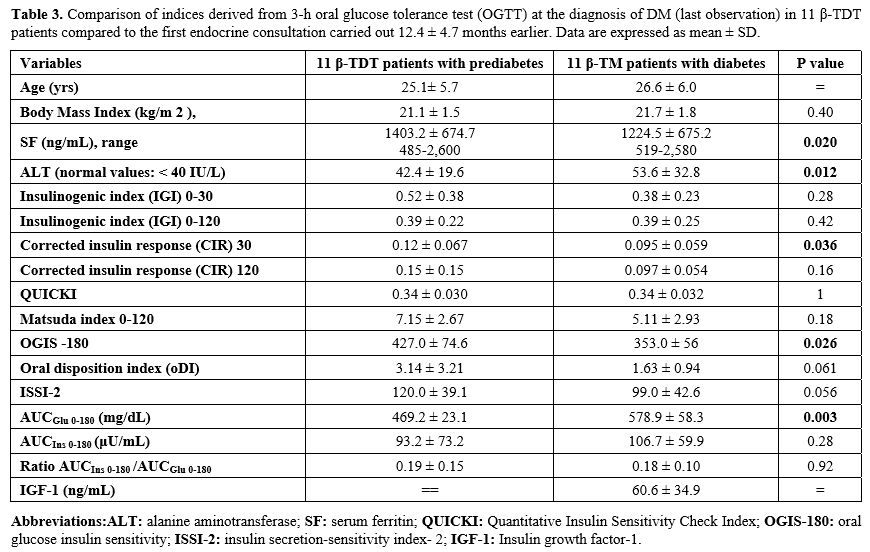 |
Table 3. Comparison of indices derived from 3-h oral glucose tolerance test (OGTT) at the diagnosis of DM (last observation) in 11 β-TDT patients compared to the first endocrine consultation carried out 12.4 ± 4.7 months earlier. Data are expressed as mean ± SD. |
A further increase of PG level at 1-h after OGTT was observed compared to the first consultation (224.7 ± 40.2 mg/dL vs. 192.3 ± 21.1 mg/dL; P: 0.027) and AUCGlu 0-180 (mg/dL) results were significantly higher compared to first consultation (P: 0.003) (Table 3).
Interestingly, the mean insulin response during the OGTT was not statistically different compared to the first endocrine consultation. However, 6 out of 11 patients (54.5 %) had a plasma insulin peak between 120 and 180 minutes after glucose load.
Indices of insulin secretion, sensitivity/resistance, and oDI documented a significant difference in mean CIR-30 value (P: 0.036), OGIS -180 (P: 0.026), and AUCGlu 0-180 (P: 0.003) (Table 3).
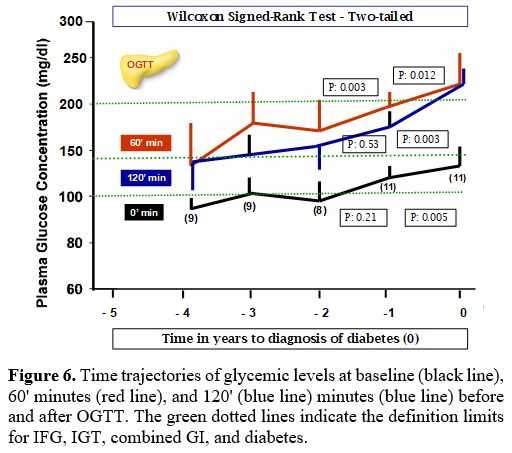
The trajectories of PG levels at baseline, 60 and 120 minutes after OGTT, reported by the referring Centers in the 3 years preceding the first endocrine consultation, are illustrated in Figure 6. We set the year of diabetes diagnosis as year 0, and we traced PG at 0, 60, and 120 minutes after OGTT backward and in the following two years after the first endocrine consultation.
 |
|
The number of patients with FPG level ≥100 mg/dL (≥5.6 mmol/L) at - 4 years was: 1/9 (11.1%); -3 years: 5/9 (55.5%); - 2 years: 4/9 (44.4%) and at -1 year: 11/11 (100%) (PG range: 94- 123 mg/dL).
The number of patients with 1-hour post-load PG value ≥ 155 mg/dL ( ≥ 8.6 mmol/L) was at -4 years: 4/9 (44.4%); -3 years: 8/9 (88.8%); - 2 years: 7/10 (70 %) and at -1 year: 11/11 (100%) (PG range:162-217 mg/dL).
Correlations
At first consultation. A strong positive correlation was observed between 1-hour post-load PG value ≥155 mg/dL (8.6 mmol/L) and AUCGlu 0-180 (r: 0.934; P: 0.000026) and a negative correlation with oDI (r: - 0.6686; P: 0.024). Moreover, QUICKI was strongly correlated to MI 0-120 (r: 0.8601; P: 0.00068) and oDI and ISSI-2 (r: 0.91116; P: 0.0001). The ratio AUCIns 0-180 /AUCGlu 0-180 was negatively correlated with MI 0-120 (r: - 0.67124; P: 0.023).
At last consultation. An inverse linear correlation (r: -0.7197, P: 0.012) was observed between SF and progression duration from prediabetes to diabetes (mean: 6.57 ± 2.89 years; range 2.8-12.2 years). No correlation was observed with age at the first diagnosis of prediabetes carried out with OGTT (r: -0.2046, P: 0.54). Of note, the progression duration (in years) from prediabetes to diabetes had a direct correlation with CIR-30 (r: 0.7606, P: 0.0065), IGI 0-120 (r: 0.6121, P:0.045), oDI (r: 0.7119, P: 0.013) and IGF-1 (r: 0.6246, P: 0.039).