Although determining the optimal method for early identification of β-TDT patients at risk for deteriorating glucose homeostasis remains challenging, current guidelines recommend annual glucose tolerance test screening (OGTT: 1.75 g glucose/kg body weight, maximum: 75 g) starting from the age of 10 years. Plasma glucose (PG) is measured at least at baseline and two hours after a dextrose anhydrous load.[2,3] Despite its effectiveness, OGTT has limitations; it is time-consuming, laboratory-dependent, laborious, and poorly tolerated by some patients.[8] Notably, a high percentage of suboptimal or poor adherence (mean rate: 41.3%) to annual OGTT screening was reported by the ICET-A Network.[8] Moreover, in low- and middle-income countries, screening for GD in β-TDT patients poses particular challenges, in particular, where healthcare centers are overcrowded, understaffed, and insufficiently resourced.
Over the years, many investigators have tried to find alternative screening methods for the early diagnosis of GD with limited success.[9-12] Continuous glucose monitoring systems (CGMS) are a reliable and valid device for evaluating glucose metabolism.[13] However, further studies with a larger sample size are needed before their validation. Thus, new biomarkers for predicting future GD and diabetes, either alone or in combination with PG post-glucose load measurement, have been tested.
To improve the consistency and quality of information derived from OGTT in the general population, there has been a renewed interest in the increment of 2-h PG post-glucose load with respect to fasting plasma glucose (FPG) concentration.[14] It has been reported that NGT subjects, whose post-load PG concentration returned quickly to baseline, had a lower risk for developing type 2 diabetes after a follow-up of 8 years when compared to subjects with a slower PG fall to baseline.[15] Therefore, improving the reliability of testing would improve its clinical predictive value and would provide more meaningful data.
The main aim of this study was to analyze the clinical utility of PG at two h during OGTT over FPG concentration and to correlate its increment (PG%) to surrogate indices of β-cell secretion and sensitivity in β-TDT patients with normal glucose tolerance (NGT) and a different severity of IOL, assessed by serum ferritin (SF).
Subjects and Methods
Study population, inclusion, and exclusion criteria. The anonymized data of β-TDT patients followed by the same endocrinologist (VDS) from October 2010 to October 2024 for endocrine or metabolic consultation or second opinion, were reviewed.Eligible criteria for study inclusion were: (a) β-TDT patients receiving routine blood transfusion and iron chelation therapy; (b) chronological age > 18 years; (c) availability of four points 2-h OGTT, and (d) β-TDT patients with NGT as defined by American Diabetes Association (ADA) criteria: FPG < 100 mg/dL and 120-min PG during OGTT < 140 mg/dL.[16] The main exclusion criteria included: (a) non-transfusion-dependent thalassemia (NTDT); (b) bone marrow transplanted patients;(c) β-TDT patients with body mass index (BMI) above 30 kg/m2; (d) pregnancy; and (e) patients taking medications affecting glucose metabolism.
Data collection and anthropometric measurements. The following clinical data were collected at the first consultation: demographic characteristics, age at the first consultation, weight, height, medical history, and overall recommended treatments, type of iron chelation therapy (ICT), family history of diabetes, history of smoking or alcohol consumption, and previous history of splenectomy.
Height, weight, and body mass index (BMI) were measured according to standardised procedures. Patients were classified according to BMI as underweight (BMI < 18.5 kg/m2), normal weight (BMI 18.5–24.9 kg/m2), overweight (BMI 25–29.9 kg/m2), or obese (BMI ≥ 30 kg/m2).[17]
Study procedures and assays. OGTTs were performed, after an 8-10 hr fast, using 1.75 g/kg (max.75 g dextrose monohydrate in 250 mL water). Venous blood samples were collected at baseline and 30, 60, and 120 minutes to determine PG and insulin concentrations. PG was collected in citrate-containing tubes and assessed using the glucose oxidase method. The time required for the PG concentration to return to the fasting level was made by computing the percentage increment of 2-h PG in respect to FPG (PG%), using the following formula: [(2-h PG-FPG)/FPG]x 100.[18] PG is expressed in mg/dL and insulin concentration in μIU/mL.
Insulin samples were frozen at −60°C and later measured by a commercial chemiluminescence solid phase immunometric assay (Diagnostic Products Corporation, Los Angeles, CA, USA). The insulin values were expressed in μU/mL.
The level of serum alanine aminotransferase (ALT) was determined by an automated analyzer (normal range 0–40 mU/L), IOL was arbitrarily classified as mild (SF: < 1,000 µg/L), moderate (SF: > 1,000 µg/L and < 2,000 µg/L) or severe (SF: > 2,000 µg/L). SF was measured by chemiluminescence immunoassays (Beckman Access Dxl). The 50th centile of reported normal values is 105 µg/L in males and 35 µg/L in females.[19]
Data processing and statistical analysis. The early phase of insulin secretion was assessed using the insulinogenic index (IGI), which was calculated as the incremental change in insulin concentration during the first 30 min after OGTT divided by the incremental change in PG during the same period (IGI: Δ 0-30 insulin/Δ /Δ 0-30 glucose min). IGI30 is considered an acceptable index of β-cell function in β-TDT patients.[20] An IGI30 value < 0.4 was considered indicative of a defective acute insulin response.[21]
For the determination of insulin sensitivity/resistance, the following indices were used: Matsuda Whole Body Insulin Sensitivity Index (MI0-120) and oral disposition index (oDI), as the product of IGI30 and MI0-120. Matsuda index is a marker of whole-body insulin sensitivity, and the oDI index reflects the relationship between β-cell function (early-phase insulin secretion) and peripheral insulin sensitivity (hepatic and peripheral tissues).[20,22] In subjects with reduced insulin sensitivity, insulin secretion increases, but in cases of associated β-cell failure, the capacity to compensate decreases, resulting in lower oDI.
The updated index of the homeostatic model assessment (HOMA-2 IR) was used by the HOMA-2 calculator software released by the Radcliffe Department of Oxford.[23] The model establishes an equilibrium point for PG, insulin, C-peptide, and proinsulin in the fasting state to replicate physiological reality in reference individuals. For HOMA 2% B and HOMA 2% S, a normal value of 100% was assigned. A lower HOMA-2 % B is associated with loss of pancreatic response and a lower HOMA-2% % S is associated with insulin resistance.[23]
Statistical analysis. Data are presented as mean ± SD, except where otherwise indicated. The normality of the distribution of continuous variables was verified using the Kolmogorov-Smirnov test. For comparison of different variables, Student t-test, Wilcoxon's signed rank test, and Mann-Whitney test were used appropriately. Pearson linear correlation for normally distributed variables, and Spearman for quantitative variables, abnormally distributed, were used. For the statistical analysis, a software program was used and validated, according to Alder and Roesser.[24] A two-sided P value <0.05 was considered statistically significant.
Ethics. All participants gave informed consent in accordance with principles of the Declaration of Helsinki and its later amendments in 2020 (www.wma.net), after a detailed explanation of the procedures for performing the OGTT test, the nature and purpose of the study, and the patient's benefits for collecting such information. Ethics approval for a retrospective study was not required because patients underwent only routine diagnostic procedures according to the current recommendations or guidelines.[25,26] Moreover, in our retrospective study, no identifiable patients' information was collected, and anonymized data sets were analyzed.
Results
Patients’ characteristics at baseline. A total of 19 β-TDT patients [12 (63.1%) females] met the inclusion criteria and were enrolled in the study. The mean age of patients was 30.3 ± 5.7 years (range: 23.10-44.3).All patients were regularly transfused, every 2-3 weeks, with a mean pre-transfusional hemoglobin level of 9.1 ± 0.3 g/dL. Six patients (31.5%) had undergone splenectomy.
At first consultation, BMI was < 25 kg/m2 in all but four, who were slightly overweight (2 males and 2 females; BMI: 26.8 ± 0.88 Kg/m²). The reported age at start of iron chelation therapy (ICT) was between 2 and 3 years. At the time of study, all patients were on oral mono- or combined (5/19; 26.3%) iron chelation therapy (Table 1). In 4 patients, the IOL was severe, and in 3, it was moderate. In the remaining 12 patients, it was mild (SF:573.6 ± 205.8 µg/L) (Figure 1).
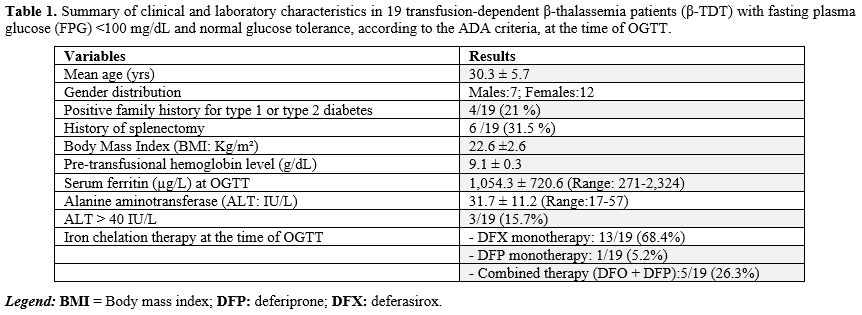 |
Table 1. Summary of clinical and laboratory characteristics in 19 transfusion-dependent β-thalassemia patients (β-TDT) with fasting plasma glucose (FPG) <100 mg/dL and normal glucose tolerance, according to the ADA criteria, at the time of OGTT. |
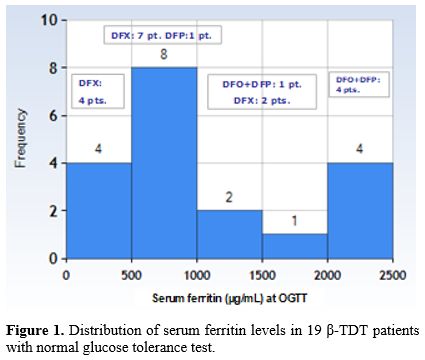 |
Figure 1. Distribution of serum ferritin levels in 19 β-TDT patients with normal glucose tolerance test. |
The commonest associated endocrinopathy was primary or secondary hypogonadism [3/7 males (42.8%) and 9/12 females (75%)]. All except three female patients were on hormone replacement therapy with sex steroids. Moreover, 2/19 (10.5%) patients had short stature (≤ 3rd centile), while one female (8.3%) patient was on thyroxine replacement therapy for mild primary hypothyroidism.
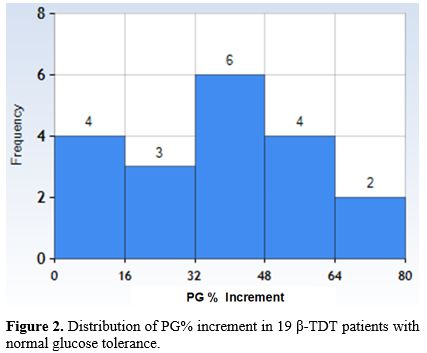
Plasma glucose and surrogate indices of insulin secretion and sensitivity/resistance during OGTT at first consultation. The mean ± SD, median, and range of PG% increment between 2 h-PG and FPG in the 19 β-TDT patients were 35.5 ± 20.2, 38.7, and 0- 68.2 mg/dL, respectively (Figure 2). PG% increment in 7 β-TDT male patients was 29.9 ± 17.7 mg/dL, and in 12 β-TDT female patients was 38.7 ± 21.6 mg/dL (P: 0.37).
In 5/19 patients (26.3%), the PG peak post-glucose load was observed at 60 minutes. A lowish IGI was detected in 8/9 patients (88.8%) with PG% increment > 32 mg/dL.
 |
|
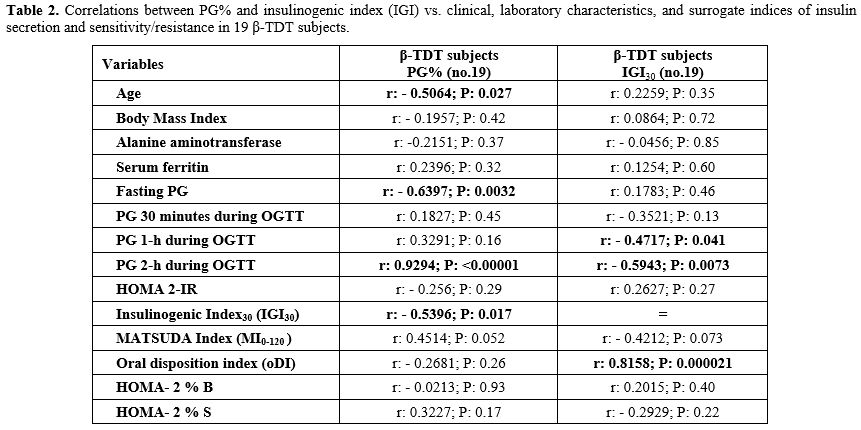
Correlations. The PG% increment was negatively correlated to the patient's age, FPG, and IGI, and positively correlated with 2-h PG post-glucose load. IGI was negatively correlated with 1-h and 2-h PG after post-glucose load and positively correlated with oDI30. A detailed analysis of the correlation between different variables is reported in Table 2.
 |
|
Discussion
Because of increasing longevity of patients with β-TDT, the prevalence of GD and thalassemia related diabetes mellitus (Th-RDM) has increased. Early diagnosis of GD is essential for the timely identification of high-risk TDT patients who may benefit from intensive iron chelation therapy, lifestyle modification and, in selected cases, pharmacotherapy.The OGTT is used to classify subjects as having normal glucose tolerance (NGT), impaired glucose tolerance (IGT), or diabetes. During the OGTT, insulin action and secretion modulate the rate of increase and decrease in PG and the time required for PG to peak and to return to the fasting levels.[27] The first phase of insulin secretion and hepatic insulin resistance indices are important determinants of the initial rise of PG following glucose ingestion. The rate of decline in plasma glucose concentration back towards the fasting PG levels seems to depend primarily on late-phase insulin secretion and muscle insulin sensitivity. The Mexican-American San Antonio Heart Study found that patients with 2-h PG levels higher than FPG had a 2.33-fold higher risk of developing type 2 diabetes over 7-8 years of follow-up.[15]
In the present study, we tried to extract metabolic information from the PG% during OGTT. Our results confirm, for the first time in patients with β-TDT, that PG% can expand the clinical weight of OGTT screening by simply implementing a more powerful and informative calculation that indirectly discloses the measure of insulin secretion and insulin sensitivity.
The following preliminary novel results emerged from our retrospective observational study:
(a) First, PG% was inversely correlated with the Insulinogenic Index (IGI30). IGI30 is a measure of the early phase of insulin secretion in response to glucose load during the first 30 minutes of OGTT. Therefore, a higher PG% (greater rise in 2-h PG relative to FPG) is associated with lower early-phase insulin secretion (lower IGI). This suggests that β-TDT patients with a larger glucose increment after glucose load have an impaired early insulin response, a hallmark of β-cell dysfunction.
(b) Second, PG% was directly correlated with the absolute values of 2-h PG during the OGTT. The correlation is consistent with the hypothesis that impaired early insulin secretion (low IGI30) leads to poorer glucose control after a glucose load due to reduced insulin sensitivity not compensated by a sufficient increase in insulin secretion. Therefore, PG% could reflect the fine-tuning between insulin secretion and sensitivity.[28]
(c) Third, a lower IGI index was associated with higher glucose levels at both 1-h and 2-h during the OGTT, further supporting the role of β-cell dysfunction in glucose dysregulation. In addition, the positive correlation of IGI30 with the oral Disposition Index (oDI0-120), which is a measure of β-cell function adjusted for insulin sensitivity, suggests that patients with better early insulin response have better overall glucose regulation and insulin sensitivity. Substantially, subjects whose PG values fall faster to FPG levels during OGTT have greater insulin sensitivity and better β-cell function compared to NGT subjects whose PG values fall more slowly. Therefore, the presence of both a reduction in insulin secretion and insulin sensitivity suggests a peculiar aspect of β-TDT-related glycemic phenotype.
Some limitations of this study warrant consideration. First, the small single study population of β-TDT and the lack of longitudinal data are the major limitations and, thus, clearly need replication in a larger cohort of patients with long-term follow-up. Second, the study setting was a single center, so generalizability should be considered with caution. Third, the β-cell function measurements were generated by using mathematical models derived from OGTT instead of the gold-standard technique. Overall, they are unable to reconstruct the exact architecture of the severity of the defects in β-cell function and insulin sensitivity herein reported. However, measuring IGI30 and oDI0-120 has several advantages; it involves less complex protocols, requires less cost, and utilizes a physiological route of glucose administration. Moreover, they have been validated against the euglycemic clamp.[29] Finally, prospective studies are required to corroborate our findings further, evaluate their implications for specific outcomes, and assess the benefits of therapeutic interventions targeting early glucose abnormalities. This would allow early intervention aimed at preserving pancreatic β-cells and helping to prevent or delay the development of GD and Th-RDM.
Conclusions
PG% is a simple, useful screening parameter that can expand the clinical weight of OGTT and provide valuable metabolic information on β-cell dysfunctions in β-TDT patients at potential risk of neurometabolic deterioration. Moreover, it may provide a more personalized OGTT screening interval approach to β-TDT patients with NGT and PG% near or below the FPG value (low PG%).Author contributions
VDS contributed to the literature review, database design, statistical analysis, interpretation of the data, and drafting of the manuscript. ATS, SD, PT, and CK contributed to the critical revision of important intellectual content and editing and revision of the manuscript. VDS is the guarantor of this work and takes responsibility for the integrity and accuracy of the data analysis. All of the authors approved the final manuscript prior to submission.Acknowledgments
We thank all the participants in the study and are indebted to our colleagues for their help in facilitating it.References
- He LN, Chen W, Yang Y, Xie YJ, Xiong ZY, Chen DY,
Lu D, Liu NQ, YangYH, Sun XF. Elevated prevalence of abnormal glucose
metabolism and other endocrine disorders in patients with β-thalassemia
major: A meta-analysis. Biomed Res Int. 2019; 2019:6573497. https://doi.org/10.1155/2019/6573497. PMid:31119181 PMCid:PMC6500678
- De
Sanctis V, Soliman A, Tzoulis P, Daar D, Karimi M, Yassin MA, Pozzobon
G, Kattamis C. The clinical characteristics, biochemical parameters and
insulin response to oral glucose tolerance test (OGTT) in 25
transfusion dependent β-thalassemia (TDT) patients recently diagnosed
with diabetes mellitus (DM). Acta Biomed. 2022;92(6):e2021488. https://doi.org/10.23750/abm.v92i6.12366.
- De
Sanctis V., Soliman A.T., Daar S., Tzoulis P., Kattamis C. Can we
predict incipient diabetes mellitus in patients with
transfusion-dependent β-thalassemia (β-TDT) referred with a history of
prediabetes? Mediterr J Hematol Infect Dis 2024, 16(1): e2024005. https://doi.org/10.4084/MJHID.2024.005 PMid:38223478 PMCid:PMC10786125
- Qu
Z, Yang S, Xing F, Tong R,Yang C, Guo R, Huang L, Lu F,Fu C, YanX,
Hectors S, Gillen K Wang Y, Liu C,Ahan S Li J. Magnetic resonance
quantitative susceptibility mapping in the evaluation of hepatic
fibrosis in chronic liver disease: a feasibility study. Quant Imaging
Med Surg. 2021;11(4):1170-83. https://doi.org/10.21037/qims-20-720 PMid:33816158 PMCid:PMC7930689
- Matter
RM, Alam KE, Sadony AM. Gradient-echo magnetic resonance imaging study
of pancreatic iron overload in young Egyptian beta-thalassemia major
patients and effect of splenectomy. Diabetol Metab Syndr. 2010;23. https://doi.org/10.1186/1758-5996-2-23 PMid:20398341 PMCid:PMC2873247
- De
Sanctis V, Daar S, Soliman AT, Tzoulis P, Yassin M, Kattamis C. The
effects of excess weight on glucose homeostasis in young adult females
with β-thalassemia major (β-TM): a preliminary retrospective study:
Excess weight and glucose homeostasis in β-thalassemia major. Acta
Biomed. 2023;94(5):e2023225. https://doi.org/10.23750/abm.v94i6.14909.
- Mousa
SO, Abd Alsamia EM, Moness HM, Mohamed OG. The effect of zinc
deficiency and iron overload on endocrine and exocrine pancreatic
function in children with transfusion-dependent thalassemia: a
cross-sectional study. BMC Pediatr. 2021;21:468. https://doi.org/10.1186/s12887-021-02940-5 PMid:34686155 PMCid:PMC8532363
- De
Sanctis V, Canatan D, Daar S, Kattamis C. (Steering Committee); Banchev
A, Modeva I, Savvidou I, Christou S, Kattamis A, Delaporta P,
Kostaridou-Nikolopoulou S, Karim M, Saki F, Faranoush M, Campisi S,
Fortugno C, Gigliotti F, Wali Y, Al Yaarubi S, Yassin MA, Soliman AT,
Kottahachchi D, Kurtoğlu E, Gorar S, Turkkahraman D, Unal S, Oymak Y,
Ay Tuncel D, Karakas Z, Gül N, Yildiz M, Elhakim I, Tzoulis P.
(Participants). A multicenter ICET-A survey on adherence to annual oral
glucose tolerance test (OGTT) screening in transfusion-dependent
thalassemia (TDT) patients -The expert clinicians' opinion on factors
influencing the adherence and on alternative strategies for adherence
optimization. Mediterr J Hematol Infect Dis. 2025;17(1): e2025008. https://doi.org/10.4084/MJHID.2025.008 PMid:39830799 PMCid:PMC11740908
- Choudhary
A, Giardina P, Antal Z, Vogiatzi M.Unreliable oral glucose tolerance
test and HbA1C in Beta Thalassaemia Major-A case for continuous glucose
monitoring? Br J Haematol. 2013;162: 132-5. https://doi.org/10.1111/bjh.12322 PMid:23594287 PMCid:PMC4055036
- Thewjitcharoen
Y, Elizabeth AE, Butade S, Nakasatien S, Chotwanvirat P, Wanothayaroj
E, Krittiyawong S, Himathongkam T, Himathongkam T. Performance of HbA1c
versus oral glucose tolerance test (OGTT) as a screening tool to
diagnose dysglycemic status in high-risk Thai patients. BMC Endocr Dis.
2019;19:23. https://doi.org/10.1186/s12902-019-0339-6 PMid:30770743 PMCid:PMC6377733
- Bhatti
P, Ghay R, Singh Narang G, Thaman V, Narang S. Estimation of HbA1c
Levels in Transfusion-Dependent Thalassemia Patients in Comparison With
Normal Healthy Individuals. Cureus .2024;16 (11):e73236. https://doi.org/10.7759/cureus.73236
- Mahmoud
AA, El-Hawy MA, Alla ET, Salem AH, Hola AS. HbA1c or fructosamine on
evaluating glucose intolerance in children with beta-thalassemia.
Pediatr Res. 2024;96(59):1292-8. https://doi.org/10.1038/s41390-024-03146-y PMid:38575692 PMCid:PMC11521987
- Soliman
AT, Yasin M, El-Awwa Ahmed, De Sanctis V. Detection of glycemic
abnormalities in adolescents with beta thalassemia using continuous
glucose monitoring and oral glucose tolerance in adolescents and young
adults with β-thalassemia major: Pilot study. Indian J Endocrinol
Metab.2013; https://doi.org/10.4103/2230-8210.111647 PMid:23869308 PMCid:PMC3712382
- Masrouri
S, Tamehri Zadeh SS, Tohidi M, Azizi F, Hadaegh F. Linking extent of
return to fasting state after oral glucose tolerance test to future
risk of prediabetes and type 2 diabetes: Insights from the TLGS. J
Diabetes Investig.2024;15(12):1743-52. https://doi.org/10.1111/jdi.14308 PMid:39344286 PMCid:PMC11615687
- Abdul-Ghani
MA, Williams K, DeFronzo R, Stern M. Risk of progression to type 2
diabetes based on relationship between postload plasma glucose and
fasting plasma glucose. Diabetes Care. 2006; 29: 1613-8. https://doi.org/10.2337/dc05-1711 PMid:16801587
- American
Diabetes Association. 2. Classification and diagnosis of diabetes:
standards of medical care in diabetes-2020. Diabetes Care.
2020;43:S14-31. https://doi.org/10.2337/dc20-S002 PMid:31862745
- WHO.
Physical status: the use and interpretation of anthropometry. Report of
a WHO Expert Committee. World Health Organ Tech Rep Ser.
1995;854:1-452. ISBN:92-4-120854-6.
- Bartoli
E, Fra GP,Carnevale Scianca GP. The oral glucose tolerance test
(OGTT)revisited. Eur J Intern Med. 2011;22(1):8-12. https://doi.org/10.1016/j.ejim.2010.07.008 PMid:21238885
- Fulwood
R, Johnson CL, Bryner JD. Hematological and nutritional biochemistry
reference data for persons 6 months-74 years of age: United States,
1976-1980. National Center for Health Statistics. Vital Health Stat
Series.1982;11:p.1-173.
- De
Sanctis V, Soliman AT, Daar S,Tzoulis P, Karimi M, Saki F, Di Maio S,
Kattamis C. A prospective guide for clinical implementation of selected
OGTT- derived surrogate indices for the evaluation of β- cell function
and insulin sensitivity in patients with transfusion-dependent β-
thalassaemia: β-thalassemia and OGTT surrogate indices. Acta Biomed.
2023;94(6):e2023221. https://doi.org/10.23750/abm.v94i6.15329.
- Yoshinaga,
H. and Kosaka, K.Heterogeneous Relationship of Early Insulin Response
and Fasting Insulin Level with Development of Non-Insulin-Dependent
Diabetes Mellitus in Non-Diabetic Japanese Subjects with or without
Obesity. Diabetes Res Clin Pract. 1999: 44:129-36. https://doi.org/10.1016/S0168-8227(99)00019-4 PMid:10414932
- Utzschneider
KM, Prigeon RL, Faulenbach MV, Tong J, Carr DB, Boyko EJ, Leonetti DL,
McNeely MJ, Fujimoto WY, Kahn SE. Oral disposition index predicts the
development of future diabetes above and beyond fasting and 2-h glucose
levels. Diabetes Care. 2009;32(2):335-41. https://doi.org/10.2337/dc08-1478 PMid:18957530 PMCid:PMC2628704
- Wallace TM, Levy JC, Matthews DR: Use and abuse of HOMA modeling. Diabetes Care.2004; 27: 1487-95. https://doi.org/10.2337/diacare.27.6.1487 PMid:15161807
- Alder
R, Roesser EB. Introduction to probability and statistics. WH Freeman
and Company Eds. Sixth Edition. San Francisco (USA). 1977; p.1-426.
- De
Sanctis V, Soliman AT, Elsedfy H, Yaarubi SA, Skordis N, Khater D, El
Kholy M, Stoeva I, Fiscina B, Angastiniotis M, Daar S, Kattamis C. The
ICET-A Recommendations for the Diagnosis and Management of Disturbances
of Glucose Homeostasis in Thalassemia Major Patients. Mediterr J
Hematol Infect Dis. 2016;8 (1):e2016058. https://doi.org/10.4084/mjhid.2016.058 PMid:27872738 PMCid:PMC5111521
- Farmakis
D, Porter J, Taher A, Cappellini MD, Angastiniotis M, Eleftheriou A.
2021 Thalassaemia International Federation Guidelines for the
Management of Transfusion-dependent Thalassemia. Hemasphere. 2022;6
(8):e732. https://doi.org/10.1097/HS9.0000000000000732 PMid:35928543 PMCid:PMC9345633
- Abdul-Ghani
MA, Matsuda M, Balas B, DeFronzo RA. Muscle and liver insulin
resistance indexes derived from the oral glucose tolerance test.
Diabetes Care. 2007; 30:89-94. https://doi.org/10.2337/dc06-1519 PMid:17192339
- Gastadelli
A, Ferrannini E, Miyazaki Y, Matsuda M, DeFronzo RA; San Antonio
metabolism study. Beta-cell dysfunction and glucose intolerance:
results from the San Antonio Metabolism (SAM) study. Diabetologia.
2004;47 (1):31-9. https://doi.org/10.1007/s00125-003-1263-9 PMid:14666364
- Dalla Man C, Campioni M, Polonsky KS, Basu R, Rizza RA, Toffolo G, Cobelli C. Two-hour seven-sample oral glucose tolerance test and meal protocol: minimal model assessment of beta-cell responsivity and insulin sensitivity in nondiabetic individuals. Diabetes. 2005;54(11):3265-73. https://doi.org/10.2337/diabetes.54.11.3265 PMid:16249454