Despite advancements in chemotherapy and targeted therapies, such as FLT3 and IDH inhibitors, long-term survival rates of patients with AML remain low,particularly in elderly patients, with 5-year survival rates below 30%.[14,15] Recent breakthroughs in immunotherapy, notably PD-1/PD-L1 inhibitors, have revolutionised treatment paradigms across cancers, including AML.For instance, clinical trials evaluating PD-1/PD-L1 blockade in relapsed/refractory AML demonstrate enhanced Tcell-mediated anti-leukemic activity and improved survival in subsets of patients.[16] These advances underscore the critical role of immune dysregulation in AML progression and highlight the need to identify biomarkers that bridge molecular aberrations with immune microenvironment dynamics.
Solute carrier family 22 member 4 (SLC22A4) (a member of the SLC22 family, encoding OCTN1, an organic cation transporter) emerges as a novel candidatein this context. A research study showed that decreased expression of the uptake transporter OCTN1 (SLC22A4) leads to poor prognosis in paediatric patients with AML.[17] SLC22A4 increased the transport of imatinib, thereby enhancing the sensitivity of chronic myeloid leukaemia cells to this agent.[18] Unlike conventional AML biomarkers that mainly reflect genetic instability, such as FLT3-ITD or NPM1 mutations, SLC22A4 uniquely integrates metabolic transport, immune regulation, and chemoresistance. Even though SPAG1 and HOXA10 are established prognostic markers associated with proliferation and differentiation arrest, the role of SLC22A4 in regulating nucleoside analogue transport (e.g., cytarabine) offers unique mechanistic advantages. SLC22A4-mediated drug efflux directly impacts intracellular cytarabine concentrations, the cornerstone of AML therapy.[17] Mechanistically, SLC22A4 dysfunction may drive AML pathogenesis through multiple axes: (1) drug resistance, whereby reduced SLC22A4 expression impairs cytarabine uptake and promotes leukaemia cell survival; and (2) epigenetic regulation, in which hypermethylation of cytosinephosphate-guanine (CpG) sites (e.g., cg05231888) inhibits SLC22A4, linking epigenetic silencing to adverse outcomes.[17]
In this study, we analysed differentially expressed genes (DEGs) between AML and normal samples and screened genes associated with immune infiltration and survival prognosis. This study aimed to investigate the function of SLC22A4 in AML and its value as a new tumour marker for predicting the prognosis of AML.
Materials and Methods
Data Acquisition and Pre-processing. The study included data from 151 de novo AML samples from The Cancer Genome Atlas (TCGA) database (AML NEJM 2013; https://portal.gdc.cancer.gov/), with survival data available for 142 of those (GSE68833). This chip does not overlap with any of the other GEO datasets used in this study. The AML RNA-sequencing (RNA-seq) dataset was downloaded from the UCSC Xena database (https://xenabrowser.net/datapages/).RNA-seq data from 151 TCGA-AML samples and six Gene Expression Omnibus (GEO) datasets (GSE9476, GSE12662, GSE30029, GSE34577, GSE12417, GSE37642) were obtained as raw counts.[16] GSE12417 was used to evaluate the relationship between SLC22A4 expression and prognosis. GSE12417 includes RNA-seq expression profiles and survival data of 163 patients with cytogenetically normal AML. Two peripheral blood mononuclear cell samples and one myeloproliferative sample were removed from the analysis. GSE37642 includes 422 patients with AML; 417 samples with available information on survival were selected for analysis. GSE9476 contains 26 AML and 18 normal tissue samples derived from the bone marrow. GSE34577 includes 48 AML and 18 normal tissue samples derived from the bone marrow.[17,19-28] The abundance of immune cell subsets in patients with AML was analysed using the GSE12417 and GSE37642 datasets. Raw counts were normalised using DESeq2’s median-of-ratios method to correct for library size differences, followed by variance-stabilising transformation to minimise heteroscedasticity. Batch effects arising from platform heterogeneity were adjusted using the ComBat algorithm from the sva R package (v3.46.0), which harmonises expression distributions across datasets while preserving biological variation.
CellMiner Database. The CellMiner database (https://discover.nci.nih.gov/cellminer/) provides resources for the exploration of pharmacogenomics using cancerous cell lines.[29] The effect of SLC22A4 expression on drug sensitivity was analysed using this database.
Weighted Gene Co-expression Network Analysis for the Identification of Key Genes Co-associated with Immune-characteristics. Co-expression networks and hub genes associated with CD8_T_Cells_Danaher_et_al_PCA, CD8_T_Cells_EPIC, Immune Score_Xcell, and Microenvironment Score_Xcell were identified using the weighted gene co-expression network analysis (WGCNA) package (version 1.72-1) in R.[30] To determine the optimal soft thresholding power (β), we evaluated scale-free topology fit indices (R² ≥ 0.90) and mean connectivity across a range of β values (1–20).[31] A β of 7 was selected for both GSE12417 and GSE37642 cohorts, as it achieved the highest scale-free topology fit (R² = 0.93 and R² = 0.91, respectively) while maintaining moderate mean connectivity (<200 edges per gene), balancing network specificity and biological interpretability. Dynamic tree cutting (minimum module size = 30, deepSplit = 2) identified co-expression modules, which were correlated with immune scores (xCell, EPIC) (https://xcell.ucsf.edu/) to prioritise modules for downstream.
Thereafter, a scale-free network was constructed based on the gene expression profile using the pickSoftThreshold function (correlation coefficient R2 > 0.90). Modules were identified using the Dynamic Tree Cut algorithm. R software (version 4.2.2, https://www.R-project.org/) was used to draw a module–immune feature correlation heat map. Modules and immune features with the highest correlation and smallest p-value were selected as candidate genes for subsequent analysis.
Immune Infiltration Analysis. The ggpubr (version 0.6.0) and ggsci (version 3.0.0) packages in R were used for visualisation.[32,33] Immune cell infiltration levels were quantified using xCell (v1.1.0) and EPIC (v1.1.5) algorithms via the IOBR R package (v0.99.9).[34] Single-sample gene set enrichment analysis (ssGSEA) was performed with the GSVA package (v1.46.0), using hallmark gene sets from MSigDB (v7.5.1).[35-37] Pathway enrichment for SLC22A4-associated genes was conducted with clusterProfiler (v4.0.0) and ReactomePA (v1.38.0), applying the Benjamini–Hochberg correction (FDR < 0.05).[35]
Gene Set Enrichment Analysis. Gene set enrichment analysis examines the molecular signalling pathways of SLC22A4 at the gene set level by analysing the distribution trend of the SLC22A4 gene using phenotype-related microarray data.[38] According to the median levels of SLC22A4, the gene expression profiles in TCGA samples were divided into two groups (i.e., SLC22A4 low- and high-expression). Subsequently, DEGs were analysed using the Kyoto Encyclopedia of Genes and Genomes (KEGG) (https://www.kegg.jp/) pathway and Reactome pathway analyses. All detected genes were analysed using R packages; the ReactomePA, org.. Hs.eg.db, ClusterProfiler, and enrichplot packages were utilised to display the results.[39] Pathways with meaningful enrichments were identified based on p-values below 0.05 and the normalised enrichment score ranking.
Methylation Analysis. In this study, the level of SLC22A4 methylation was determined using the Shiny Methylation Analysis Resource Tool (SMART app; http://www.bioinfo-zs.com/smartapp), an interactive web application for DNA methylation analysis based on the TCGA database.[40]
Statistical Analysis. All statistical analyses were performed using R (version 4.2.2, https://www.R-project.org/). Differential expression analysis of RNA-seq data between AML and normal samples was conducted using the Wilcoxon rank-sum test. To mitigate the risk of false positives due to multiple comparisons, the Benjamini–Hochberg false discovery rate (FDR) correction was applied across all differential expression analyses, with significance defined as FDR-adjusted p < 0.05. Survival outcomes were analysed via Kaplan–Meier curves, and differences between groups were assessed using the log-rank test. Hazard ratios (HRs) and 95% confidence intervals (CIs) were calculated using univariate and multivariate Cox proportional hazards regression models. Variables with p < 0.2 in univariate analysis were included in multivariate models to avoid overfitting.
To account for multiplicity in immune cell subtype analyses, the Bonferroni correction was applied, with significance thresholds adjusted to p < 0.0025 (0.05/20). Methylation-expression correlations were evaluated using linear regression, and FDR correction was similarly applied to CpG site analyses. A receiver operating characteristic (ROC) curve was drawn using the pROC package (https://www.R-project.org/) to evaluate the diagnostic performance of SLC22A4 expression. The relationship between clinicopathological features and SLC22A4 expression was analysed using the Student’s t-test (satisfies normal + homogeneity of variance), Welch’s t-test (satisfies normal + does not satisfy homogeneity of variance), and the Wilcoxon rank-sum test (does not satisfy normal, nonparametric test). Survival curves were calculated using the Kaplan–Meier method. Univariate and multivariate analyses of the risk of mortality were performed using the Cox proportional hazards regression model. All tests were two-tailed, and statistical significance was defined as p < 0.05.
Results
Analysis of Abnormally Expressed Genes in AML. Differential analysis of the GSE9476 and GSE30029 datasets was performed to identify DEGs between the AML and normal groups. Group differences were displayed using principal component analysis (PCA) (Figures 1A, B). Differential expression analysis of GSE9476 and GSE30029 datasets identified 523 (385 down-regulated and 138 upregulated) and 925 (713 down-regulated and 212 upregulated) DEGs in AML compared with normal samples, respectively (|log2 fold change| > 1, FDR < 0.05; Figures 1C, D). Volcano plots explicitly demarcated significance thresholds (FDR < 0.05, dashed horizontal line) and fold-change cutoffs (|log2FC| > 1, vertical lines), ensuring transparent criteria for DEG selection. This evidence indicates that these genes were abnormally expressed across the normal and AML samples.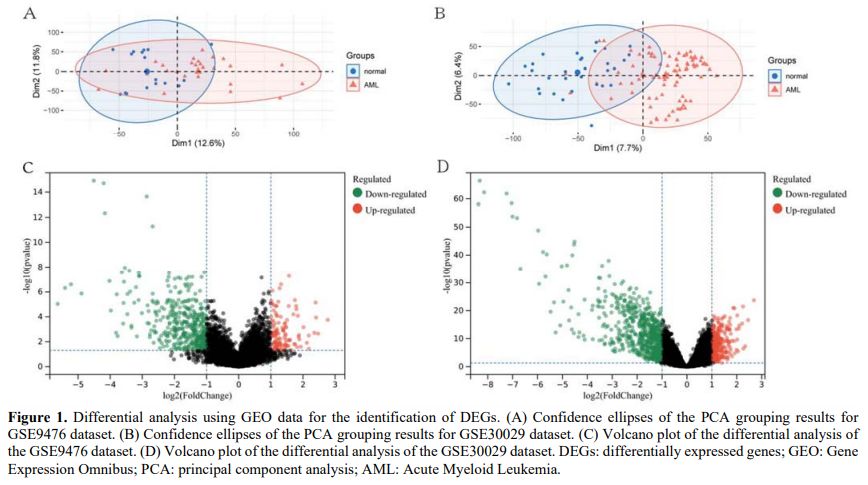 |
|
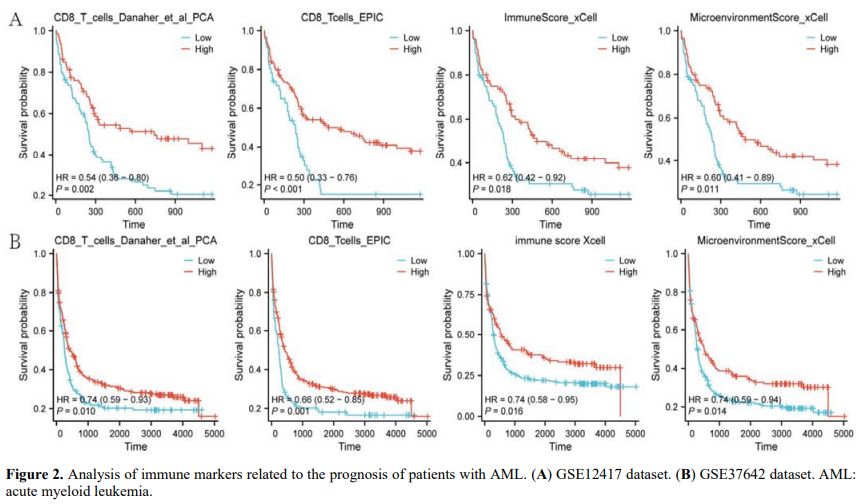
Analysis of Prognostic Genes Associated with Immune Markers. We sought to identify immune markers related to the survival prognosis of patients with AML. Therefore, PCA, EPIC, and xCell analyses were performed in the GSE12417 and GSE37642 datasets using the IOBR package in R, and survival curves were used for representation. The results showed that four immune markers (CD8_T_cells_Danaher_et_al_PCA, CD8_Tcells_EPIC, immune score xCell, and MicroenvironmentScore_xCell) were related to the survival prognosis. Higher expression levels of immune markers were linked to a better survival prognosis (p < 0.05; hazard ratio < 1; Figures 2A, B). This finding suggests that these four immune markers play an inhibitory role in the development and progression of AML.
 |
|
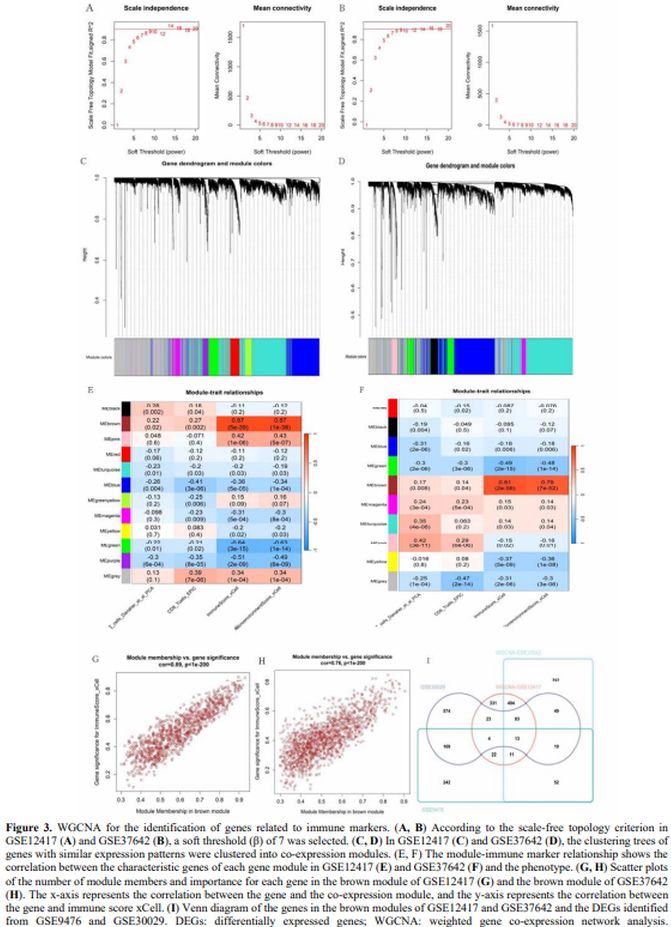
Weighted Gene Co-expression Network Analysis for the Identification of Gene Modules Related to Immune Markers. The GSE12417 and GSE37642 datasets were used for WGCNA analysis. For the construction of a scale-free network, a soft thresholding power (β) of 7 was estimated under the condition of Cex1 = 0.9 for both GSE12417 and GSE37642 (Figures 3A, B). In GSE12417, hierarchical clustering identified 12 co-expression modules clustered into one class (Figures 3C, E). Of the 12, the brown module showed the strongest positive correlation with the xCell immune score (Cor = 0.89, p < 1e−200; Figure 3G). In GSE37642, 10 co-expression modules clustered into one class were identified (Figures 3D, F). Of the 10, the brown module again showed the strongest positive correlation with the xCell immune score (Cor = 0.76, p < 1e−200; Figure 3H). Therefore, the brown modules in these two datasets were further analysed. In the GSE12417 and GSE37642 datasets, the brown module contained 981 and 1,469 genes, respectively. The intersection of the brown module genes in GSE12417 and GSE37642 and the DEGs identified from the GSE9476 and GSE30029 yielded 13 genes: interferon regulatory factor 8 (IRF8); tetraspanin 13 (TSPAN13); carboxypeptidase vitellogenic-like (CPVL); mitochondrial calcium uniporter dominant negative subunit beta; tissue inhibitor of metalloproteinase-1; glutaminyl-peptide cyclotransferase (QPCT); terminal nucleotidyltransferase 5C (TENT5C); SLC22A4; biliverdin reductase A (BLVRA); tumour necrosis factor (TNF); adhesion G protein-coupled receptor A2; transforming growth factor beta induced; and formyl peptide receptor 2 (FPR2) (Figure 3I). Of the 13 candidate genes derived from the WGCNA and DEG intersections (Figure 3I), survival analysis in the TCGA cohort revealed SLC22A4 as the most robust prognostic marker, with high expression correlating with prolonged overall survival (HR = 0.41, 95% CI = 0.24–0.70, p < 0.001; Figure 3E). Notably, IRF8 (HR = 2.16, 95% CI = 1.31–3.57, p = 0.003) and CPVL (HR = 1.77, 95% CI = 1.14–2.74, p = 0.011) also demonstrated significant associations with survival, albeit with opposing risk profiles. In contrast, BLVRA, FPR2, TSPAN13, TENT5C, and QPCT lacked prognostic relevance (p > 0.05), underscoring the specificity of SLC22A4 in AML prognosis.
 |
|
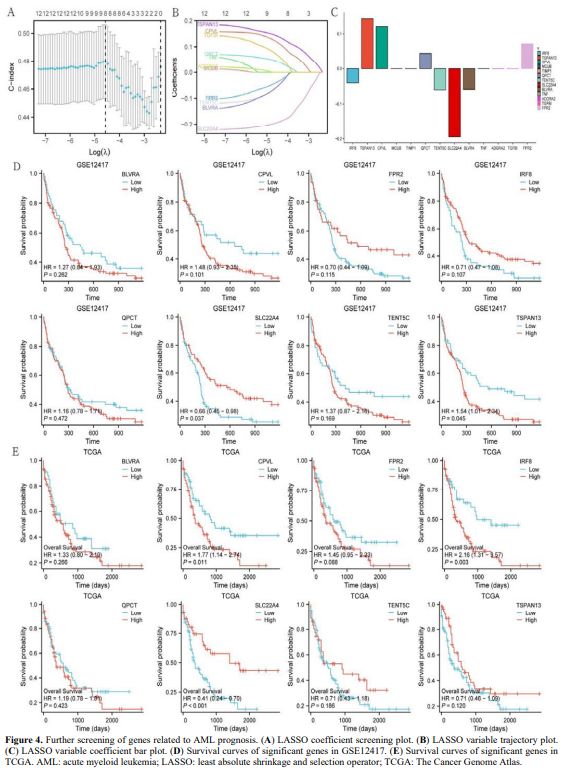
Analysis of Genes Related to AML Prognosis. The GSE12417 dataset was used for this analysis. Least absolute shrinkage and selection operator (LASSO) regression analysis was performed on the 13 obtained genes. Eight genes with significant LASSO coefficients were detected: IRF8, TSPAN13, CPVL, QPCT, TENT5C, SLC22A4, BLVRA, and FPR2 (Figures 4A–C). The significance of these eight genes in relation to survival was further verified in the GSE12417 and TCGA datasets. The results were displayed using survival curves (Figures 4D, E). SLC22A4 expression was significantly altered (p < 0.05) in both datasets. A higher expression of SLC22A4 indicated a better survival prognosis for patients with AML (HR < 1).
 |
|
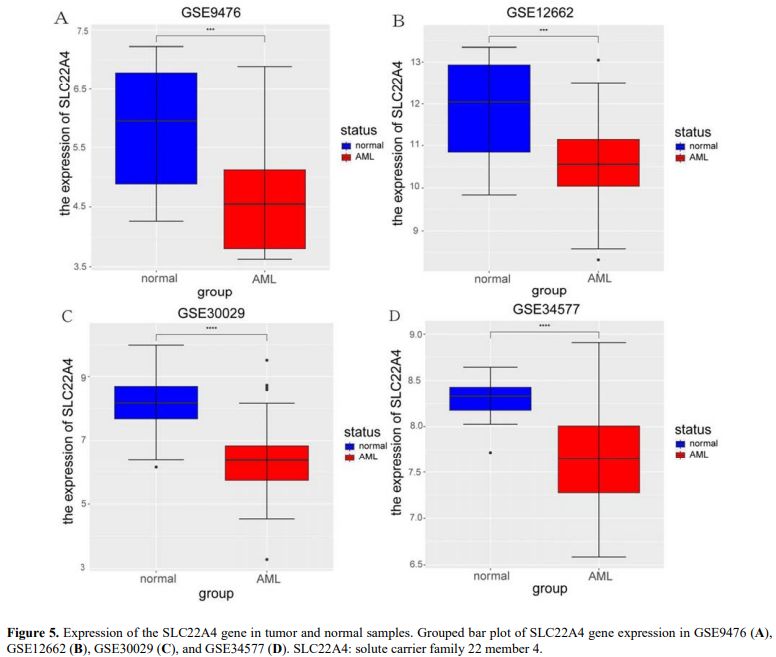
Levels of SLC22A4 Expression in AML and Normal Samples. Four datasets containing normal and AML samples (GSE9476, GSE12662, GSE30029, and GSE34577) were used to analyse SLC22A4 expression in AML and normal samples. The results showed that, compared with normal samples, SLC22A4 expression was significantly decreased in AML samples in the four datasets (Figures 5A–D). This evidence suggests that SLC22A4 acts as a tumour suppressor gene in AML.
 |
|
Effect of SLC22A4 Gene Expression on Prognosis. Using TCGA and Genotype-Tissue Expression datasets, ROC analysis was performed to evaluate the prognostic ability of SLC22A4 in AML. As shown in Figure 6A, the area under the ROC curve (AUC) was greater than 0.8, suggesting that SLC22A4 can be used to distinguish AML from normal samples. The time-dependent ROC curve showed that the AUC for predicting 5-year survival was greater than 0.7 (Figure 6B), suggesting that SLC22A4 is effective in predicting 5-year prognosis.
Patients were divided into high- and low-SLC22A4 expression groups based on median levels to analyse the association of SLC22A4 expression with clinical characteristics of AML. Clinical parameters of the two groups are shown in Table 1. In the TCGA dataset, the expression of SLC22A4 was statistically different across bone marrow blast percentage, RAS mutation, and cytogenetic risk groups (p < 0.05) (Figure 6C). Variables with p < 0.2 in univariate analysis (SLC22A4 expression, age, cytogenetic risk, and French–American–British classification) were included in the multivariate analysis. The results showed that SLC22A4 expression might be an independent prognostic factor for patient survival in AML (p = 0.032; Figures 6D, E). A nomogram also confirmed this finding (Figure 6F). The ROC curve was used to verify the accuracy of the established model, achieving AUC values below 0.7 for 1- and 3-year survival rates and below 0.8 for 5-year survival (Figure 6G), which indicates high accuracy in predicting patient survival.
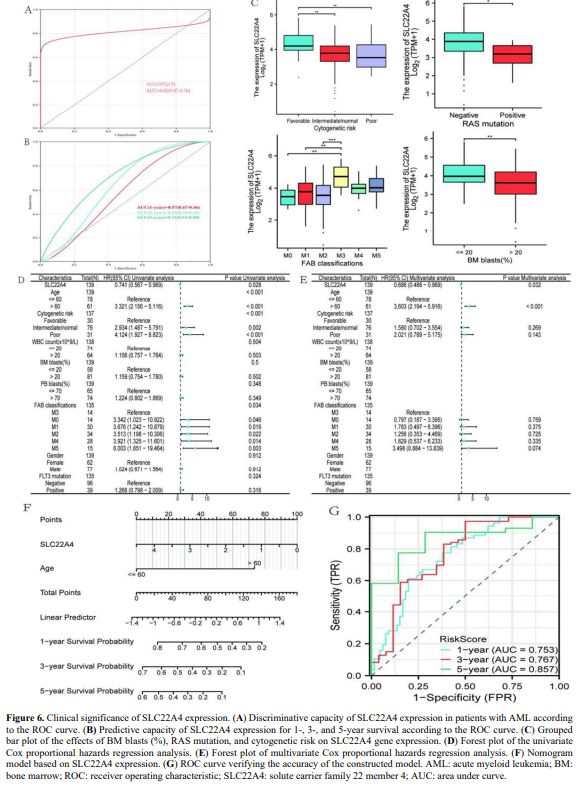 |
Figure 6. Clinical significance of SLC22A4 expression. (A) Discriminative capacity of SLC22A4 expression in patients with AML according to the ROC curve. (B) Predictive capacity of SLC22A4 expression for 1-, 3-, and 5-year survival according to the ROC curve. (C) Grouped bar plot of the effects of BM blasts (%), RAS mutation, and cytogenetic risk on SLC22A4 gene expression. (D) Forest plot of the univariate Cox proportional hazards regression analysis. (E) Forest plot of multivariate Cox proportional hazards regression analysis. (F) Nomogram model based on SLC22A4 expression. (G) ROC curve verifying the accuracy of the constructed model. AML: acute myeloid leukemia; BM: bone marrow; ROC: receiver operating characteristic; SLC22A4: solute carrier family 22 member 4; AUC: area under curve. |
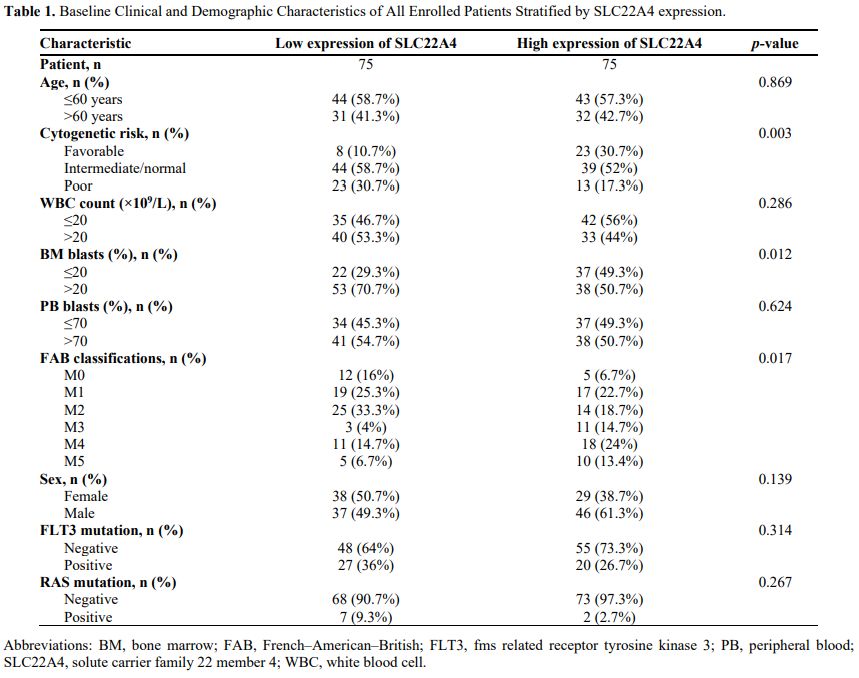 |
Table 1. Baseline Clinical and Demographic Characteristics of All Enrolled Patients Stratified by SLC22A4 expression. |
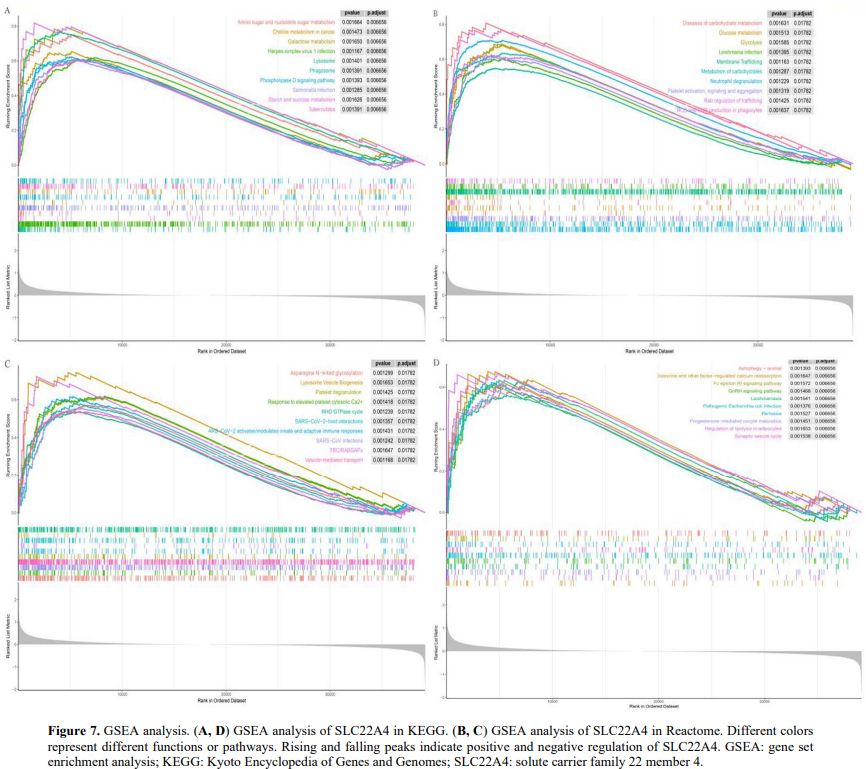
Biological Insights into Aberrant SLC22A4 Expression in AML. To analyse the biological functions of the SLC22A4 gene, we performed differential analysis on TCGA-AML samples stratified by SLC22A4 expression. We then performed pathway enrichment analysis for SLC22A4 using GSEA. Under the KEGG signature, enrichment was observed in metabolic transport and immune- and tumour-related pathways, including the Fc epsilon receptor I signalling pathway, choline metabolism in cancer, herpes simplex virus 1 infection, Salmonella infection, and galactose metabolism (Figures 7A, D). Similarly, Reactome analysis identified enrichment in pathways such as Leishmania infection, reactive oxygen and nitrogen species production in phagocytes, SARS−CoV−2−host interactions, and Rab regulation of trafficking (Figures 7B, C).
 |
|
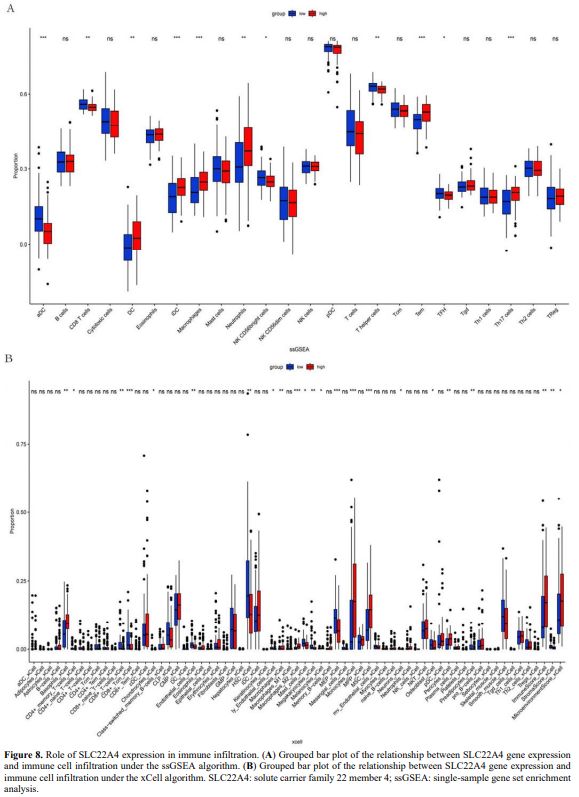
Effect of SLC22A4 Expression on Immune Infiltration in AML. Single-sample GSEA analysis was performed to analyse the effect of SLC22A4 expression on immune infiltration in AML. SLC22A4 expression was positively correlated with dendritic cells (DCs), interstitial DCs, macrophages, neutrophils, effector memory T, and T helper 17 (Th17) cells. In contrast, negative correlations were observed with activated dendritic cells (aDCs), CD8 T cells, natural killer (NK) CD56bright cells, Th cells, and T follicular helper cells (p < 0.05; Figure 8A). xCell analysis showed that SLC22A4 expression was positively correlated with Basophils_xCell, CD4+_memory_T−cells, CD8+_T−cells, Macrophages, Monocytes, MSC_xCell, Pericytes, ImmuneScore, and MicroenvironmentScore, whereas negative correlations were observed with CD8+_Tcm, Chondrocytes_xCell, Endothelial_cells_xCell, HSC_xCell, ly_Endothelial_cells, Mast_cells_xCell, Megakaryocytes_xCell, Melanocytes_xCell, MEP, Neurons, Osteoblast, Preadipocytes_xCell, and StromaScore_xCell (p < 0.05; Figure 8B).
 |
|
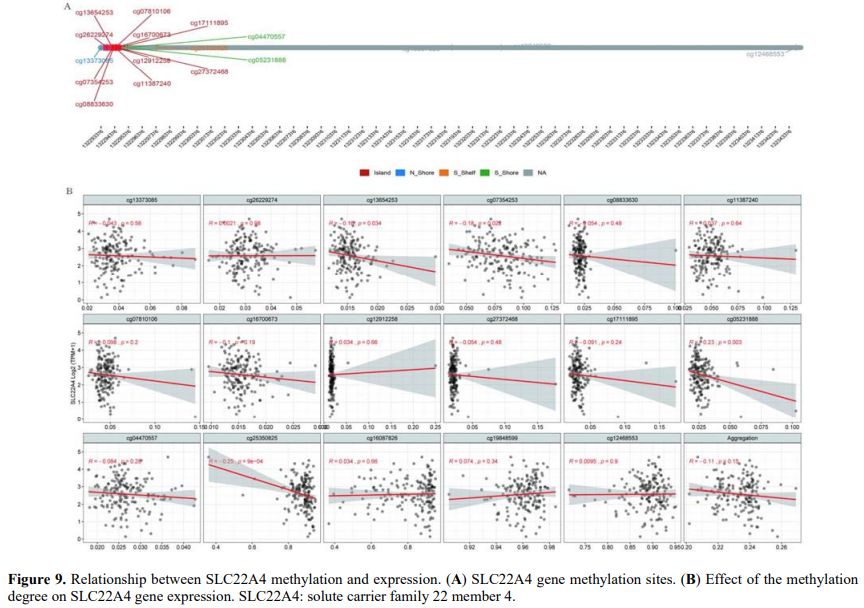
Transcriptional Regulatory Effects of SLC22A4 Promoter Methylation on Its Expression. Methylation sites on the SLC22A4 gene were searched to analyse the relationship between methylation and expression. The methylation sites located in the CpG island region of the SLC22A4 gene included cg26229274, cg13654253, cg07354253, cg08833630, cg11387240, cg07810106, cg16700673, cg12912258, cg27372468, cg17111895, cg13373085, cg05231888, cg04470557, and cg16087826 (Figure 9A). The correlation between the degree of methylation at these sites and SLC22A4 expression was analysed, finding that the methylation levels at four sites, namely cg13654253 (R = −0.16, p = 0.034), cg07354253 (R = −0.18, p = 0.022), cg05231888 (R = −0.23, p = 0.003), and cg25350825 (R = −0.25, p = 9e−04), were significantly negatively correlated with gene expression (Figure 9B).
 |
|
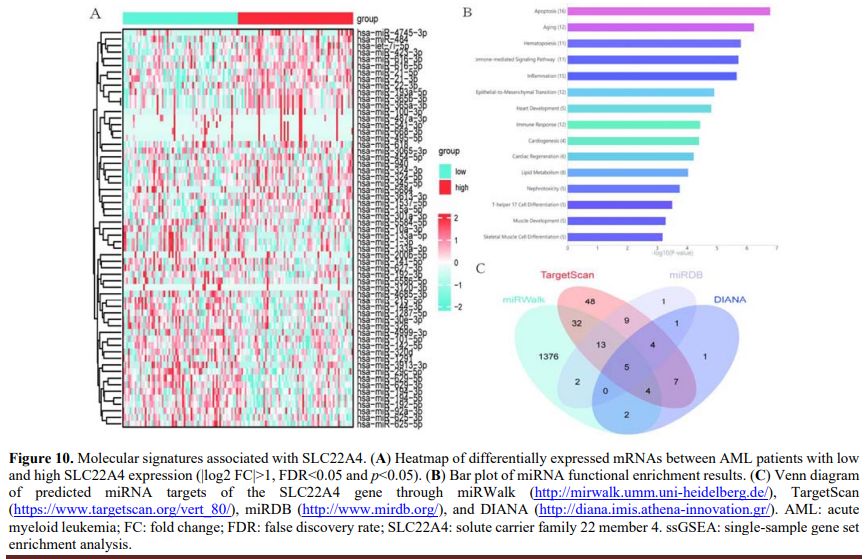
Molecular Signature Correlated with SLC22A4 Expression. To explore the biological network induced by abnormal SLC22A4 expression in AML, the transcriptomes of TCGA-AML samples with lower and higher SLC22A4 expression were compared. The results revealed differences in miRNA expression (|log2 fold change|>0, false discovery rate <1, and p < 0.05; Figure 10A). Subsequently, functional enrichment analysis of the 61 differentially expressed miRNAs showed that the enriched pathways were mainly related to blood and immunity (e.g., 11, 12, and 15 miRNAs enriched in the haematopoiesis, immune response, and inflammation pathways, respectively) (Figure 10B). Next, four datasets (miRWalk, TargetScan, miRDB, and DIANA) were used to predict miRNAs that regulate SLC22A4 gene expression. The results suggest that five miRNAs (hsa-miR-1299, hsa-miR-1910-5p, hsa-miR-3659, hsa-miR-5093, and hsa-miR-6831-3p) in all four datasets regulate SLC22A4 gene expression (Figure 10C).
 |
|
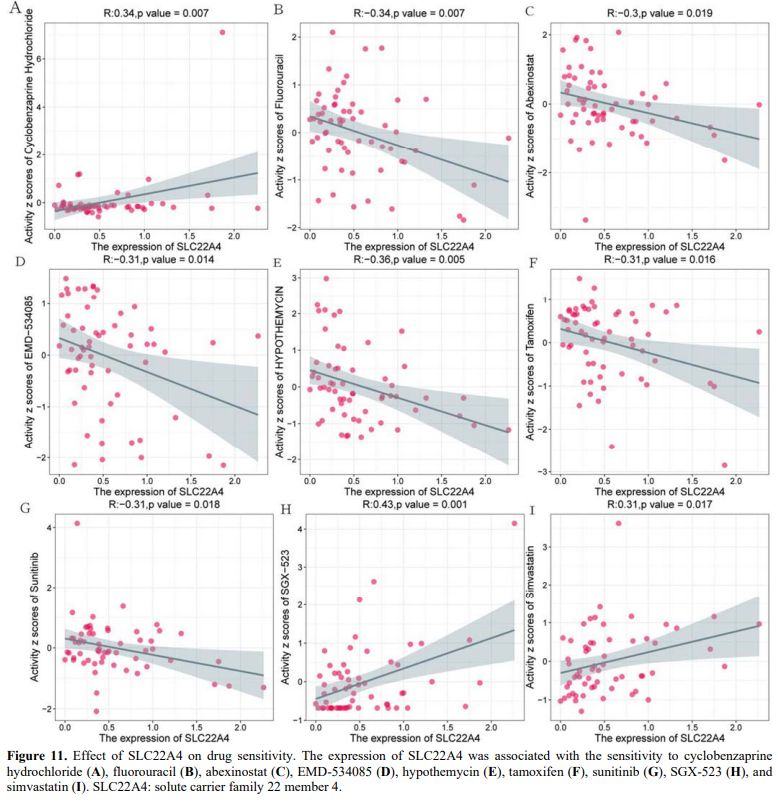
Effect of SLC22A4 on Drug Sensitivity. We used the CellMiner database to analyse the effect of SLC22A4 expression on drug sensitivity, finding that SLC22A4 expression was positively correlated with sensitivity to cyclobenzaprine hydrochloride, SGX-523, and simvastatin (Figures 11A, H, I). However, SLC22A4 expression was negatively correlated with sensitivity to fluorouracil, abexinostat, EMD-534085, hypothemycin, tamoxifen, and sunitinib (Figures 11B–G).
 |
|
Discussion
We sought to identify key molecules relevant to AML by screening gene modules using WGCNA to detect DEGs related to immune markers. Ultimately, the analysis identified SLC22A4 as a target gene. The results of the survival analysis, baseline tables, and Cox proportional hazards regression analysis showed that SLC22A4 gene expression is significantly downregulated in AML and associated with various clinical features, such as bone marrow blast percentage, cytogenetic risk, and RAS mutation. Moreover, we found that decreased SLC22A4 expression is an independent prognostic factor for patients with AML, with lower expression levels correlating with poorer prognosis and shorter survival time. Buelow et al. reported that increased SLC22A4 expression was associated with improved overall survival and event-free survival in AML (OCTN1 is a high-affinity carrier of nucleoside analogues).[17] This evidence is consistent with the results of our study and highlights the important role of SLC22A4 in the development of AML.In this study, we conducted a pan-omics analysis of large public data sets (TCGA-AML and six GEO series; >600 samples). First, WGCNA identified a brown module whose eigengenes co-vary with immune scores; intersecting this module with DEGs nominated SLC22A4. LASSO-Cox modelling subsequently verified SLC22A4 as the strongest prognostic factor. We next observed that low SLC22A4 expression correlated with higher bone-marrow blast percentages, RAS mutations, and adverse cytogenetic risk, and we built a nomogram whose AUC exceeded 0.8. By integrating methylation arrays, miRNA-target prediction, ssGSEA/xCell immune-infiltration algorithms, and the CellMiner drug-sensitivity database, we demonstrated for the first time that SLC22A4 expression is positively and negatively associated with multiple immune subsets, including DCs, Th17, CD8⁺ T cells, and M2 macrophages, proposing a “metabolism–immune dual-axis” that may influence therapeutic efficacy. We further identified five miRNAs and several CpG sites that participate in its epigenetic regulation and screened out potential sensitisers, such as cyclobenzaprine, SGX-523, and simvastatin, thus expanding the spectrum of combinatorial options.
Furthermore, the present study revealed a strong relationship between SLC22A4 gene expression and immune cell infiltration in AML. Both xCell and EPIC analyses demonstrated a correlation between SLC22A4 gene expression and T cells and macrophages, with numerous positive correlations. Enrichment analyses (GSEA and miRNA) also showed that SLC22A4 gene expression is associated with certain infection- and immune-related pathways, suggesting that overexpression of SLC22A4 may enhance immune cell infiltration by upregulating certain substance transport pathways, thereby exerting an anti-tumour effect.
With the enhanced understanding of the molecular mechanisms of AML, the use of immunotherapy has achieved notable results. For example, treatment of CD34+ AML cells with vascular endothelial growth factor C monoclonal antibody can promote their differentiation into myeloid cells by inhibiting forkhead box O3a and ERK/MAPK proliferation signals, thereby improving patient prognosis.[41] Mesothelin-targeted bispecific antibodies may also be a promising immunotherapeutic option for mesothelin-positive paediatric patients with AML.[42] The ssGSEA algorithm is useful in predicting tumour immune-related genes and actual situations.[43,44]
In this study, SLC22A4 expression was positively correlated with DCs, interstitial DCs, macrophages, neutrophils, effector memory T cells, and Th17 cells, but negatively correlated with aDCs, CD8 T cells, NK CD56bright cells, and Th cells. These findings suggest that low SLC22A4 expression may inhibit the activation and function of pro-inflammatory immune cells (e.g., Th17 cells), weaken antigen presentation and T-cell activation, and affect the production and function of inflammatory factors (e.g., IFN-γ, TNF-α, and cytokines). The xCell algorithm was used to verify the results of ssGSEA. This method showed that SLC22A4 expression was positively correlated with CD4+_memory_T−cells, CD8+_T−cells, and macrophages, among others. These results indicate that downregulation of SLC22A4 expression may weaken the effect of immunotherapy through multiple effects, such as inhibiting immune effector cells, enhancing immunosuppressive cells, influencing cytokine networks and the microenvironment, and affecting stem cell functions. Both algorithms showed that SLC22A4 was significantly correlated with multiple immune cells, such as T cells, DCs, and macrophages. SLC22A4 was positively correlated with pro-inflammatory cells (e.g., Th17 cells and DCs) and negatively correlated with cytotoxic cells (e.g., aDCs and CD8 T cells). It was also positively correlated with immunosuppressive cells (e.g., M2 macrophages). These results suggest that SLC22A4 is involved in regulating the function and activity of these cells, while playing a role in the regulation of inflammation and immune balance. Moreover, it may play a role in the immunosuppression process. In summary, SLC22A4 gene expression may guide the prognosis of immunotherapy in AML.
The prognostic significance of SLC22A4 likely stems from its dual roles in drug transport and immune modulation. As a high-affinity transporter of nucleoside analogues, reduced SLC22A4 expression may limit intracellular drug accumulation, enabling leukaemic-cell survival – a hypothesis supported by its positive correlation with sensitivity to cytarabine derivatives.[17] This duality may reflect context-dependent interactions; for instance, SLC22A4's link to M2 macrophages (a tissue-repair phenotype) could indicate a compensatory mechanism in which chronic inflammation fosters immunosuppression.[45] Early-stage SLC22A4 loss could impair effector immune responses (e.g., CD8+ T-cell activation), and compensatory recruitment of M2 macrophages might occur in later stages to mitigate tissue damage, a phenomenon also observed in solid tumours.[46]
Furthermore, SLC22A4 encodes the transporter OCTN1, which is associated with drug transport.[15] OCTN1 also contributes to the transport of cytarabine in AML cells.[47] We found that SLC22A4 expression was positively correlated with sensitivity to cyclobenzaprine hydrochloride, SGX-523, and simvastatin, and negatively correlated with sensitivity to fluorouracil, abexinostat, EMD-534085, hypothemycin, tamoxifen, and sunitinib. These results suggest that SLC22A4 expression is a marker for drug treatment.
We analysed the epigenetic factors that affect SLC22A4 gene expression, including gene methylation and miRNAs. We identified four methylation sites that are negatively related to SLC22A4 gene expression (cg13654253, cg07354253, cg05231888, and cg25350825) and five miRNAs (hsa-miR-1299, hsa-miR-1910-5p, hsa-miR-3659, hsa-miR-5093, and hsa-miR-6831-3p).
Although this study provides valuable insights into the role of SLC22A4 in AML, it has several limitations. First, investigation of the molecular mechanisms involved in the process is lacking. Our analyses were entirely bioinformatics-based and lacked experimental validation, despite the use of multiple datasets to minimise potential bias. Although bioinformatics analysis plays an important role in the management of AML, experimental validation using in vitro models is required to advance this research. Specifically, knockdown and overexpression models can be employed to assess the impact of SLC22A4 on drug sensitivity, such as cytarabine LC50, and its role in immune cell crosstalk, including macrophage polarisation. Additionally, preclinical testing in murine AML models is essential to evaluate the efficacy of OCTN1 agonists or demethylating therapies in restoring SLC22A4 function.
Second, the correlations between SLC22A4 expression and drug IC50 values were mined from the CellMiner database. However, NCI-60 comprises predominantly solid-tumour cell lines and lacks representative acute myeloid leukaemia (AML) models. Consequently, the observed associations should be viewed as exploratory hypotheses rather than definitive predictors of chemosensitivity in AML. Follow-up studies in HL-60, KG-1, OCI-AML3 (AML cell lines), and primary patient blasts are essential to validate whether modulating SLC22A4 truly alters the potency of the identified compounds.
Third, all conclusions in this work derive from publicly available omics data; no cellular, animal, or clinical specimens were experimentally interrogated. Key assertions, such as SLC22A4-mediated control of cytarabine uptake, immune-cell polarisation, or methylation-driven silencing, therefore, remain correlative. CRISPR knock-out/overexpression models, patient-derived xenografts, and leukaemia-initiating-cell assays are required to establish causality and to quantify the translational value of SLC22A4 as a therapeutic target. Finally, immune-cell fractions were estimated with xCell and EPIC algorithms. Although convenient, these tools infer relative abundance solely from bulk transcriptomes and are sensitive to tumour purity, batch effects, and the choice of signature genes. Without orthogonal validation by flow cytometry, immunohistochemistry, or multiplex immunofluorescence on paired bone-marrow biopsies, the reported immune landscapes reflect statistical associations rather than true cellular localisation or functional status. Future investigations should integrate experimental immunophenotyping to confirm the link between SLC22A4 expression and specific leukemic micro-environmental compositions.
Translational Implications: From Biomarker to Therapeutic Target
To translate SLC22A4 into clinical practice, two strategies are proposed. The first strategy involves the use of OCTN1 agonists, such as small molecules that enhance SLC22A4/OCTN1 activity. These molecules, including ergothioneine analogues, have the potential to restore cytarabine uptake in SLC22A4-low AML, thereby synergising with conventional chemotherapy. The second strategy focuses on demethylating agents, such as azacitidine. These agents may reverse SLC22A4 silencing, as there is a strong negative correlation between promoter methylation and expression. This approach could potentially reactivate SLC22A4 expression and improve treatment outcomes in patients with AML.Conclusions
Through differential expression analysis, WGCNA screening of immune-related gene modules, and prognostic analysis, we identified SLC22A4 as an immune-associated gene signature and a factor of poor prognosis. SLC22A4 expression was significantly decreased in AML, and higher expression was associated with a good prognosis of survival. The degree of methylation and some miRNAs may participate in the regulation of SLC22A4 expression. Moreover, SLC22A4 expression was correlated with drug sensitivity. Whether restoring SLC22A4 expression (e.g., via hypomethylating agents) or modulating its transport activity (e.g., with OCTN1 ligands) will alter leukaemic-cell survival or immune recognition remains an open question that must be tested in functional assays and in prospective preclinical models.Availability of Data and Materials
Data for a total of 151 de novo AML samples from The Cancer Genome Atlas (TCGA) database (AML NEJM 2013; https://portal.gdc.cancer.gov/) were included in this study; survival data were available for 142 of those. The AML RNA-sequencing dataset was downloaded from the UCSC Xena database (https://xenabrowser.net/datapages/).Authors' Contributions
Li YY and Li Y conceived and designed the study. Li YY and Cheng WG collected the data. Li Y helped with the data analysis and statistics. All authors took part in drafting the manuscript. All authors read and approved the final manuscript.References
- Fodil S, Chevret S, Rouzaud C, Valade S, Rabian F,
Mariotte E, Raffoux E, Itzykson R, Boissel N, Sébert M, Adès L, Zafrani
L, Azoulay E, Lengliné E. Post-remission outcomes in AML patients with
high hyperleukocytosis and inaugural life-threatening complications.
PLoS One. 2022 Jul 7;17(7):e0270744. https://doi.org/10.1371/journal.pone.0270744 PMid:35797337 PMCid:PMC9262217
- Nepstad
I, Hatfield KJ, Grønningsæter IS, Reikvam H. The PI3K-Akt-mTOR
Signaling Pathway in Human Acute Myeloid Leukemia (AML) Cells. Int J
Mol Sci. 2020 Apr 21;21(8):2907. https://doi.org/10.3390/ijms21082907 PMid:32326335 PMCid:PMC7215987
- Vegunta
R, Harel R, Steinberg A. Intensified-Dose Chemotherapy in Combination
With Gemtuzumab-Ozogamicin for the Treatment of Favorable-Risk Acute
Myeloid Leukemia (AML). Cureus. 2022 Jun 23;14(6):e26240. https://doi.org/10.7759/cureus.26240 PMid:35898381 PMCid:PMC9308398
- Alsulami
HA, Alnashri MM, Bawazir AF, Alrashid LT, Dly RA, Alharbi YA, Qari MH.
Prognostics and Clinical Outcomes in Patients Diagnosed With Acute
Myeloid Leukemia (AML) in a Teaching Hospital. Cureus. 2021 Oct
20;13(10):e18915. https://doi.org/10.7759/cureus.18915
- Doucette
K, Karp J, Lai C. Advances in therapeutic options for newly diagnosed,
high-risk AML patients. Ther Adv Hematol. 2021 May
5;12:20406207211001138. https://doi.org/10.1177/20406207211001138 PMid:33995985 PMCid:PMC8111550
- Chien
LN, Tzeng HE, Liu HY, Chou WC, Tien HF, Hou HA. Epidemiology and
survival outcomes of acute myeloid leukemia patients in Taiwan: A
national population-based analysis from 2001 to 2015. J Formos Med
Assoc. 2023 Jun;122(6):505-513. https://doi.org/10.1016/j.jfma.2022.10.007 PMid:36369106
- Sasaki
K, Ravandi F, Kadia TM, DiNardo CD, Short NJ, Borthakur G, Jabbour E,
Kantarjian HM. De novo acute myeloid leukemia: A population-based study
of outcome in the United States based on the Surveillance,
Epidemiology, and End Results (SEER) database, 1980 to 2017. Cancer.
2021 Jun 15;127(12):2049-2061. https://doi.org/10.1002/cncr.33458 PMid:33818756 PMCid:PMC11826308
- Takahashi
T, Turcotte LM, Gordon PM, Johnson AD, Rubin N, Spector LG. Therapeutic
Leukapheresis in Pediatric Leukemia: Utilization Trend and Early
Outcomes in a US Nationwide Cohort. J Pediatr Hematol Oncol. 2022 Mar
1;44(2):47-53. https://doi.org/10.1097/MPH.0000000000002140 PMid:33735152 PMCid:PMC8568727
- Liu
L, Liu J, Liu XJ, Liu MH, Feng XF, Yang L, Luo JM. SPAG1 promotes the
development of AML by activating the ERK/MAPK signaling pathway and
affects the chemotherapy sensitivity of venetoclax. Neoplasma. 2022
Sep;69(5):1108-1118. https://doi.org/10.4149/neo_2022_220415N416 PMid:35951456
- Wu
Y, Hurren R, MacLean N, Gronda M, Jitkova Y, Sukhai MA, Minden MD,
Schimmer AD. Carnitine transporter CT2 (SLC22A16) is over-expressed in
acute myeloid leukemia (AML) and target knockdown reduces growth and
viability of AML cells. Apoptosis. 2015 Aug;20(8):1099-108. https://doi.org/10.1007/s10495-015-1137-x PMid:25998464
- Guo
C, Ju QQ, Zhang CX, Gong M, Li ZL, Gao YY. Overexpression of HOXA10 is
associated with unfavorable prognosis of acute myeloid leukemia. BMC
Cancer. 2020 Jun 22;20(1):586. https://doi.org/10.1186/s12885-020-07088-6 PMid:32571260 PMCid:PMC7310421
- Xiong
H, Zhang X, Chen X, Liu Y, Duan J, Huang C. High expression of ISG20
predicts a poor prognosis in acute myeloid leukemia. Cancer Biomark.
2021;31(3):255-261. https://doi.org/10.3233/CBM-210061 PMid:33896836
- Elsherif
M, Hammad M, Hafez H, Yassin D, Ashraf M, Yasser N, Lehmann L, Elhaddad
A. MECOM gene overexpression in pediatric patients with acute myeloid
leukemia. Acta Oncol. 2022 Apr;61(4):516-522. https://doi.org/10.1080/0284186X.2022.2025611 PMid:35038958
- Zhai
Z, Li C, Chen L, Zhao Y, Tang X, Cao L, Sun H, Zhong Z.
Antibody-mediated ratiometric delivery of FLT3 and CDK4/6 dual
inhibitors for targeted treatment of acute myeloid leukemia. J Control
Release. 2025 Jun 6;384:113934. https://doi.org/10.1016/j.jconrel.2025.113934 PMid:40482924
- Pommert
L, Tarlock K. The evolution of targeted therapy in pediatric AML:
gemtuzumab ozogamicin, FLT3/IDH/BCL2 inhibitors, and other therapies.
Hematology Am Soc Hematol Educ Program. 2022 Dec 9;2022(1):603-610. https://doi.org/10.1182/hematology.2022000358 PMid:36485125 PMCid:PMC9819987
- Abaza
Y, Zeidan AM. Immune Checkpoint Inhibition in Acute Myeloid Leukemia
and Myelodysplastic Syndromes. Cells. 2022 Jul 20;11(14):2249. https://doi.org/10.3390/cells11142249 PMid:35883692 PMCid:PMC9318025
- Buelow
DR, Anderson JT, Pounds SB, Shi L, Lamba JK, Hu S, Gibson AA, Goodwin
EA, Sparreboom A, Baker SD. DNA Methylation-Based Epigenetic Repression
of SLC22A4 Promotes Resistance to Cytarabine in Acute Myeloid Leukemia.
Clin Transl Sci. 2021 Jan;14(1):137-142. https://doi.org/10.1111/cts.12861 PMid:32905646 PMCid:PMC7877866
- Liu
Y, Li C, Su R, Yin Z, Huang G, Yang J, Li Z, Zhang K, Fei J. Targeting
SOS1 overcomes imatinib resistance with BCR-ABL independence through
uptake transporter SLC22A4 in CML. Mol Ther Oncolytics. 2021 Nov
20;23:560-570. https://doi.org/10.1016/j.omto.2021.11.010 PMid:34938856 PMCid:PMC8654699
- Barrett
T, Wilhite SE, Ledoux P, Evangelista C, Kim IF, Tomashevsky M, Marshall
KA, Phillippy KH, Sherman PM, Holko M, Yefanov A, Lee H, Zhang N,
Robertson CL, Serova N, Davis S, Soboleva A. NCBI GEO: archive for
functional genomics data sets--update. Nucleic Acids Res. 2013
Jan;41(Database issue):D991-5. https://doi.org/10.1093/nar/gks1193 PMid:23193258 PMCid:PMC3531084
- Bosman
MC, Schepers H, Jaques J, Brouwers-Vos AZ, Quax WJ, Schuringa JJ,
Vellenga E. The TAK1-NF-κB axis as therapeutic target for AML. Blood.
2014 Nov 13;124(20):3130-40. https://doi.org/10.1182/blood-2014-04-569780 PMid:25287709
- de
Jonge HJ, Woolthuis CM, Vos AZ, Mulder A, van den Berg E, Kluin PM, van
der Weide K, de Bont ES, Huls G, Vellenga E, Schuringa JJ. Gene
expression profiling in the leukemic stem cell-enriched CD34+ fraction
identifies target genes that predict prognosis in normal karyotype AML.
Leukemia. 2011 Dec;25(12):1825-33. https://doi.org/10.1038/leu.2011.172 PMid:21760593
- Herold
T, Jurinovic V, Batcha AMN, Bamopoulos SA, Rothenberg-Thurley M,
Ksienzyk B, Hartmann L, Greif PA, Phillippou-Massier J, Krebs S, Blum
H, Amler S, Schneider S, Konstandin N, Sauerland MC, Görlich D, Berdel
WE, Wörmann BJ, Tischer J, Subklewe M, Bohlander SK, Braess J,
Hiddemann W, Metzeler KH, Mansmann U, Spiekermann K. A 29-gene and
cytogenetic score for the prediction of resistance to induction
treatment in acute myeloid leukemia. Haematologica. 2018
Mar;103(3):456-465. https://doi.org/10.3324/haematol.2017.178442 PMid:29242298 PMCid:PMC5830382
- Herold
T, Metzeler KH, Vosberg S, Hartmann L, Röllig C, Stölzel F, Schneider
S, Hubmann M, Zellmeier E, Ksienzyk B, Jurinovic V, Pasalic Z, Kakadia
PM, Dufour A, Graf A, Krebs S, Blum H, Sauerland MC, Büchner T, Berdel
WE, Woermann BJ, Bornhäuser M, Ehninger G, Mansmann U, Hiddemann W,
Bohlander SK, Spiekermann K, Greif PA. Isolated trisomy 13 defines a
homogeneous AML subgroup with high frequency of mutations in
spliceosome genes and poor prognosis. Blood. 2014 Aug
21;124(8):1304-11. https://doi.org/10.1182/blood-2013-12-540716 PMid:24923295
- Kuett
A, Rieger C, Perathoner D, Herold T, Wagner M, Sironi S, Sotlar K,
Horny HP, Deniffel C, Drolle H, Fiegl M. IL-8 as mediator in the
microenvironment-leukaemia network in acute myeloid leukaemia. Sci Rep.
2015 Dec 17;5:18411. https://doi.org/10.1038/srep18411 PMid:26674118 PMCid:PMC4682064
- Li
Z, Herold T, He C, Valk PJ, Chen P, Jurinovic V, Mansmann U, Radmacher
MD, Maharry KS, Sun M, Yang X, Huang H, Jiang X, Sauerland MC, Büchner
T, Hiddemann W, Elkahloun A, Neilly MB, Zhang Y, Larson RA, Le Beau MM,
Caligiuri MA, Döhner K, Bullinger L, Liu PP, Delwel R, Marcucci G,
Lowenberg B, Bloomfield CD, Rowley JD, Bohlander SK, Chen J.
Identification of a 24-gene prognostic signature that improves the
European LeukemiaNet risk classification of acute myeloid leukemia: an
international collaborative study. J Clin Oncol. 2013 Mar
20;31(9):1172-81. https://doi.org/10.1200/JCO.2012.44.3184 PMid:23382473 PMCid:PMC3595425
- Metzeler
KH, Hummel M, Bloomfield CD, Spiekermann K, Braess J, Sauerland MC,
Heinecke A, Radmacher M, Marcucci G, Whitman SP, Maharry K, Paschka P,
Larson RA, Berdel WE, Büchner T, Wörmann B, Mansmann U, Hiddemann W,
Bohlander SK, Buske C; Cancer and Leukemia Group B; German AML
Cooperative Group. An 86-probe-set gene-expression signature predicts
survival in cytogenetically normal acute myeloid leukemia. Blood. 2008
Nov 15;112(10):4193-201. https://doi.org/10.1182/blood-2008-02-134411 PMid:18716133 PMCid:PMC2954679
- Payton
JE, Grieselhuber NR, Chang LW, Murakami M, Geiss GK, Link DC, Nagarajan
R, Watson MA, Ley TJ. High throughput digital quantification of mRNA
abundance in primary human acute myeloid leukemia samples. J Clin
Invest. 2009 Jun;119(6):1714-26. https://doi.org/10.1172/JCI38248 PMid:19451695 PMCid:PMC2689138
- Stirewalt
DL, Meshinchi S, Kopecky KJ, Fan W, Pogosova-Agadjanyan EL, Engel JH,
Cronk MR, Dorcy KS, McQuary AR, Hockenbery D, Wood B, Heimfeld S,
Radich JP. Identification of genes with abnormal expression changes in
acute myeloid leukemia. Genes Chromosomes Cancer. 2008 Jan;47(1):8-20. https://doi.org/10.1002/gcc.20500 PMid:17910043
- Reinhold
WC, Sunshine M, Liu H, Varma S, Kohn KW, Morris J, Doroshow J, Pommier
Y. CellMiner: a web-based suite of genomic and pharmacologic tools to
explore transcript and drug patterns in the NCI-60 cell line set.
Cancer Res. 2012 Jul 15;72(14):3499-511. https://doi.org/10.1158/0008-5472.CAN-12-1370 PMid:22802077 PMCid:PMC3399763
- Langfelder P, Horvath S. WGCNA: an R package for weighted correlation network analysis. BMC Bioinformatics. 2008 Dec 29;9:559. https://doi.org/10.1186/1471-2105-9-559 PMid:19114008 PMCid:PMC2631488
- Guo
C, Gao YY, Ju QQ, Zhang CX, Gong M, Li ZL. The landscape of gene
co-expression modules correlating with prognostic genetic abnormalities
in AML. J Transl Med. 2021 May 29;19(1):228. https://doi.org/10.1186/s12967-021-02914-2 PMid:34051812 PMCid:PMC8164775
- Zheng
Y, Zhou Y, Zhu D, Fu X, Xie C, Sun S, Qin G, Feng M, Liu C, Zhou Q, Liu
F, Chu C, Wang F, Yang D, Wang MW, Gui Y. Single-cell mapping of
peripheral blood mononuclear cells reveals key transcriptomic changes
favoring coronary artery lesion in IVIG-resistant Kawasaki disease.
Heliyon. 2024 Sep 12;10(18):e37857. https://doi.org/10.1016/j.heliyon.2024.e37857 PMid:39323779 PMCid:PMC11422586
- Aran
D, Hu Z, Butte AJ. xCell: digitally portraying the tissue cellular
heterogeneity landscape. Genome Biol. 2017 Nov 15;18(1):220. https://doi.org/10.1186/s13059-017-1349-1 PMid:29141660 PMCid:PMC5688663
- Zeng
D, Ye Z, Shen R, Yu G, Wu J, Xiong Y, Zhou R, Qiu W, Huang N, Sun L, Li
X, Bin J, Liao Y, Shi M, Liao W. IOBR: Multi-Omics Immuno-Oncology
Biological Research to Decode Tumor Microenvironment and Signatures.
Front Immunol. 2021 Jul 2;12:687975. https://doi.org/10.3389/fimmu.2021.687975 PMid:34276676 PMCid:PMC8283787
- Hänzelmann
S, Castelo R, Guinney J. GSVA: gene set variation analysis for
microarray and RNA-seq data. BMC Bioinformatics. 2013 Jan 16;14:7. https://doi.org/10.1186/1471-2105-14-7 PMid:23323831 PMCid:PMC3618321
- Bindea
G, Mlecnik B, Tosolini M, Kirilovsky A, Waldner M, Obenauf AC, Angell
H, Fredriksen T, Lafontaine L, Berger A, Bruneval P, Fridman WH, Becker
C, Pagès F, Speicher MR, Trajanoski Z, Galon J. Spatiotemporal dynamics
of intratumoral immune cells reveal the immune landscape in human
cancer. Immunity. 2013 Oct 17;39(4):782-95. https://doi.org/10.1016/j.immuni.2013.10.003 PMid:24138885
- Subramanian
A, Tamayo P, Mootha VK, Mukherjee S, Ebert BL, Gillette MA, Paulovich
A, Pomeroy SL, Golub TR, Lander ES, Mesirov JP. Gene set enrichment
analysis: a knowledge-based approach for interpreting genome-wide
expression profiles. Proc Natl Acad Sci U S A. 2005 Oct
25;102(43):15545-50. https://doi.org/10.1073/pnas.0506580102 PMid:16199517 PMCid:PMC1239896
- Wu
T, Hu E, Xu S, Chen M, Guo P, Dai Z, Feng T, Zhou L, Tang W, Zhan L, Fu
X, Liu S, Bo X, Yu G. clusterProfiler 4.0: A universal enrichment tool
for interpreting omics data. Innovation (Camb). 2021 Jul 1;2(3):100141.
https://doi.org/10.1016/j.xinn.2021.100141 PMid:34557778 PMCid:PMC8454663
- Yu
G, Wang LG, Han Y, He QY. clusterProfiler: an R package for comparing
biological themes among gene clusters. OMICS. 2012 May;16(5):284-7. https://doi.org/10.1089/omi.2011.0118 PMid:22455463 PMCid:PMC3339379
- Li
Y, Ge D, Lu C. The SMART App: an interactive web application for
comprehensive DNA methylation analysis and visualization. Epigenetics
Chromatin. 2019 Dec 5;12(1):71. https://doi.org/10.1186/s13072-019-0316-3 PMid:31805986 PMCid:PMC6894252
- Kampen
KR, Scherpen FJG, Mahmud H, Ter Elst A, Mulder AB, Guryev V, Verhagen
HJMP, De Keersmaecker K, Smit L, Kornblau SM, De Bont ESJM. VEGFC
Antibody Therapy Drives Differentiation of AML. Cancer Res. 2018 Oct
15;78(20):5940-5948. https://doi.org/10.1158/0008-5472.CAN-18-0250 PMid:30185550
- Gopalakrishnapillai
A, Correnti CE, Pilat K, Lin I, Chan MK, Bandaranayake AD, Mehlin C,
Kisielewski A, Hamill D, Kaeding AJ, Meshinchi S, Olson JM, Kolb EA,
Barwe SP. Immunotherapeutic Targeting of Mesothelin Positive Pediatric
AML Using Bispecific T Cell Engaging Antibodies. Cancers (Basel). 2021
Nov 26;13(23):5964. https://doi.org/10.3390/cancers13235964 PMid:34885074 PMCid:PMC8657033
- Jin
Y, Wang Z, He D, Zhu Y, Chen X, Cao K. Identification of novel subtypes
based on ssGSEA in immune-related prognostic signature for tongue
squamous cell carcinoma. Cancer Med. 2021 Dec;10(23):8693-8707. https://doi.org/10.1002/cam4.4341 PMid:34668665 PMCid:PMC8633230
- Yuan
K, Zeng R, Deng P, Zhang A, Liu H, Wang N, Tang Y, Yin Z, Liu H.
Identification and Verification of Immune-Related Genes Prognostic
Signature Based on ssGSEA for Adrenocortical Carcinoma (ACC). Int J Gen
Med. 2022 Feb 15;15:1471-1483. https://doi.org/10.2147/IJGM.S345123 PMid:35210821 PMCid:PMC8857983
- Shimizu
T, Masuo Y, Takahashi S, Nakamichi N, Kato Y. Organic cation
transporter Octn1-mediated uptake of food-derived antioxidant
ergothioneine into infiltrating macrophages during intestinal
inflammation in mice. Drug Metab Pharmacokinet. 2015 Jun;30(3):231-9. https://doi.org/10.1016/j.dmpk.2015.02.003 PMid:26003890
- Pochini
L, Galluccio M, Console L, Scalise M, Eberini I, Indiveri C.
Inflammation and Organic Cation Transporters Novel (OCTNs).
Biomolecules. 2024 Mar 25;14(4):392. https://doi.org/10.3390/biom14040392 PMid:38672410 PMCid:PMC11048549
- Drenberg
CD, Gibson AA, Pounds SB, Shi L, Rhinehart DP, Li L, Hu S, Du G, Nies
AT, Schwab M, et al. OCTN1 Is a High-Affinity Carrier of Nucleoside
Analogues. Cancer Res 2017, 77, 2102-2111. https://doi.org/10.1158/0008-5472.CAN-16-2548 PMid:28209616 PMCid:PMC5419029