Current standard of care guidelines recommend an annual screening with a 2-h OGTT for all β-TDT patients aged 10 years and older.[5,6] The threshold value of 100 mg/dL for fasting glucose, as suggested by ADA[4] rather than 110 mg/dL as per the WHO,[3] was recommended by the International Network of Clinicians for Endocrinopathies in Thalassemia and Adolescent Medicine (ICET-A) based on the observation that almost half of β-TDT patients with fasting glucose 100-110 mg/dL developed IGT within the next few years.[7] Currently, the high cost and the long test time are the major limiting factors for the integration of OGTT into routine diabetic care. These factors explain the low adherence to annual OGTT in β-TDT patients. Moreover, the standard oral glucose solution is frequently associated with nausea and, in some cases, vomiting.[8]
Therefore, over the years, numerous investigators have sought alternative screening methods for early diagnosis of dysglycemia. Conflicting data have been reported about the diagnostic role of HbA1c and fructosamine in evaluating dysglycemia in β-TDT patients. The use of HbA1c as a screening test for abnormalities of glucose homeostasis in individuals with β-thalassemia major (β-TDT) appears to be less accurate.[9,10] To try to reduce the costs and to address poor patient adherence to OGTT, Dritsa et al.[8] suggested performing OGTT: (a) at the initiation of puberty; (b) in all patients with a fasting plasma glucose above 100 mg/dL, and (c) in any patient with a ΗΟΜΑ-IR index above 1.85, and to perform the test yearly onwards. Adopting these criteria, the researchers obtained a total reduction of 46.4% in the number of OGTTs performed.[11]
An Italian study has shown that in subjects with normal glucose tolerance (NGT), the time required for the PG concentration to return to, or drop below, the fasting PG level following glucose ingestion is dependent on the insulin response during the OGTT and peripheral/hepatic insulin sensitivity.[12] Notably, across the categories of normal 2-h glucose concentrations, those subjects in the higher 2-h-PG group manifested greater insulin resistance, reduced insulin secretion, and oral disposition index (oDI) compared to those with PG concentrations in the lower category.
Therefore, the ICET-A Network promoted a retrospective, multicenter observational study with its main objective being to determine whether the difference between FPG and 2 h-PG concentrations during OGTT could provide a reliable and simple additional index for predicting the associated risk of dysglycemia in β-TDT patients with normal FPG (< 100 mg/dL) and normoglycemia after glucose load, as defined by current OGTT criteria.
Patients and Methods
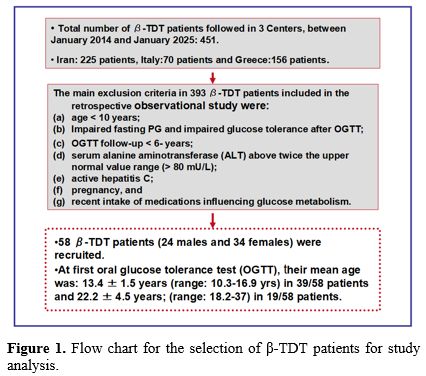
a. Study design, Setting, and Participants. This retrospective observational long-term study includes β-TDT patients followed and recruited from three Thalassemia centers (Iran, Italy and Greece), who underwent 2-h OGTT screening between January 2014 and January 2025. β-TDT was diagnosed using complete blood count, hemoglobin HPLC, and molecular characterization of the genotype in 54 of 58 patients.Eligible criteria for study inclusion were: (a) β-TDT patients receiving frequent blood transfusion and personalized regimes of iron chelation therapy; (b) chronological age ≥10 years (c) availability of 2h- OGTT, (d) normal glucose tolerance (NGT) defined by fasting glucose < 100 mg/dL, 1h -PG < 155 mg/dL, and 120-min PG < 140 mg/dL, and (e) patients' follow-up of no less than 6 and up to 8 years.
The main exclusion criteria included: (a) non-transfusion-dependent thalassemia (NTDT); (b) bone marrow transplanted patients; (c) β-TDT patients with serum alanine aminotransferase (ALT) above twice the upper normal value range (> 80 mU/L); (d) pregnancy; (e) active hepatitis C, and (f) recent intake of medications influencing glucose metabolism (such as: thiazide diuretics, beta-blockers and corticosteroids) (Figure 1).
 |
|
b. Clinical and biochemical measurements. Data collected at baseline OGTT included: age, gender, anthropometric measurements (standing height, weight, and body mass index), patients’ medical data (age at first transfusion, age of splenectomy, type and dose of chelating drugs, family history of diabetes, history of alcohol consumption, and relevant biochemical and hematological evaluation.
Height and weight were measured according to international recommendations.[13] Body mass index (BMI) was calculated by dividing the weight (Kg) by the square of the height (m2). Children and adolescents with a BMI between the 5th and 85th percentile were defined as normal weight. A BMI at or above the 85th percentile but below the 95th percentile was considered diagnostic for overweight, and a BMI at or above the 95th percentile was considered diagnostic for obesity, taking into account age and sex. Severe obesity class 2) was defined a BMI >35 Kg/m2 and < 40 Kg/m2.[14,15]
Standard methods determined all biochemical parameters. The level of alanine aminotransferase (ALT) was determined by an automated analyser, and iron overload (IOL) was assessed by serum ferritin (SF) in μg/L. IOL was arbitrarily classified as mild (SF:< 800 µg/L), moderate (SF: ≥ 800 µg/L and < 1,500 µg/L), high (SF: ≥ 1,500 µg/L and < 3,000 µg/L), and severe (SF: ≥ 3,000 µg/L). SF was measured by chemiluminescence immunoassay. The 50th centile of reported normal values is 105 µg/L in males and 35 µg/L in females.[16]
c. Oral glucose tolerance test (OGTT). β-TDT patients underwent an OGTT (1.75 g/kg oral glucose, maximum 75 g) after an 8-10 h overnight fast. Venous blood was collected at three intervals (fasting, 1 h, and 2 h after 75 g anhydrous glucose) at baseline. Plasma glucose concentrations were measured by an automated glucose oxidase reaction. OGTT was repeated every two years for at least 6 years.
Glucose tolerance was defined according to the current ADA criteria.[4] Based on plasma glucose concentrations; patients were assigned to one of the following categories of glucose tolerance. Prediabetes was defined by the presence of isolated impaired fasting glucose (i-IFG; fasting PG between 100–125 mg/dL) or isolated impaired glucose tolerance (i-IGT when the 2h-PG during the OGTT was between 140–199 mg/dL) or both. Th-RDM was diagnosed when FPG was ≥ 126 mg/dL or 2 h-PG≥ 200 mg/dL.[15] Moreover, a conventional cutoff of 1h- PG (≥ 155 mg/dL) was used to identify dysglycemia.[17,18]
Statistical analysis
For the statistical analysis, a software program was used and validated, as described by Alder and Roesser.[19] All numeric variables were expressed as mean ± standard deviation (SD), numbers, proportions as percentages (%), and groups were divided into percentiles. The Kolmogorov-Smirnov was used to verify the normality of the distribution of variables. Normally distributed continuous variables were compared using ANOVA, and non-normally distributed variables were analyzed using the Kruskal-Wallis test. Relationships between variables were determined using Pearson linear correlation for normally distributed variables, Spearman's Rho for quantitative variables that were abnormally distributed, and linear regression analysis. Multiple linear regression analyses were performed using a model in which the dependent variable was the 2h-PG at the last follow-up, with the following baseline variables: age, BMI, pre-transfusional hemoglobin level, SF, ALT, and a positive family history for type 1 or 2 diabetes. The "test stats" used in multiple linear regression provides a confidence interval for the difference between group means, while hiding its calculation for the standard error for that difference. The larger the test stats, the less likely it is that the results occurred by chance. The categorical data were analyzed using the chi-square (χ2) test. All statistical tests were two-tailed, and p-values < 0.05 were considered to be statistically significant.Ethics
All patients gave informed consent in accordance with principles of the Declaration of Helsinki and its later amendments in 2020 (www.wma.net), after a detailed explanation of the procedures for performing the OGTT, and the nature and purpose of the study. Moreover, in this retrospective study, patients underwent only routine diagnostic procedures in accordance with current recommendations or guidelines for the management of β-thalassemia.[2,6,7] The study was approved by the local institutional review boards or was waived in accordance with the local legislation and institutional requirements. [20]Results
a. Characteristics of the study population at baseline. A total of 58 β-TDT patients (24 males and 34 females) were included in the retrospective observational study. At the first OGTT, 39/58 patients (67.2%) were < 18 years (mean age:13.4 ± 1.5 range: 10.3-16.9 years) and 19/58 (32.7%) were ≥ 18 years (mean age: 22.2 ± 4.5; range 18.2-37 years). The mean annual pre-transfusion Hb level was 8.9 ± 0.58 (range: 8-10.1 g/dL). The remaining clinical and laboratory data are summarized in Table 1.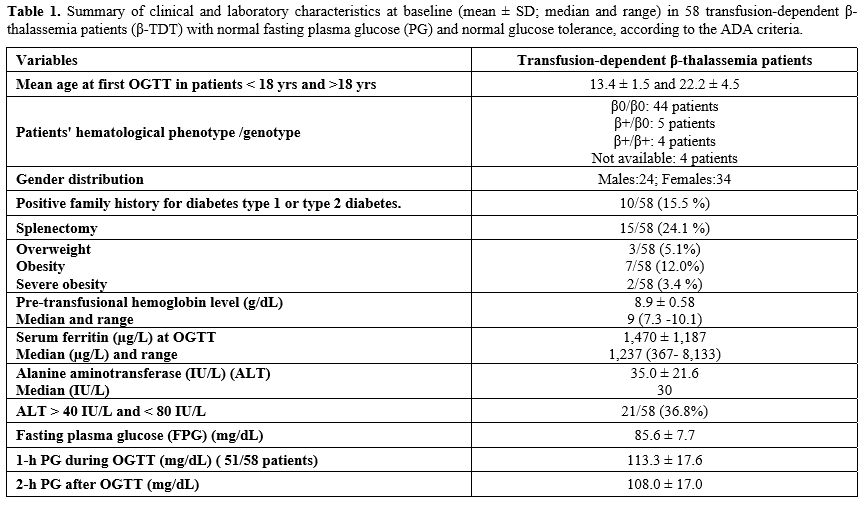 |
|
Iron chelation therapy was based on three commercially available chelators: Deferioxamine (DFO), Deferasirox (DFX), and Deferiprone (DFP). Each iron chelator was used either as monotherapy or in combination. DFX monotherapy was the most commonly used oral iron chelating agent (31/58; 53.4%), followed by DFO (13/58; 22.4%) and DFP (6/58; 10.3%). 8/58 patients (1.7%) were on combined therapy with DFO + DFP or DFO + DFX. The median serum ferritin (SF) level at baseline of the OGTT was 1,237 µg/L (range: 293-8,133). Monotherapy was generally used if the iron burden was in an acceptable or near-acceptable range, and the dose was adjusted according to 6-monthly SF levels and annual blood consumption per kg of body weight. Thus, the recommended doses of the chelating drugs were for Deferioxamine: 30-50 mg/kg/day over 8-10 hours/day, 4 to 6 days/week, Deferiprone:75 mg/kg/day, in 3 divided oral daily doses, and Deferasirox: 20-30 mg/kg/day, in a single oral dose. Combination chelation was employed for patients with a high iron burden, iron-related organ injury, or when the adverse effects of chelators precluded the administration of an appropriate dose of chelator. A systematic quantification of adherence to each regimen was not available.
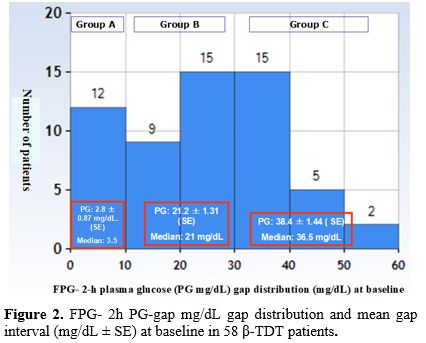
b. Patients' glucose homeostasis categorization at baseline and duration of follow-up: The patients underwent a routine OGTT, and PG-gap levels between 2-h PG and FPG (2-h PG mg/dL - FPG) were calculated. The patients were categorized into three groups based on the results: "Low post-load", when the gap was < 20th percentile (< 10 mg/dL) Group A; "Medium post-load” when the difference was distributed between the 20th and <75th centiles (> 10 mg/dL and < 30 mg/d) Group B; and ”High post load“ ≥75th percentile (≥ 30 mg/d) Group C (Figure 2). The mean total gap (FPG - 2h PG mg/dL) was 19.4 ± 16.2 mg/dL.
In all β-TDT patients, follow-up was available for up to 6 years, and in 45 of 58 patients, it was available for up to 8 years.
 |
|
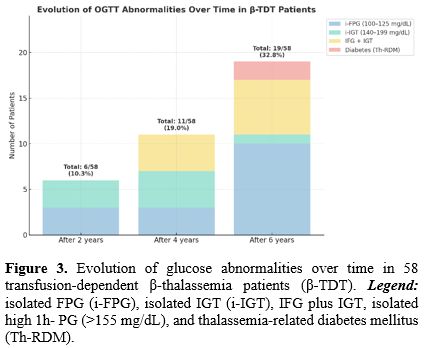
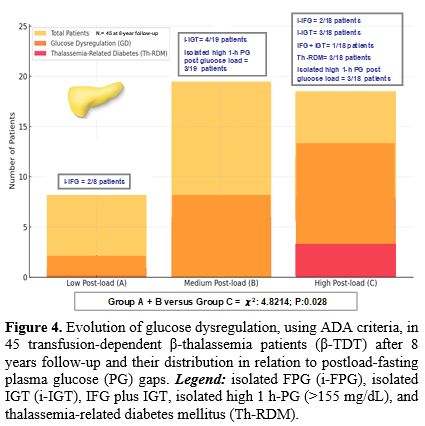
c. Evolution of glucose dysglycemia during 8-year follow-up and prevalence in the three subgroups of patients: The evolution of OGTT abnormalities over 2, 4, and 6 years in all 58 enrolled β-TDT patients is illustrated in Figure 3.
 |
|
After 8 years of follow-up, full data were available only in 45 out of 58 β-TDT patients. The detailed distribution of glucose abnormalities is illustrated in Figure 4. The total incidence of dysglycemia in Group A (8/45 patients; mean gap interval: 4.2 ± 3.1 mg/dL) plus Group B (19/45 patients; mean gap interval: 21.8 ± 5.3 mg/dL) compared to Group C (18/45 patients; mean PG gap interval: 29.1 ± 7.0 mg/dL) was significantly lower (χ2: 4.8214; P=0.028).
 |
|
d. Serum ferritin (SF) at last observation in 45 patients followed for 8 years: At the last evaluation, the SF level was < 800 µg/L in 13/45 (28.8%) patients, between ≥ 800 µg/L and < 1,500 µg/L in 17/45 (37.7%) patients, between ≥ 1,500 µg/L and < 3,000 µg/L in 14/45 (31,1 %) patients, and ≥ 3,000 µg/L.in 1 patient (23%). No significant difference was documented between the last mean SF level compared to SF at baseline (1,358 ± 800,2 µg/L versus 1,470 ±1,187 µg/L: P: 0.58).
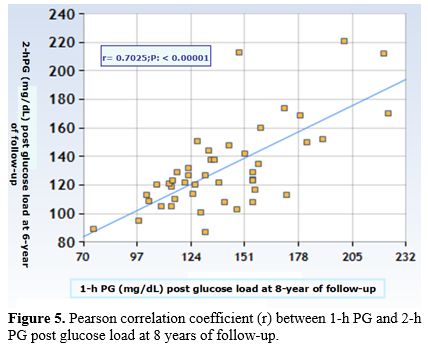
e. Correlations: Pearson or Spearman's Rho correlation coefficients, at baseline and at 8-year follow-up, between 1h- PG levels during OGTT and 2h- PG post-glucose load were statistically significant (r: 0.483; p=0.00033 and r: 0.7025; p< 0.00001, respectively) (Figure 5) as well as between the post-load-fasting PG gap and 2h- PG post-glucose load at baseline (r: 0.5787; p< 0.00001) and at 8-year follow-up (r: 0.31755; p=0.033).
 |
|
At 8-year follow-up, no Pearson's or Spearman's Rho correlation (2-tailed) was documented between age and SF versus 2h-PG post-glucose load (r: 0.03314; p=0.82 and r: 0.14899; p=0.32, respectively. Moreover, no statistical difference was found in the prevalence of dysglycemia between male and female patients (P = 0.17).
f. Multiple linear regression analysis with 2h-PG-gap level at 8 years follow-up. Multiple linear regression was used to determine 6 variables contributing to the 2h-PG-gap at last follow-up. In particular, the regression procedure indicated that only two variables: SF and age were significantly associated with 2h-PG-gap at previous follow-up (t-stat: 2.3941; p= 0.020 and t-stat: 2.0918; p=0.041, respectively). The other variables [BMI, pre-transfusional hemoglobin level, serum alanine aminotransferase (ALT), and positive family history for diabetes type 1 or 2 did not contribute significantly. In this context, the association with glucose dysregulation with age and SF has been confirmed by previous studies, indicating that this impairment in glucose handling begins in the second decade of life and continues throughout adulthood.[1,2,5-7]
Discussion
Abnormal glucose homeostasis is a common finding in transfusion-dependent β-thalassemia (β-TDT) patients, which worsens with age and non-compliance with chelation therapy. It can occur in the absence of noticeable clinical signs and symptoms. Dysglycemia and thalassemia-related diabetes mellitus in β-thalassemia trait (β-TDT) patients are characterized by varying degrees of reduced insulin secretion and sensitivity, primarily due to iron toxicity on β-cells, even if the complete pathogenesis remains incompletely understood.[5-7,17]We have documented for the first time that β-TDT patients with NFG and NGT can be stratified for risk of progression to dysglycemia based on the relationship between the FPG concentration and post-load (OGTT) plasma glucose concentration. Interestingly, 1h-PG level during OGTT, at baseline and at 8 years of follow-up, was positively correlated with 2 h-PG post-glucose load, indicating a reduction of β-cell function and insulin sensitivity.[17] Therefore, early intervention measures, including nutritional interventions, regular physical activity, and optimization of iron chelation, should be recommended as preventive strategies.
Moreover, it has been documented that NGT subjects whose PG values decline more rapidly to FPG levels during OGTT have better β-cell function and greater insulin sensitivity compared to NGT subjects whose PG values decline more slowly.[21,22]
The main strengths of this study include the duration of follow-up. However, certain limitations should be acknowledged. The first key limitation is its retrospective nature. Secondly, insulin secretion and action during OGTT were not formally evaluated. However, the clinical applicability of 2h-PG when coupled with FPG for early detection of GD in β-TDT patients has been confirmed in a preliminary study involving 19 normoglycemic β-TDT patients followed at a single Center.[23] The gap between FPG and 2 h-PG post-glucose load was positively correlated with 2h-PG post-load and negatively with FPG and insulinogenic index (IGI). Moreover, IGI was positively correlated with oral disposition index (oDI30) and negatively with 1h and 2h post-PG load. Substantially, across the categories of normal 2h-PG concentrations, the β-TDT patients in the higher 2h-PG group exhibited greater insulin resistance and reduced insulin secretion and oral disposition index (oDI30) compared with those whose PG concentration fell into the lower category, thereby increasing the future risk of impaired glucose tolerance. Thirdly, the relatively small sample size and the variable patient adherence to OGTT limit the generalization of the findings. Another important limitation is that no specific cutoff value for the FPG–2h PG-gap could be established in this study, preventing its immediate use in clinical practice. Furthermore, the insulin sensitivity varies during puberty; it appears to be highest before the onset of puberty, reaches its nadir midway through maturation, and subsequently recovers by the end of puberty. Notably, three patients of group C ("High post-load gap": ≥ 30 mg/dL) developed Th-RDM. The PG gap, after OGTT, in β-TDT patients in mid-advanced adolescence was statistically different compared to β-TDT prepubertal patients (22.5 ± 6,7 versus 11.9 ± 14.3; P: 0.029) but not versus young adult β-TDT patients (26.0 ± 13.5; P:0.42), supporting a significant decline of insulin secretion and persistence of reduced insulin sensitivity. Finally, the relatively short follow-up duration highlights the need for larger and longer prospective studies to validate the utility of FPG and the 2-hour post-load glucose PG-gap as early and reliable biomarkers of dysglycemia in β-TDT patients.
Conclusion
These preliminary findings suggest that a high post-load glucose incremental rise (PG-gap: ≥ 75th percentile) in transfusion-dependent β-thalassemia patients with normal fasting PG and PG glucose values after an OGTT should be considered a predictor for developing dysglycemia, with the likelihood of progression increasing over time. Additional prospective follow-up studies are needed to determine the level of risk associated with varying post-load fasting gaps, in order to guide clinical monitoring and interventions.Author contributions
VDS contributed to the study design, revision of the literature, interpretation of the data, statistical analysis, and drafting the first version of the manuscript. VDS, MF, EV, and TMV are the guarantors of the data included in the manuscript and take full responsibility for its content. VDS and ATS prepared the original figures. ATS, SD, PT, CK, MF, and EV contributed to the critical revision of the manuscript for important intellectual content, editing, and revision. All of the authors approved the final manuscript prior to submission.Acknowledgements
We thank all the participants in the study. We are also indebted to our colleagues for their help in facilitating this study.References
- Faranoush M, Faranoush P, Heydari I,
Foroughi-Gilvaee M. Complications in patients with
transfusion-dependent thalassemia: a descriptive cross-sectional study.
Health Sci Rep. 2023; 6:e1624. https://doi.org/10.1002/hsr2.1624 PMid:37841947 PMCid:PMC10568004
- Khamseh
EM, Malek M, Hashemi-madani N, Ghassemi F, Rahimian N, Ziaee
A,Foroughi-Gilvaee MR, Faranoush P, Sadighnia N, Elahinia A, Rezvany
MR, Saeedi V, Faranoush M . Guideline for the diagnosis and treatment
of diabetes mellitus in patients with transfusion-dependent
thalassemia. Iran J Blood Cancer. 2023;15(4):293-303. https://doi.org/10.61186/ijbc.15.4.293
- World Health Organization. Classification of diabetes mellitus. Geneva: World Health Organization. 2019. p.1-36. https://iris.who.int/server/api/core/bitstreams/2cb3ab68-a52a-402e-ad47-8bc5a4edc834/content
- American
Diabetes Association. 2. Classification and diagnosis of diabetes:
Standards of medical care in diabetes-2021. Diabetes Care.2021;44
(Suppl 1):S15-S33. https://doi.org/10.2337/dc21-S002 PMid:33298413
- De
Sanctis V, Soliman AT, Elsedfy H, AL Yaarubi S, Skordis N, Khater D, El
Kholy M, Stoeva I, Fiscina B, Angastiniotis M, Daar S, Kattamis C. The
ICET-A recommendations for the diagnosis and management of disturbances
of glucose homeostasis in thalassemia major patients. Mediterr J
Hematol Infect Dis. 2016; 8 (1): e2016058. https://doi.org/10.4084/mjhid.2016.058 PMid:27872738 PMCid:PMC5111521
- Farmakis
D, Porter J, Taher A, Cappellini MD, Angastiniotis M, Eleftheriou A.
2021 Thalassaemia International Federation Guidelines for the
Management of Transfusion-dependent Thalassemia. Hemasphere. 2022;6
(8):e732. https://doi.org/10.1097/HS9.0000000000000732 PMid:35928543 PMCid:PMC9345633
- De
Sanctis V, Daar S, Soliman AT, Tzoulis P, Karimi M, Di Maio S, Kattamis
C. Screening for glucose dysregulation in β-thalassemia major (β-TM):
An update of current evidences and personal experience. Acta Biomed.
2022;93(1):e2022158.
- De
Sanctis V, Canatan D, Daar S, Kattamis C, Banchev A, Modeva I, Savvidou
I, Christou S, Kattamis A, Delaporta P, Kostaridou-Nikolopoulou S,
Karimi M, Saki F, Faranoush M, Campisi S, Fortugno C, Gigliotti F, Wali
Y, Al Yaarubi S, Yassin MA, Soliman AT, Kottahachchi D, Kurtoğlu E,
Gorar S,Turkkahraman D, Unal S, Oymak Y,Tuncel AD, Karakas Z, Gül N,
Yildiz M, Elhakim I, Tzoulis P. A multicenter ICET-A survey on
adherence to annual oral glucose tolerance test (OGTT) screening in
transfusion-dependent thalassemia (TDT) patients -The expert
clinicians' opinion on factors influencing the adherence and on
alternative strategies for adhension optimization. Mediterr J Hematol
Infect Dis,2025:17(1); e2025008; https://doi.org/10.4084/MJHID.2025.008 PMid:39830799 PMCid:PMC11740908
- Faranoush
P, Elahinia A, Ziaee A, Faranoush M. Review of endocrine complications
in transfusion-dependent thalassemia. Iran J Blood Cancer. 2023;
15(4):212-235. https://doi.org/10.61186/ijbc.15.4.212
- Mahmoud
AA, El-Hawy MA, Allam ET, Salem AH, Hola AS. HbA1c or fructosamine on
evaluating glucose intolerance in children with beta- thalassemia.
Pediatr Res. 2024;96 (5)1292-1298. https://doi.org/10.1038/s41390-024-03146-y PMid:38575692 PMCid:PMC11521987
- Dritsa
M, EconomouM, Perifanis V, Teli A, Christoforidis A. Retrospective
evaluation of oral glucose tolerance test in young patients with
transfusion-dependent beta-thalassemia. Acta Haematol. 2025;148
(1):1-7. https://doi.org/10.1159/000523874 PMid:35235930
- Carnevale
Schianca GP, Mella R, Scaglia E, Bigliocca M, Colli E, Fra GP, Bartoli
E. Expanding the clinical use of standard OGTT: The percentage
increment of 2 h with respect to fasting glucose as an index of b-cell
dysfunction. Diabetes Metab Res Rev.2011; 27: 262-268. https://doi.org/10.1002/dmrr.1166 PMid:21309049
- WHO.
Physical status: the use and interpretation of anthropometry. Report of
a WHO Expert Committee. World Health Organ Tech Rep Ser.1995;854:1-452.
ISBN:92-4-120854-6.
- Center
for Disease Control and Prevention. Use and Interpretation of the WHO
and CDC Growth Charts for Children from Birth to 20 Years in the United
States 2014. Available online: https://www.cdc.gov/nccdphp/dnpa/growthcharts/resources/growthchart.pdf (accessed on 1 February 2023).
- American
Diabetes Association Professional Practice Committee. 14. Children and
adolescents: Standards of Care in Diabetes-2024. Diabetes Care.
2024;47(Suppl. 1):S258-S281. https://doi.org/10.2337/dc24-S014 PMid:38078582 PMCid:PMC10725814
- Fulwood
R, Johnson CL, Bryner JD. Hematological and nutritional biochemistry
reference data for persons 6 months-74 years of age: United States,
1976-1980. National Center for Health Statistics, Vital Health Stat
Series.1982;11:p.1-173.
- De
Sanctis V, Soliman A, Tzoulis P, Daar S, Pozzobon GC, Kattamis C. A
study of isolated hyperglycemia (blood glucose ≥155 mg/dL) at 1-hour of
oral glucose tolerance test (OGTT) in patients with β-transfusion
dependent thalassemia (β-TDT) followed for 12 years. Acta Biomed. 2021;
92(4): e2021322.
- Bergman
M, Manco M, Satman I, Chan J, Inês Schmidt M, Sesti G, Vanessa
Fiorentino T, Abdul-Ghani M, Jagannathan R, Kumar Thyparambil
Aravindakshan P, Gabriel R, Mohan V, Buysschaert M, Bennakhi A, Pascal
Kengne A, Dorcely B, Nilsson PM, Tuomi T, Battelino T, Hussain A,
Ceriello A, Tuomilehto J. International Diabetes Federation Position
Statement on the 1-hour post-load plasma glucose for the diagnosis of
intermediate hyperglycaemia and type 2 diabetes. Diabetes Res Clin
Pract. 2024:209:111589. https://doi.org/10.1016/j.diabres.2024.111589 PMid:38458916
- Alder
R, Roesser EB. Introduction to probability and statistics. WH Freeman
and Company Eds. Sixth Edition. San Francisco (USA).1977; p.1-426.
- The
Italian Data Protection Authority. Authorisation no. 9/2014-General
Authorisation to Process Personal Data for Scientific Research
Purposes. Available online: https://www.garanteprivacy.it/web/guest/home/docweb/-/docweb-display/docweb/3786078 (accessed on 1 July 2023).
- Abdul-Ghani
MA, Williams K, DeFronzo R, Stern M. Risk of progression to type 2
diabetes based on relationship between postload plasma glucose and
fasting plasma glucose. Diabetes Care. 2006; 29: 1613-1618. https://doi.org/10.2337/dc05-1711 PMid:16801587
- Bartoli E, Fra GP,Carnevale Scianca GP. The oral glucose tolerance test (OGTT) revisited. Eur J Intern Med. 2011;22(1):8-12. https://doi.org/10.1016/j.ejim.2010.07.008 PMid:21238885
- De
Sanctis V, Soliman AT, Daar S, Tzoulis P, Kattamis C. Could plasma
glucose (PG) increment (PG%) expand the clinical weight of OGTT?
Preliminary findings in 19 TDT patients (β-TDT) with normal glucose
tolerance. Mediterr J Hematol Infect Dis. 2025:17(1): e2025050. https://doi.org/10.4084/MJHID.2025.050 PMid:40636275 PMCid:PMC12240246
- Cook
JS, Hoffman RP, Stene MA, Hansen JR. Effects of maturational stage on
insulin sensitivity during puberty. J Clin Endocrinol Metabol.
1993;77:725-730. https://doi.org/10.1210/jcem.77.3.7690363 PMid:7690363