Oral glucose tolerance test (OGTT), fasting plasma glucose (FPG) and glycosylated hemoglobin (HbA1c) have been recommended by the WHO[5] and American Diabetes Association (ADA)[6] as methods to diagnose diabetes, with FPG and HbA1c being widely used due to their convenience, whereas OGTT is less often utilised due to several practical drawbacks, including the need for dedicated staff, the lengthy duration of the test itself, and patients' discomfort and/or refusal.[7] In patients with β-TDT, FPG is more accurate than HbA1c for the diagnosis of Th-RDM and, therefore, should be adopted as the diagnostic test of choice.[8,9]
Notably, several studies in children and adults have reported that higher FPG levels, while still within the normal range, are strong and consistent predictors of diabetes risk.[10-14] Moreover, Noetzli et al.[15] found, in 59 β-TDT patients, aged 23.3 ± 9.8 years (range 10 to 49 years), that FPG ≥ 97 mg/dL and serum insulin ≥ 9 µU/mL (a fasting insulin cutoff of 17 µU/mL was considered normal) accurately identified an abnormal OGTT with a sensitivity of 89% and a specificity of 90%. Therefore, they recommended that β-TDT patients with glucose or insulin values outside these ranges should be referred for a confirmatory OGTT.
The primary outcome of this 10-year retrospective study, promoted by the International Network of Clinicians for Endocrinopathies in Thalassemia and Adolescent Medicine (ICET-A Network), was to evaluate the association of different baseline FPG levels within the normoglycemic range with the rate of progression to GD and Th-RDM. The secondary objective was to identify which baseline risk variable was associated with a higher risk of developing future alterations in glucose homeostasis.
Materials and Methods
Research design.A. Study setting and study period design. Two Institutes of Endocrinology (Iran -Tehran: 44 patients and Shiraz: 148 patients) and the
Outpatient Pediatric and Adolescent Endocrine Clinic (Italy-Ferrara: 47 patients) performed a retrospective observational study, between January 2013 and January 2025, to evaluate the performance of different high-normal FPG levels to predict the development of GD and Th-RDM among β-TDT patients from age 10 years to adulthood.
B. Eligibility criteria. Eligible criteria for patients' inclusion were: (a) β-TDT patients receiving routine blood transfusions and iron chelation therapy; (b) patients' age ≥ 10 years; (c) patients with FPG level < 100 mg/dL at baseline, and (d) FPG trajectories available for 10 consecutive years. Patient-year follow-up was calculated as the period between the first entry and the last confirmed follow-up. The main exclusion criteria included: (a) fluctuations of FPG concentrations; (b) non-transfusion-dependent thalassemia (NTDT) patients; (c) bone marrow transplanted patients; (d) history of recent viral hepatitis; (e) pregnancy at any time during the 10-year follow-up; (f) intake of medications affecting glucose metabolism (such as: thiazide diuretics, beta-blockers and corticosteroids) and (g) patients taking insulin or oral antidiabetic agents.
C. Patients' sample size at baseline. A total of 238 patients were recruited in the study, including 96 males and 142 females, with a male-to-female ratio of 1:1.4. β-TDT was diagnosed using complete blood count and hemoglobin HPLC, and molecular characterization of genotype in 81/238 (34%) patients.
Methods and data collection. Height and weight were measured according to international recommendations. Body mass index (BMI) was calculated by dividing the weight (Kg) by the square of the height (m2), according to the WHO criteria.[16] Children and adolescents, with BMI from the 5th to the 85th percentile, were defined as normal weight.
A BMI at or above the 85th percentile but below the 95th percentile was considered diagnostic for overweight, and a BMI at or above the 95th percentile was considered for age and sex diagnostic for obesity. Severe obesity class 2 was defined as a BMI >35 Kg/m2 and < 40 Kg/m2. In patients above the age of 18 years, BMI was classified as: underweight (< 18.5 kg/m2), normal weight (18.5–24.9 kg/m2), overweight (25.0–29.9 kg/m2), and obesity (≥ 30 kg/m2).[16]
A. Biochemical analysis. Fasting plasma glucose (FPG) samples were collected in the morning in citrate-containing tubes after an overnight fast of at least 8 hours. FPG concentrations were measured using the glucose oxidase method using a Beckman Glucose Analyzer (Beckman Instruments, Fullerton, CA). Results for other markers of glycemia, such as OGTT or HbA1c, were not available.
All biochemical parameters were determined by standard methods. The level of alanine aminotransferase (ALT) was determined by an automated analyzer, and iron overload (IOL) was assessed by serum ferritin (SF). IOL was arbitrarily classified as mild (SF: between 500 and 800 µg/L), moderate (SF: ≥ 800 µg/L and < 1,500 µg/L), high (SF: ≥ 1,500 µg/L and < 3,000 µg/L) and severe (SF: ≥ 3,000 µg/L). SF was measured by chemiluminescence immunoassay. The 50th centile of reported normal values is 105 µg/L in males and 35 µg/L in females.[17]
Statistical analysis. Standard computer program SPSS for Windows, release 18.0 (SPSS Inc., USA) was used for data entry and analysis. Data are summarized in tables using mean ± standard deviation (SD), median, count, percent (%), and 95% confidence interval (CI) for categorical variables. The Kolmogorov-Smirnov was used to verify the normality of distribution of variables. Longitudinal trends in fasting plasma glucose (FPG) over the 10-year follow-up were assessed using repeated-measures ANOVA for continuous variables, and non-normally distributed data were evaluated using the Kruskal-Wallis test, a non-parametric method for comparing independent samples. Relationships between variables were determined by Pearson linear correlation for normally distributed variables,
Spearman Rho for quantitative variables abnormally distributed. According to Swinscow, the correlation coefficient was considered as follows: <0.4 as weak, from ≥ 0.4 to 0.59 moderate, from ≥ 0.6 to 0.79 strong, and ≥ 0.8 very strong.[18] The categorical data were analyzed using the chi-square (χ2) test. Furthermore, time-dependent receiver operating characteristic (ROC) curve analyses and respective areas under the curve, by plotting sensitivity (true positive rate) on the y-axis against 1 – specificity (false positive rate) on the x-axis for the various FPG values were tabulated to evaluate the performance of FPG measurements (<100 mg/dL) for the incident risk of impaired fasting plasma glucose (IFG) and Th-RDM at 10-year follow-up. An AUC value of 0.5 denotes a differentiation ability while an AUC of 1.0 represents a value with significant superior discriminatory power.[19] Multiple linear regression analyses were employed to evaluate the relationship between the dependent variable FPG at the diagnosis of Th-RDM or at last follow-up in normoglycemic patients and the potential associated risk factors: age, gender, BMI, pre-transfusional hemoglobin level, oral iron chelating agents, SF, history of splenectomy, and positive family history for T1 DM and T2 DM reported at baseline. In the analyses, male and female patients were combined to increase statistical power and to simplify the presentation. For all tests, a probability (P value - 2-tailed) less than 0.05 was considered significant.
Ethics. All participants or parents gave informed consent in accordance with the principles of the Declaration of Helsinki and its later amendments in 2020 (www.wma.net) after a detailed explanation of the procedures for performing the OGTT, as well as the nature and purpose of the test. Moreover, in our retrospective observational study, patients underwent only routine diagnostic procedures according to the current recommendations or guidelines.[20-22] No additional interventions were provided. The personal data of patients were not disclosed during the study. The study was approved by the local institutional review boards or was waived in accordance with the local legislation and institutional requirements.[23]
Results
Patient characteristics at start of the 10-year follow-up study. A total of 238 β-TDT patients were included in the retrospective observational study. The cohort comprised 96 males and 142 females, with a mean age of 23.0 ± 8.1 years (range: 10.1–41.9 years). Of these, 71 patients (29.8%) were under 18 years of age. Genotypic data were available for 77 patients, with the majority (70/77; 90.9%) being homozygous for β⁰-thalassemia and 7 patients (9.1%) having a compound heterozygous β⁰/β⁺genotype.The mean annual pre-transfusion Hb level was 8.2 ± 0.7 (range: 6.5-10 g/dL; median: 8.25 g/dL).
Among the 71 children and adolescents, 12 (16.9%) were classified as overweight or obese, while 5 (7.0%) were underweight. In patients over 18 years of age (n = 167), 4 (2.3%) were overweight and 11 (6.5%) were underweight.
A positive family history for diabetes type 1 or 2 diabetes was reported in 95/238 (39.9%) patients, and a history of splenectomy was present in 75/238 (31.5%) β-TDT patients.
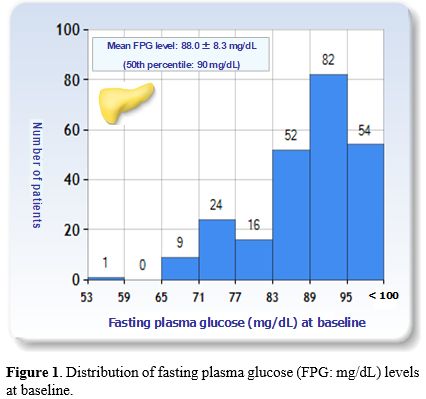
At baseline, the total mean FPG level was 88.0 ± 8.3 mg/dL (50th and 75th percentiles: 90 mg/dL and 94 mg/dL, respectively) (Figure 1) and the mean serum ferritin (SF) level was 2,080 ± 2, 072µg/L (median: 1,368 µg/L). In 108/238 (45.3%) patients, the SF levels were classified as high or severe. The mean alanine aminotransferase level, available in 201/238 patients (84.4%), was 29.0 ± 25.8 IU/L (median: 43 IU/L).
 |
|
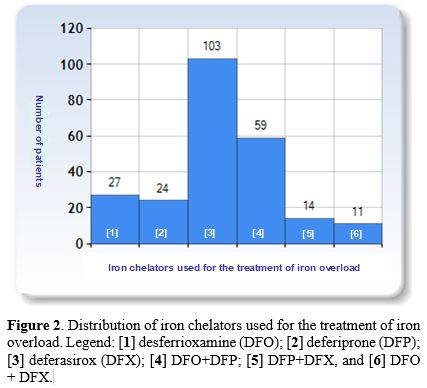
For the treatment of iron overload different iron chelators were used: [1] desferrioxamine (DFO); [2] deferiprone (DFP); [3] deferasirox (DFX); [4] DFO+DFP; [5] DFP+ DFX, and [6] DFO +DFX.
Deferasirox (DFX) monotherapy was the most commonly used oral iron chelating agent (103/238; 43.2%), followed by desferrioxamine (DFO: 27/238; 11.3%) and deferiprone (DFP: 24/238; 10.0%). 84/238 patients (35.2%) were on different combined chelating therapies (Figure 2).
 |
|
Evolution of fasting glucose status during 10-year follow-up. The principal demographic and clinical characteristics of patients enrolled in the retrospective study are summarized in Table 1. Based on the trajectory of their FPG over the 10-year study period, adult β-TDT patients (age range: 20.3-51 years) were classified as having persistent normoglycemia (Group A), prediabetes (IFG; Group B), or diabetes (Group C,) according to the ADA criteria.[6] Normoglycemia (n = 93) was defined as FPG level < 100 mg/dL; prediabetes (IFG; n = 67) as FPG levels of 100–125 mg/dL and diabetes (n = 78) as FPG levels equal or above 126 mg/dL.
Trajectory stability was based on a minimum of five consecutive FPG measurements in a 2-year interval within the 10 years of follow-up. FPG trajectories were also used to calculate the interval between the patients' entry (baseline) and the diagnosis of IFG or Th-RDM. Their clinical and laboratory characteristics are summarized in Table 1 and their FPG trajectories, during 10-year follow-up, are illustrated in Figure 3.
Substantially, FPG concentrations remained stable < 100 mg/dL in 93/238 β-TDT patients (39.0%), 67/238 (28.1%) patients developed persistent IFG, and 78/238 (32.8%) patients developed Th-RDM.
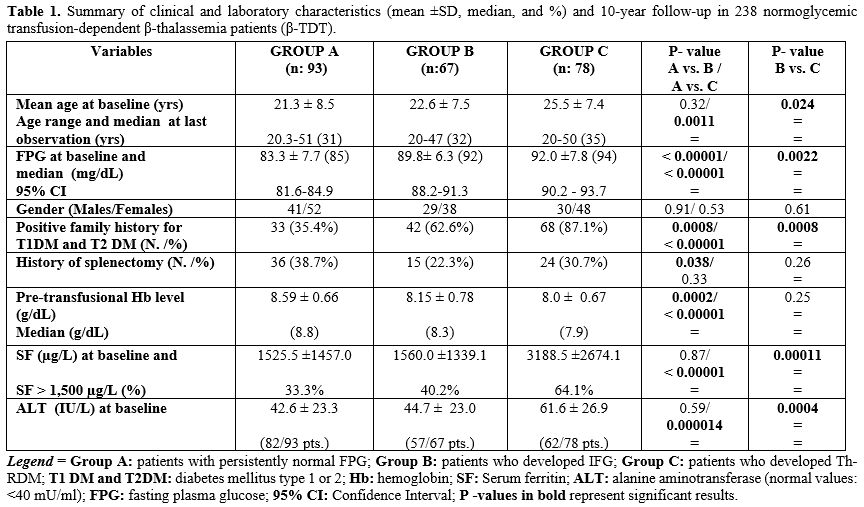 |
Table 1. Summary of clinical and laboratory characteristics (mean ±SD, median, and %) and 10-year follow-up in 238 normoglycemic transfusion-dependent β-thalassemia patients (β-TDT). |
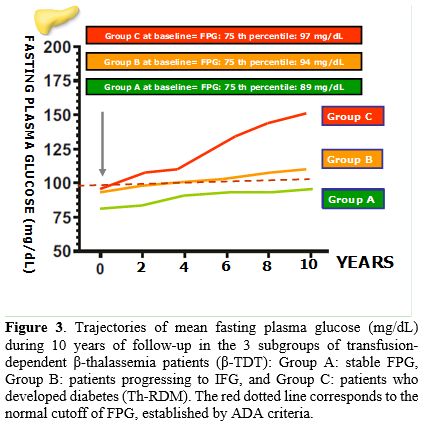 |
Figure 3. Trajectories of mean fasting plasma glucose (mg/dL) during 10 years of follow-up in the 3 subgroups of transfusion-dependent β-thalassemia patients (β-TDT): Group A: stable FPG, Group B: patients progressing to IFG, and Group C: patients who developed diabetes (Th-RDM). The red dotted line corresponds to the normal cutoff of FPG, established by ADA criteria. |
The first detection of IFG and Th-RDM was registered at 5.7 ± 2.3 years and 6.6 ± 2.6, respectively, after the baseline. The mean time interval for conversion from IFG to Th-RDM was 3.3 ± 2.3 years (95% 2.790 - 3.810). Their mean FPG level was 159.5 ± 29.0 mg/dL (10th centile: 129.2 mg/dL and 90th centile: 189.8 mg/dL). At baseline, the SF levels in 50 out of 78 (64.1%) patients with Th-RDM were classified as high or severe. The commonest recommended ICT was DFO + DFP: 27/78 (34.6%) patients, DFX: 26/78 (33.3%) patients, and DFO: 9/78 (11.5%) patients.
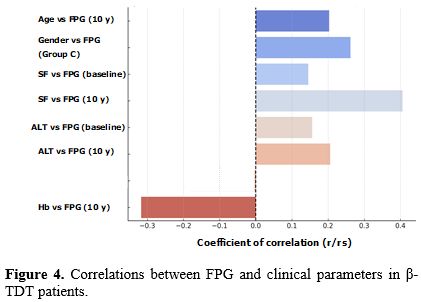
Correlations and ROC analysis. Correlation analysis between all variables and FPG at baseline and after 10-year follow-up was performed in the whole group of β-TDT patients.
At baseline, in the total group of 238 patients, no correlation was observed of FPG with age, gender, history of splenectomy and family history of diabetes T1DM and T2 DM [rs: 0.05303, P = 0.41; rs: 0.12, P (2-tailed) = 0.064; rs: 0.04152, P= 0.52, and rs : -0.07402, P = 0.25, respectively]. Nevertheless, a significant, but weak, correlation was documented between age and FPG after 10-year follow-up (rs: 0.20332, P = 0.0016).
A significant, but weak, correlation was found between SF and FPG at baseline and a moderate correlation at 10-year follow-up (r: 0.1448, P = 0.025 and r: 0.4057, P =< 0.00001, respectively), while a significant, but weak, correlation was also recorded between ALT vs FPG (at baseline = r: 0.1559, P = 0.027 and at 10-year follow-up = r: 0.2057, P = 0.0035). On the other hand, an inverse moderate correlation was documented between Hb vs FPG at 10-year follow-up (r: - 0.317, P =< 0.00001) and a weak correlation was documented between age and FPG after 10-year follow-up (rs: 0.20332, P = 0.0016).
In β-TDT of Group A, a significant, but weak, inverse correlation was present between Hb vs SF (rs: - 0.28907, P = 0.0049) and Hb vs FPG (rs: - 0.27995, P = 0.0065). No significant correlations were observed in β-TDT of Group B and a positive direct weak correlation was present between basal SF vs FPG at the diagnosis of diabetes in patients of Group C (rs: 0.23308, P = 0.040) (Figure 4). Moreover, a significant, but weak, correlation was also observed in Group C between FPG and gender (female = rs: 0.26249, P = 0.020).
 |
|
Of note, an inverse weak correlation was found between baseline FPG and time to prediabetes development (rs: - 0.340, P = 0.0048), while no correlation was found at onset of Th-RDM (rs: - 0.055, P = 0.63).
Almost all (76/78) patients who developed Th-RDM (97.4%) were diagnosed in Shiraz. A linear correlation was documented with severity of iron overload, family history for T1 DM and T2 DM, older age, lower pre-transfusion of splenectomy transfusion hemoglobin levels, past history of splenectomy, and elevated liver enzyme levels (Group C versus A, Table 1). However, at the diagnosis of Th-RDM, the multivariate linear regression model confirmed only an association of FPG with SF level (t-stat: 2.9873; P: 0.0041) and not with the other investigated variables. Of note, at the last observation, in β-TDT Iranian patients with persistent normal FPG, none of the investigated variables were significantly associated with FPG. These results reinforce the main role of chronic iron burden in the etiopathogenesis of Th-RDM in β-TDT Iranian patients.
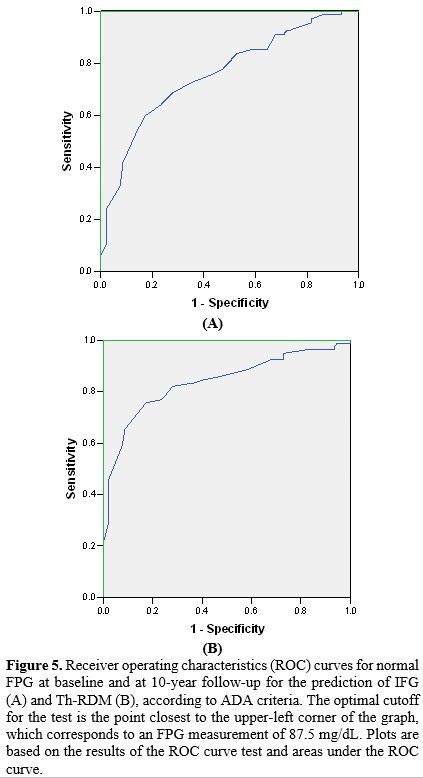
The receiver operating characteristics (ROC) curves for normal fasting plasma glucose (FPG) at baseline and after 10-year follow-up for the risk of IFG and Th-RD are reported in Figure 5 (A and B). The area under the A curve for the incidence of IFG was 0.758, and for Th-RDM was 0.837.
 |
|
In brief, FBG at baseline was very effective in differentiating patients who developed IFG from those who remained normoglycemic/dL with a sensitivity of 73.1% and a specificity of 63.4% at the cutoff value of 87.5 mg/dL. Moreover, FBG at baseline was very effective in differentiating patients who progressed to Th-RDM from those who did not, with a cutoff value of 87.5 mg/dL, a sensitivity of 83.8%, and a specificity of 63.4%. These results prove that FPG in the normal range is useful in identifying β-TDT patients at risk for IFG and Th-RDM.
Strengths and Limitations. A key strength of the present study is: (a) the large sample size of subjects with β-TDT followed for 10 years, which enhances the statistical power and allows for more reliable subgroup analyses; (b) the clinical relevance for early identification of at-risk β-TDT patients, and (c) the identification of an FPG threshold lower than ADA cutoffs, with potential implications for monitoring. Nevertheless, the study has several important limitations that should be considered when interpreting the findings.
First, the diagnosis of Th-RDM was made based on the results of FPG and did not include oral glucose tolerance test (OGTT). According to ADA criteria 6, diabetes may be diagnosed based on hemoglobin A1c (A1C ≥ 6.5%) or plasma glucose criteria, either the fasting plasma glucose (FPG: ≥ 126 mg/dL) value or 2-h glucose (2-h PG: ≥ 200 mg/dL) value during a 75-g oral glucose tolerance test (OGTT), or random glucose value ≥ 200 mg/dL accompanied by classic hyperglycemic symptoms (e.g., polyuria, polydipsia, and unexplained weight loss) or hyperglycemic crises. Although the FPG is a more reproducible test, increasing data suggest that the diagnostic value of ≥ 126 mg/dL has low sensitivity.[24,25] The validity of using this FPG cutoff value in diagnosing diabetes in β-TDT patients remains to be established. Nevertheless, a preliminary ongoing study, promoted by ICET-A Network, in 72 β-TDT patients, followed in Teheran, Muscat, and Ferrara (mean age 25.6 ± 10.4 years; 38 females), on the concordance rate among FPG (between 126 mg/dL and 200 mg/dL) and 2-hour post-challenge glucose test (2-hr PG: ≥ 200 mg/dL) for the diagnosis of Th-RDM has documented a percentage rate of 77.7% that increase with the elevation of FPG levels (De Sanctis V. et al., preliminary observations). Second, although FPG is more practical and less expensive compared with OGTT, the latter is useful for the screening of impaired glucose tolerance (IGT). However, given the large sample size, the consequences of this limitation could be expected to be negligible. In a previous study including 234 β-TDT patients (aged 5-40 years) with FPG < 100 mg/dL, the prevalence of isolated impaired glucose tolerance and Th-RDM, after OGTT, was 4.2% and 1.2%, respectively.[26] Third, pre-analytical factors such as glycolysis can further compromise FPG measurements, as glucose levels in whole blood samples can decline by 5%-7% per hour if not processed promptly.[26] Finally, further studies are needed to understand the mechanisms that regulate higher normal FPG concentrations.
Discussion
Normal fasting plasma glucose (FPG) level reflects the body’s ability to maintain adequate basal insulin secretion in combination with hepatic insulin sensitivity sufficient to control hepatic glucose output.[27] Because of the convenience and low cost, FPG rather than OGTT is frequently utilised in various healthcare settings as an easy screening test for evaluation of glycemic status.In the past, several studies in the general population have reported that higher FPG levels within the normoglycemic range are a predictor for developing future prediabetes and diabetes.[10-14] Our retrospective study confirmed this finding in a population of β-TDT patients, reporting that the higher, but still within normal range, the FPG is, the greater the likelihood of developing IFG or Th-RDM in the future.[28]
To determine the associated risk for future glucose dysregulation and diabetes, we calculated the ROC curves for normal fasting plasma glucose (FPG) at baseline and at 10-year follow-up (Figure 5). The FPG cutoff value for optimal specificity and sensitivity for developing IFG and Th-RDM was established at 87.5 mg/dL, which is significantly lower than the cutoff suggested by Noetzly et al.[15] and Pepe et al.,[29] who had reported in a large number of β-TDT patients that an FPG value of 98 mg/dL predicted the presence of an abnormal OGTT with a sensitivity of 60.4% and a specificity of 95.9%.
Our study confirms that a relationship exists between FPG levels in the high normal range and the development of GD and Th-RDM, and draws the clinicians' attention to the significant risk of progression in β-TDT patients with FPG exceeding 87.5 mg/dl. However, ethnic and genetic variations in metabolism would suggest that a single cutoff value may not be applicable to all β-TDT patients.
The mechanisms by which higher normal FPG reflects a negative effect on glucose homeostasis are not entirely clear and require further investigation. Putative factors could be an increased hepatic insulin resistance, impaired insulin secretion and action, and decreased insulin clearance.[30]
In children with FBG between 90 and 100, a significant decline (~ 23%) of β-cell function has been reported compared to those with FPG below 90 mg/ dL.[31]
Subgroup linear correlation analysis revealed important nuances. In Group A (patients with normal FPG), inverse correlations between hemoglobin and both serum ferritin and FPG suggest a protective metabolic profile with lower iron load and better glycemic control. Conversely, in Group C (patients with Th-RDM), a significant positive correlation between baseline SF and FPG at diabetes diagnosis reinforces the role of chronic iron burden in diabetes pathogenesis. In contrast, Group B (patients with persistent IFG) showed no significant correlations, possibly reflecting a heterogeneous transitional state or the influence of other unmeasured factors, such as genetic factors, a history of splenectomy, and lower pre-transfusional Hb levels that could exacerbate iron overload and metabolic complications.
Pancreatic β-cells are particularly susceptible to excess iron because they are rich in mitochondria and are highly sensitive to oxidant-generating substances. The iron-mediated damage is further exacerbated by the impaired ability of the pancreas to handle oxidative stress, which results in tissue fibrosis and inflammation, contributing to both endocrine and exocrine dysfunction.[32,33]
Additional factors include chronic hypoxia due to anemia, which may potentiate the toxicity of iron deposition in endocrine glands and other organs, as well as viral infections. Moreover, recent studies, including one by Rujito et al.,[34] have identified mutations in diabetes related genes (HNF4A, PTPN, KCNJ11, and PPAR gamma) in thalassemia patients, suggesting a susceptibility to diabetes and exacerbation of iron deposition in the pancreas, impacting glucose homeostasis.
The association between ALT and FPG supports this mechanistic link, as elevated ALT reflects hepatocellular injury and may reflect hepatic insulin resistance. Interestingly, hemoglobin levels showed a persistent inverse correlation with FPG, both at baseline and follow-up. Lower hemoglobin levels may reflect ineffective erythropoiesis or increased transfusion burden, which, in turn, could exacerbate iron overload and metabolic complications. This observation warrants further investigation, as optimizing transfusion regimens may have metabolic benefits beyond hematologic correction.
Conclusion
Higher FPG levels within the normoglycemic range are associated with an increased risk of future glucose dysregulation. This study identified a basal FPG level of 87.5 mg/dL as a significant cutoff for the risk of progression to IFG or Th-RDM in β-TDT patients with severe iron overload. Therefore, these patients should be under close monitoring, necessitating 3-4 monthly measurements of FPG concentration, while intensification of chelation therapy and lifestyle interventions should also be considered. Future research should evaluate the accuracy of high normal FPG across different settings and ethnicities and understand the clinical implications of FPG at lower thresholds to optimize resource use efficiently.Author contributions
VDS coordinated the study, analyzed the data, and wrote the manuscript as the first author. VDS, FS, MK, and MF are the guarantors of the data integrity and take full responsibility for its content. VDS and IE performed the statistical analysis and data interpretation. VDS and ATS prepared the original figures. MF and PT participated in writing the manuscript and contributed to the discussion of intellectual content and the preparation of the revised version. ATS and SD contributed to the editing and discussion. All authors contributed to the final preparation of manuscript and approved the final version before submission.Acknowledgements
We thank all the participants in the study. We are also indebted to our colleagues for their help in facilitating this study.References
- Farmaki K, Angelopoulos
N, Anagnostopoulos G,
Gotsis E, Rombopoulos G, Tolis G. Effect of enhanced iron chelation
therapy on glucose metabolism in patients with beta-thalassaemia major.
Br J Haematol. 2006; 134:438-444. https://doi.org/10.1111/j.1365-2141.2006.06203.x
PMid:16822284
- Faranoush
P, Elahinia A, Ziaee A, Faranoush M. Review of endocrine complications
in transfusion-dependent thalassemia. Iranian J Blood Cancer.
2023;15(4):212-235. http://ijbc.ir/article-1-1401-en.html
https://doi.org/10.61186/ijbc.15.4.212
- De
Sanctis V, Soliman A, Tzoulis P, Daar S, Kattamis A, Delaporta P,
Yassin MA, Karimi M, Canatan D, Al Jaouni S, Galati MC, Raiola G,
Messina G, Campisi S, Saki F, Kottahachchi D, Kaleva V, Petrova K,
Banchev A, Kattamis C. The Prevalence of glucose dysregulations (GDs)
in patients with β-thalassemias in different countries: A preliminary
ICET-A survey. Acta Biomed. 2021;92(3):e2021240. https://doi.org/10.23750/abm.v92i3.11733.
- He
LN, Chen W, Yang Y, Xie YJ, Xiong ZY, Chen DY, Lu D, Liu NQ, YangYH,
Sun XF. Elevated prevalence of abnormal glucose metabolism and other
endocrine disorders in patients with β-thalassemia major: A
meta-analysis. Biomed Res Int. 2019; 2019:6573497. https://doi.org/10.1155/2019/6573497
PMid:31119181 PMCid:PMC6500678
- Classification
of diabetes mellitus. Geneva: World Health Organization; 2019. https://iris.who.int/handle/10665/325182
- American
Diabetes Association Professional Practice Committee; 2. Diagnosis and
Classification of Diabetes: Standards of Care in Diabetes-2025.
Diabetes Care. 2025; 48 (Supplement 1): S27-S49. https://doi.org/10.2337/dc25-S002
PMid:39651986
- De
Sanctis V, Canatan D, Daar S, Kattamis C, Banchev A, Modeva I, Savvidou
I, Christou S, Kattamis A, Delaporta P, Kostaridou-Nikolopoulou S,
Karimi M, Saki F, Faranoush M, Campisi S, Fortugno C, Gigliotti F, Wali
Y, Al Yaarubi S, Yassin MA, Soliman AT, Kottahachchi D, Kurtoğlu E,
Gorar S,Turkkahraman D, Unal S, Oymak Y,Tuncel AD, Karakas Z, Gül N,
Yildiz M, Elhakim I, Tzoulis P. A multicenter ICET-A survey on
adherence to annual oral glucose tolerance test (OGTT) screening in
transfusion-dependent thalassemia (TDT) patients -The expert
clinicians' opinion on factors influencing the adherence and on
alternative strategies for adhension optimization. Mediterr J Hematol
Infect Dis.2025:17(1); e2025008. https://doi.org/10.4084/MJHID.2025.008
PMid:39830799 PMCid:PMC11740908
- Thakkinstian
A, Anothaisintawee T. Chaiyakunapruk N. Comparison of diagnostic
accuracy for diabetes diagnosis: A systematic review and network
meta-analysis. Front Med.2023;10:1016381. https://doi.org/10.3389/fmed.2023.1016381
PMid:36760402 PMCid:PMC9902703
- Nomura
K, Inoue K, Akimoto K (2012) A Two-Step Screening, Measurement of HbA1c
in Association with FPG, May Be Useful in Predicting diabetes.
PLoSONE.2012; 7(4):e36309. https://doi.org/10.1371/journal.pone.0036309
PMid:22558430 PMCid:PMC3338650
- Tirosh
A, Shai I, Tekes-Manova D, Israeli E, Pereg D, Shochat T, Kochba I,
Rudich A; Israeli Diabetes Research Group. Normal fasting plasma
glucose levels and type 2 diabetes in young men. N Engl J
Med.2005;353(14):1454-1462. Erratum in: N Engl J Med. 2006;354(22):2401
https://doi.org/10.1056/NEJMoa050080
PMid:16207847
- Ko
GT, Chan JC, Woo J, Lau E, Yeung VT, Chow CC, Cockram CS. The
reproducibility and usefulness of the oral glucose tolerance test in
screening for diabetes and other cardiovascular risk factors. Ann Clin
Biochem. 1998 Jan;35 (Pt 1):62-67. https://doi.org/10.1177/000456329803500107
PMid:9463740
- Nguyen
QM, Srinivasan SR, Xu JH, Chen W, Berenson GS. Fasting plasma glucose
levels within the normoglycemic range in childhood as a predictor of
prediabetes and type 2 diabetes in adulthood: the Bogalusa Heart Study.
Arch Pediatr Adolesc Med. 2010;164 (2):124-128. https://doi.org/10.1001/archpediatrics.2009.268
PMid:20124140
- Munekawa
C, Okada H, Hamaguchi M, Habu M, Kurogi K, Murata H, Ito M, Fukui M.
Fasting plasma glucose level in the range of 90-99 mg/dL and the risk
of the onset of type 2 diabetes: Population-based Panasonic cohort
study 2. J Diabetes Investig. 2022;13(3):453-459. https://doi.org/10.1111/jdi.13692
PMid:34624178 PMCid:PMC8902401
- Han
Y, Zhang S, Chen S, Zhang J, Guo X, Yang X. Incidence and risk factors
of type 2 diabetes mellitus in individuals with different fasting
plasma glucose levels. Ther Adv Endocrinol Metab. 2020;11:1-9. https://doi.org/10.1177/2042018820928844
PMid:32577198 PMCid:PMC7288838
- Noetzli
LJ, Mittelmanm SD, Watanabe RM, Coates TD, Wood JC. Pancreatic iron and
glucose dysregulation in thalassemia major. Am J Hematol. 2012; 87
(2):155-160. https://doi.org/10.1002/ajh.22223
PMid:22120775
- Center
for Disease Control and Prevention. Use and interpretation of the WHO
and CDC growth charts for children from birth to 20 years in the United
States 2014. Available online: https://www.cdc.gov/nccdphp/dnpa/growthcharts/resources/growthchart.pdf
(accessed on 1 February 2023).
- Fulwood
R, Johnson CL, Bryner JD. Hematological and nutritional biochemistry
reference data for persons 6 months-74 years of age: United States,
1976-1980. National Center for Health Statistics, Vital Health Stat
Series.1982;11: p.1-173.
- Swinscow
TDV. Statistics at square one. XVI-The chi squared 2 tests. BMJ.1976;
2:573-574. https://doi.org/10.1136/bmj.2.6035.573
PMid:963437 PMCid:PMC1688097
- Sharma
B, Jain R. Right choice of a method for determination of cutoff values:
A statistical tool for a diagnostic test. Asian J Med Sci. 2014; 5
(3):30-34. https://doi.org/10.3126/ajms.v5i3.9296
- Farmakis
D, Porter J, Taher A, Cappellini MD, Angastiniotis M, Eleftheriou A.
2021 Thalassaemia International Federation guidelines for the
management of transfusion-dependent thalassemia. Hemasphere. 2022;6
(8):e732. https://doi.org/10.1097/HS9.0000000000000732
PMid:35928543 PMCid:PMC9345633
- De
Sanctis V, Soliman AT, Elsedfy H, AL Yaarubi S, Skordis N, Khater D, El
Kholy M, Stoeva I, Fiscina B, Angastiniotis M, Daar S, Kattamis C. The
ICET-A recommendations for the diagnosis and management of disturbances
of glucose homeostasis in thalassemia major patients. Mediterr J
Hematol Infect Dis. 2016; 8 (1):e2016058. https://doi.org/10.4084/mjhid.2016.058
PMid:27872738 PMCid:PMC5111521
- Khamseh
EM, Malek M, Hashemi-madani N, Ghassemi F, Rahimian N, Ziaee
A,Foroughi-Gilvaee MR, Faranoush P, Sadighnia N, Elahinia A, Rezvany
MR, Saeedi V, Faranoush M . Guideline for the diagnosis and treatment
of diabetes mellitus in patients with transfusion-dependent
thalassemia. Iran J Blood Cancer. 2023;15(4):293-303. https://doi.org/10.61186/ijbc.15.4.293
- The
Italian Data Protection Authority. Authorisation no. 9/2014-General
authorisation to process personal data for scientific research
purposes. Available online: https://www.garanteprivacy.it/web/guest/home/docweb/-/docweb-display/docweb/3786078
(accessed on 1 July 2023).
- Passey
RB, Gillum RL, Fuller JB, Urry FM, Giles ML. Evaluation and comparison
of 10 glucose methods and the reference method recommended in the
proposed product class standard (1974). Clin Chem. 1977; 23(1):
131-139. https://doi.org/10.1093/clinchem/23.1.131
PMid:832363
- Kaur
G, Lakshmi PVM, Rastogi A, Bhansali A, Jain S, Teerawattananon Y, Bano
H, Prinja S. Diagnostic accuracy of tests for type 2 diabetes and
prediabetes: A systematic review and meta-analysis. PloS One.
2020;15:e0242415. https://doi.org/10.1371/journal.pone.0242415
PMid:33216783 PMCid:PMC7678987
- De
Sanctis V, Soliman AT, Daar S, Tzoulis P, Di Maio S, Kattamis C. Oral
glucose tolerance test: how to maximize its diagnostic value in
children and adolescents. Acta Biomed. 2022; 93(5): e2022318. https://doi.org/10.23750/abm.v93i5.13615.
- Jagannathan
R, Neves JS, Dorcely B, Chung ST, Tamura K, Rhee M, Bergman M. The Oral
Glucose Tolerance Test: 100 Years Later. Diabetes Metab Syndr Obes.
2020;13:3787-3805. https://doi.org/10.2147/DMSO.S246062
PMid:33116727 PMCid:PMC7585270
- De
Sanctis V, Soliman AT, Daar S, Tzoulis P, Kattamis C. Could plasma
glucose (PG) increment (PG %) expand the clinical weight of OGTT?
Preliminary findings in 19 TDT patients (β-TDT) with normal glucose
tolerance. Mediterr J Hematol Infect Dis. 2025 (accepted for
publication), https://doi.org/10.4084/MJHID.2025.050
PMid:40636275 PMCid:PMC12240246
- Pepe
A, Pistoia L, Gamberini MR, Cuccia L, Peluso A, Messina G, Spasiano A,
Allò M, Bisconte MG, Putti MC, Casini T, Dello Iacono N, Celli M,
Vitucci A, Giuliano P, Peritore G, Renne S, Righi R, Positano V, De
Sanctis V, Meloni A. The Close Link of Pancreatic Iron With Glucose
Metabolism and With Cardiac Complications in Thalassemia Major: A
Large, Multicenter Observational Study. Diabetes Care. 2020; 43
(11):2830-2839. https://doi.org/10.2337/dc20-0908
PMid:32887708
- Janghorbani M, Amini M. Normal fasting plasma glucose and risk of prediabetes and type 2 diabetes: the Isfahan Diabetes Prevention Study. Rev Diabet Stud. 2011;8(4):490- 498. https://doi.org/10.1900/RDS.2011.8.490 PMid:22580730 PMCid:PMC3359693
- Tfayli
H, Lee S, Arslanian S. Declining beta cell function relative to insulin
sensitivity with increasing fasting glucose levels in the nondiabetic
range in children. Diabetes Care. 2010; 33(9): 2024-230. https://doi.org/10.2337/dc09-2292
PMid:20805276 PMCid:PMC2928357
- Jouihan
HA, Cobine PA, Cooksey RC, Hoagland EA, Boudina S, Abel ED, Winge DR,
McClain DA. Iron-mediated inhibition of mitochondrial manganese uptake
mediates mitochondrial dysfunction in a mouse model of hemochromatosis.
Mol Med. 2008;14(3-4):98-108. https://doi.org/10.2119/2007-00114.Jouihan
PMid:18317567 PMCid:PMC2258172
- Jin
EJ, Jo Y, Wei S, Rizzo M, Ryu D, Gariani K. Ferroptosis and iron
metabolism in diabetes: Pathogenesis, associated complications, and
therapeutic implications. Front Endocrinol. 2024;15:1447148. https://doi.org/10.3389/fendo.2024.1447148
PMid:39279996 PMCid:PMC11392752
- Rujito L, Fauziyah F, Azizah EF, et al. Scanning SNPs of diabetes mellitus related genes; HNF4A, PTPN, KCNJ11, PPAR gamma among thalassemia patients: a preliminary study. IOP Conf. Series: Earth and Environment Sci.2019;255:012008. https://doi.org/10.1088/1755-1315/255/1/012008