In pulmonary medicine, early risk stratification is challenging because radiological manifestations often appear late, and baseline predictors are incompletely characterized. This challenge is well illustrated by the management of indeterminate pulmonary nodules (IPNs), whose detection has risen with widespread CT screening;[8] complex prediction tools can be difficult to interpret or apply at the bedside.[9,10] By analogy, there is a strong rationale for parsimonious clinical-laboratory nomograms that rely on routinely collected variables at treatment initiation. Such tools could individualize follow-up, prioritize pulmonary rehabilitation referrals, and inform preventive strategies, thereby optimizing care for TB survivors.[11,12]
Despite growing recognition that TB survivors may develop disabling structural sequelae long after microbiological cure, no validated multivariable model integrating demographic, biochemical, and baseline imaging data predicts post-treatment lung destruction (LD). We therefore aimed to develop and internally validate a concise nomogram - grounded in routinely collected clinical-laboratory indices and chest CT features - to estimate an individual’s probability of LD at completion of standard anti-TB therapy, and to benchmark its performance against random forest and support vector machine classifiers while assessing real-world clinical utili ty using decision-curve analysis.
Methods
Study design and setting. We conducted a retrospective, single-center cohort study at Zhuji People’s Hospital (Zhejiang Province, China). The study protocol was approved by the hospital’s Institutional Review Board, and all procedures were conducted in accordance with the Declaration of Helsinki. Owing to the retrospective design, the requirement for written informed consent was waived.Participants. Consecutive adults (≥18 years) with bacteriologically confirmed, drug-naïve pulmonary TB who completed standard first-line therapy and follow-up between April 2021 and April 2025 were screened. We excluded patients who (i) received <6 months of anti-TB therapy; (ii) had pre-existing extensive fibrocavitary lung disease due to non-TB etiologies; (iii) lacked a baseline chest CT or the protocol-mandated follow-up CT obtained within 4 weeks of treatment completion; or (iv) had incomplete electronic records for key covariates.
Outcome definition. The primary endpoint - post-treatment lung destruction (LD) - was prespecified as the presence on follow-up CT of any of the following in ≥1 lobe: (i) volume loss with architectural distortion; (ii) confluent fibrocystic bronchiectasis occupying ≥50% of the lobe; or (iii) parenchymal replacement with dense fibrosis or atelectatic tissue. The definition followed national imaging consensus statements and was adjudicated by two thoracic radiologists (≥5 years’ experience) who were blinded to clinical data. Disagreements were resolved by consensus; interobserver reliability was quantified in a randomly selected subset.
Candidate predictors. Twenty-two baseline variables were extracted from electronic medical and radiology records:
Demographics and comorbidities: age, sex, diabetes, chronic obstructive pulmonary disease, bronchiectasis, silicosis, and inhaled corticosteroid use.
Disease‑specific factors: drug‑resistant TB (yes/no) defined at baseline as rifampicin resistance detected by GeneXpert MTB/RIF and/or phenotypic culture‑based DST indicating resistance to rifampicin and/or isoniazid; symptom‑to‑treatment delay (days).
Laboratory indices: white blood cell and lymphocyte counts; lymphocyte percentage; C-reactive protein (CRP); alanine aminotransferase (ALT) and aspartate aminotransferase (AST); γ-glutamyl transferase (GGT); serum albumin; and prealbumin.
Baseline CT descriptors: number of affected lobes (0-5), presence of pleural effusion, atelectasis, and pulmonary cavity.
Variables were chosen for clinical plausibility and ≥ 90% availability at most TB centers.
Comparator machine learning models. To benchmark performance, we trained a random forest (RF) classifier (randomForest package; 500 trees; √p variables tried at each split) and a support vector machine (SVM) with a radial basis function kernel (e1071 package; cost and γ tuned via grid search). Hyperparameters for both algorithms were optimized using a five-fold cross-validated grid search.
Internal validation and performance metrics. Discrimination was assessed by the area under the receiver-operating characteristic (ROC) curve (AUC) with 95% confidence intervals estimated by DeLong’s method. Calibration was evaluated using calibration plots, the Hosmer-Lemeshow test, and the Brier score. Clinical usefulness was appraised by decision-curve analysis (DCA; dca.R) across risk thresholds of 10-40%. To correct for optimism, 1,000-sample bootstrap resampling was used to estimate the bias-adjusted AUC and calibration slope. Additional metrics included accuracy, sensitivity, specificity, positive and negative predictive values, and F1 score.
Inter-observer reliability. To ensure endpoint robustness, 25 follow-up CT scans (stratified 1:1 by LD status) were randomly selected for blinded duplicate reading. Agreement on LD presence (binary) was summarized using Cohen’s κ (irr package) and raw concordance. In 18 scans, the percentage of lung destruction was scored on a 0-100% scale and analyzed with the two-way random-effects intraclass correlation coefficient [ICC(2,1)] and Bland-Altman limits of agreement (Bland-AltmanLeh package).
Sample size and events per variable considerations. With 61 LD events, the final nine-predictor model satisfied a conservative events-per-variable (EPV) ratio of 6.8. Bootstrap internal validation and penalized shrinkage helped mitigate overfitting given the modest sample size.
Statistical analysis. All analyses were conducted in R (version 4.3) using the following packages: glmnet (4.1-8), MASS (7.3-60), rms (6.7-3), pROC (1.18.4), randomForest (4.7-1.1), e1071 (1.7-13), mice (3.16.0), irr (0.84.1), and BlandAltmanLeh (0.5.2). Two-sided p < 0.05 was considered statistically significant.
Results
Patient characteristics. A total of 205 treatment-naïve adults with pulmonary tuberculosis were included (Table 1). The mean age was 49 ± 19 years, and approximately three-quarters were male. Lung destruction (LD) was identified on follow-up chest CT in 61 participants (29.8%). At baseline, individuals who subsequently developed LD were, on average, about a decade older; had a longer symptom-to-treatment delay; exhibited higher systemic inflammation; and showed poorer nutritional indices. Additionally, silicosis and drug-resistant tuberculosis were several-fold more prevalent in the LD group, and CT features - including atelectasis, cavitation, and multilobar involvement - were disproportionately frequent among eventual LD cases. These imbalances provided a clear clinical rationale for subsequent multivariable modeling.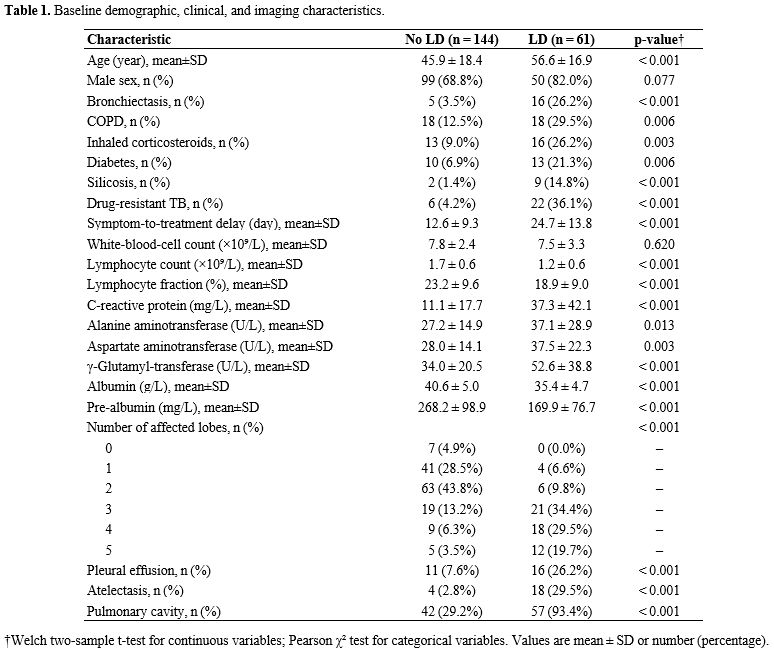 |
|
Missing data pattern and data quality. Data completeness was excellent. Of 4,510 expected data cells, only 37 (0.8%) were missing, and no individual predictor exceeded 3.4% missingness (Supplementary Table S1). Given this minimal loss, we conducted primary complete-case analyses (n = 198) and used multiply imputed datasets for sensitivity analyses to assess robustness.
Derivation of the prediction model. Variables were selected via a two-stage process. First, the least absolute shrinkage and selection operator (LASSO) regression with ten-fold cross-validation reduced the original 22 candidates to 16 variables with non-zero coefficients (Figure 1). These were then entered into a stepwise multivariable logistic regression guided by the Akaike information criterion (AIC), which ultimately retained nine independent predictors: silicosis, drug resistance, delay from symptom onset to treatment, lymphocyte count, C-reactive protein, aspartate aminotransferase, γ-glutamyl transferase, albumin, and the radiologic descriptor “atelectasis/cavity” (Table 2). A nomogram translating the final coefficients into bedside risk points is shown in Figure 2. This concise model balances interpretability and performance, providing the basis for internal validation.
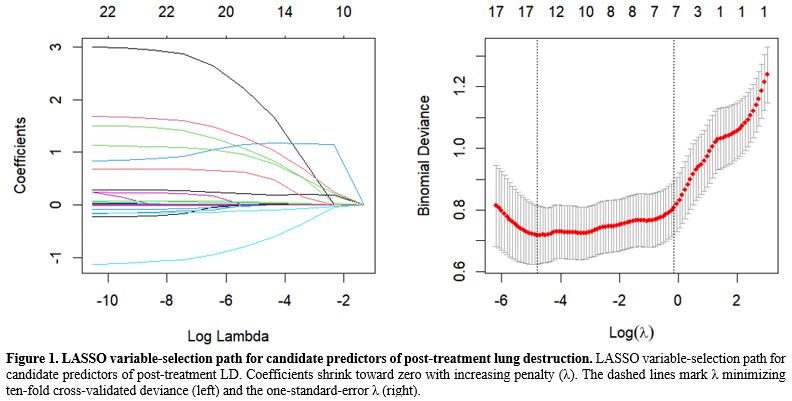 |
Figure 1. LASSO variable‑selection path for candidate predictors of post‑treatment lung destruction.
LASSO variable‑selection path for candidate predictors of
post‑treatment LD. Coefficients shrink toward zero with increasing
penalty (λ). The dashed lines mark λ minimizing ten‑fold
cross‑validated deviance (left) and the one‑standard‑error λ (right). |
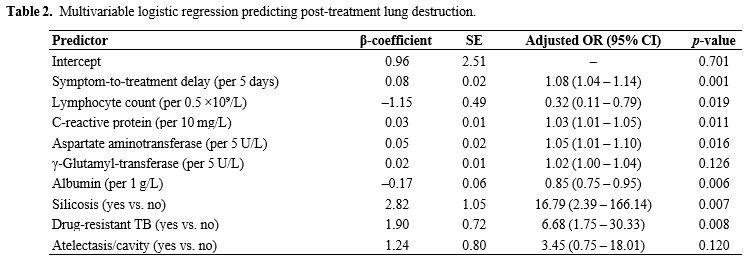 |
Table 2. Multivariable logistic regression predicting post-treatment lung destruction. |
 |
Figure 2. Nomogram for bedside prediction of lung destruction at completion of standard anti-tuberculosis therapy. Nomogram to estimate LD risk at treatment completion from nine predictors (silicosis, drug‑resistant TB, baseline atelectasis/cavity, symptom‑to‑treatment delay, lymphocyte count, CRP, AST, GGT, albumin). Sum points across axes to obtain the total and read the corresponding predicted probability. |
Model performance and internal validation. The nine-factor logistic model showed strong discrimination between patients with and without subsequent LD. The apparent area under the receiver-operating characteristic (ROC) curve (AUC) was 0.93 (95% CI 0.897-0.971), and 1,000-sample bootstrap correction yielded an optimism-adjusted AUC of 0.93, indicating negligible overfitting (Figure 4). Accuracy was 0.87, with sensitivity 0.80 and specificity 0.90; positive and negative predictive values and the F1 score reflected similarly balanced performance (Table 3). Compared with alternative machine-learning approaches evaluated on the same data, logistic regression outperformed both the support vector machine (AUC = 0.92) and random forest classifiers (AUC = 0.91) while offering clearer clinical interpretability. Calibration was satisfactory, with a Brier score of 0.13 and visually close agreement between predicted and observed risks across deciles (Supplementary Figure S1). Within the 10-40% threshold range, the nomogram yielded a higher net benefit than treat-all or treat-none (Supplementary Figure S2). For orientation, choosing thresholds of 10%, 20%, 30%, and 40% corresponds to accepting approximately 9, 4, 2.3, and 1.5 unnecessary escalations, respectively, for each correctly escalated patient, allowing sites to align triage with local capacity (Supplementary Figure S2).
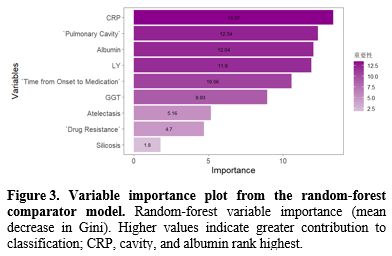 |
Figure 3. Variable importance plot from the random forest comparator model. Random‑forest variable importance (mean decrease in Gini). Higher values indicate greater contribution to classification; CRP, cavity, and albumin rank highest. |
 |
Figure 4. Receiver operating characteristic (ROC) curves comparing predictive models for post-treatment lung destruction. ROC curves comparing models for LD prediction: logistic regression (AUC 0.93), RF (0.91), and SVM (0.92). Shaded bands show 95% CIs |
 |
Table 3. Predictive performance metrics of three modelling strategies. |
 |
Table 4. Variable importance derived from the random forest model. |
Sensitivity to missing data handling. To assess whether the small proportion of missing values biased inference, we refitted the model across ten multiply imputed datasets. Pooled odds ratios differed from complete-case estimates by no more than 6% for any predictor, and the pooled AUC (0.93) was virtually identical to that of the complete-case model, with a bootstrap-based difference of only 0.002 (Supplementary Table S2). These findings indicate that the conclusions drawn from the complete-case analysis are robust to plausible assumptions about the missing-data mechanism.
Reliability of the radiological outcome. Finally, we assessed the objectivity of the LD outcome in a blinded reread of 25 randomly selected follow-up CT scans. Agreement between two experienced thoracic radiologists was excellent: Cohen’s κ = 0.82 (95% CI 0.63-1.00) for the binary presence of LD, with raw concordance of 92%. In the subset in which percentage parenchymal destruction was recorded, the intraclass correlation coefficient was 0.88 (95% CI 0.74-0.95). Bland-Altman analysis showed narrow limits of agreement (-5.0% to +4.0%), indicating that reader variability was unlikely to compromise the study’s primary endpoint (Supplementary Table S3).
Discussion
This study developed a simple yet rigorous nine-factor nomogram for anticipating post-treatment LD in adults with pulmonary tuberculosis. Specifically, the model achieved an AUC = 0.934 with only a marginal optimism correction to 0.925 and yielded the highest net clinical benefit on decision-curve analysis. Notably, the underlying logistic regression framework outperformed more complex random forest and support vector machine classifiers while preserving full interpretability, offering clinicians a transparent, evidence-based means of triaging follow-up imaging and early interventions.In our cohort, the prevalence of post-tuberculosis LD was 29.8%, higher than the long-term UK registry figure of 12% but between the 25% reported in a South African prospective cohort and the 32% seen among Chinese patients with multidrug-resistant pulmonary tuberculosis (MDR-TB).[5,13-15] We confirmed that silicosis, drug resistance, elevated C-reactive protein, hypoalbuminemia, and a prolonged symptom-to-treatment delay independently predicted LD, supporting associations documented for silica exposure,[16,17] MDR-TB,[18] systemic inflammation,[19] and malnutrition.[18] Whereas earlier tools relied on a single radiologic surrogate (e.g., initial cavity size or symptom duration),[20-21] our nine-factor nomogram increased the AUC to 0.934 and delivered the highest net clinical benefit across 10-40% risk thresholds, thereby providing substantially finer risk stratification while remaining transparent and feasible at the bedside.
Biologically, these predictors map onto well-described mechanisms of post-TB lung injury. Chronic inflammation-driven by CRP-induced matrix metalloproteinase activation and sustained oxidative stress-accelerates collagen degradation and cavity expansion; parallel elevations of AST and GGT in our high-risk patients support this inflammatory-fibrotic axis.[22,23] Conversely, robust host immunity and adequate nutrition promote repair: lymphopenia impairs collagen remodeling, and hypoalbuminemia delays cavity closure-findings consistent with Tanzanian and meta-analytic data[24-27] and supported by the protective effects of higher lymphocyte counts and albumin in our model. Radiologically, baseline cavitation and subsegmental atelectasis herald later volume-loss fibrosis, as shown in Japanese and Turkish series.[28-30] Finally, the pronounced risk conferred by silicosis and MDR-TB illustrates both how inhaled silica amplifies fibrogenesis and how persistent bacillary burden in drug-resistant disease extends tissue destruction.[31-33] Together, these pathophysiological links lend mechanistic plausibility to the nomogram and underscore its potential to guide targeted surveillance and early intervention across diverse TB-burden settings.
Because the nomogram uses variables that are routinely collected at treatment initiation (symptom‑to‑treatment delay, lymphocyte count, CRP, AST, GGT, albumin, drug‑resistant TB status, and a simple baseline imaging descriptor), it can be implemented as a paper tool or basic offline calculator without specialized infrastructure. In high‑burden programs with constrained capacity, sites can select a risk threshold within the 10-40% range identified by decision‑curve analysis to triage resources. For example, a higher threshold (e.g., nearer 30-40%) prioritizes follow-up CT/spirometry and early pulmonary-rehabilitation for only the highest-risk patients, whereas a lower threshold (e.g., nearer 10-20%) expands access when resources allow. A pragmatic workflow is to (i) compute risk at treatment initiation, (ii) allocate closer follow‑up (earlier imaging/spirometry, rehabilitation, nutrition support) to those above the local threshold, and (iii) maintain standard follow‑up otherwise. Where baseline CT is unavailable, programs may approximate the "atelectasis/cavity" indicator with chest‑radiograph evidence of cavitation or volume‑loss fibrosis; such adaptation should be accompanied by logistic recalibration (updating intercept and slope using local outcomes) once feasible, without re‑estimating individual coefficients. These applications are intended to support risk‑stratified surveillance while acknowledging that external validation remains necessary before formal clinical adoption.
The single‑center, retrospective nature of our current study has certain limitations. Prospective, multicenter external validation is required to establish generalizability. We prioritized bootstrap internal validation and parsimony, but with 61 events, residual bias is possible. Importantly, the endpoint was radiological since we did not collect spirometry or patient‑reported outcomes. Thus, the nomogram estimates the risk of CT‑defined lung destruction and should not be interpreted as a surrogate for functional limitation or health‑related quality of life. Future work will prospectively validate the model in diverse settings, co-measure spirometry and a brief QoL instrument, and apply logistic recalibration when necessary for local transport without re-estimating individual coefficients.
In summary, we developed and internally validated a parsimonious, nine-factor nomogram that predicts post-treatment lung destruction with excellent discrimination and good calibration. By enabling early identification of high-risk individuals, the tool provides a practical pathway to risk-stratified follow-up imaging, timely referrals for pulmonary rehabilitation, and targeted preventive strategies, thereby improving long-term survivorship care for tuberculosis.
Ethics approval and consent to participate
The protocol was approved by the Zhuji People’s Hospital's Institutional Review Board, and written informed consent was obtained for all participants. All procedures conformed to the Declaration of Helsinki.Funding
This study was supported by the Zhejiang Provincial Traditional Chinese Medicine Science and Technology Program (Traditional Chinese Medicine Health Service Research Plan), Grant No. 2023ZF180, and the Zhejiang Provincial Traditional Chinese Medicine Science and Technology Program (Scientific Research Fund Project), Grant No. 2022ZA177.Data availability statement
Data sets generated during the current study are available from the corresponding author on reasonable request.Author Contribution Statement
The authors confirm contribution to the paper as follows: study conception and design: M.X.; data collection: M.X., J.H., J.F.; analysis and interpretation of results: M.X., J.H., J.F.; draft manuscript preparation: M.X., J.H., J.F. All authors reviewed the results and approved the final version of the manuscript.References
- Yang, H. Y., Ruan, X. D., Li, W., Xiong, J., &
Zheng, Y. (2024). Global, regional, and national burden of tuberculosis
and attributable risk factors for 204 countries and territories,
1990-2021: a systematic analysis for the Global Burden of Diseases 2021
study. BMC Public Health, 24(1) https://doi.org/10.1186/s12889-024-20664-w PMid:39529028 PMCid:PMC11552311
- World
Health Organization. (2014). The burden of disease caused by TB. In
Global tuberculosis report 2014 (pp. 7-31). World Health Organization. https://iris.who.int/bitstream/handle/10665/137094/9789241564809_eng.pdf
- Allwood,
B. W., Byrne, A., Meghji, J., Rachow, A., van der Zalm, M. M., &
Schoch, O. D. (2021). Post-Tuberculosis Lung Disease: Clinical Review
of an Under-Recognised Global Challenge. Respiration, 100(8), 751-763. https://doi.org/10.1159/000512531 PMid:33401266
- Cupido,
G., & Günther, G. (2024). Post tuberculosis lung disease and
tuberculosis sequelae: A narrative review. Indian Journal of
Tuberculosis, 71(1), 64-72. https://doi.org/10.1016/j.ijtb.2023.04.001 PMid:38296392
- Irfan,
M. (2016). Post-tuberculosis pulmonary function and noninfectious
pulmonary disorders. The International Journal of Mycobacteriology, 5. https://doi.org/10.1016/j.ijmyco.2016.08.015 PMid:28043612
- Yarbrough,
C., Miller, M. S., Zulu, M., Sharp, D., Andom, A. T., Ndayizigiye, M.,
Seung, K. J., & Sonenthal, P. D. (2024). Post-tuberculosis lung
disease: Addressing the policy gap. PLOS Global Public Health, 4(9),
e0003560. https://doi.org/10.1371/journal.pgph.0003560 PMid:39236033 PMCid:PMC11376554
- Seo,
W., Kim, H.-W., Kim, J. S., & Min, J. (2024). Long term management
of people with post-tuberculosis lung disease. The Korean Journal of
Internal Medicine, 39, 7-24. https://doi.org/10.3904/kjim.2023.395 PMid:38225822 PMCid:PMC10790047
- Paez,
R., Kammer, M. N., Kammer, M. N., Massion, P. P., & Massion, P. P.
(2021). Risk stratification of indeterminate pulmonary nodules. Current
Opinion in Pulmonary Medicine, 27(4), 240-248. https://doi.org/10.1097/MCP.0000000000000780 PMid:33973553
- Hsu, W., & Sohn, J. H. (2022). Using radiomics for risk stratification: Where we need to go. Radiology, 302(2), 435-437. https://doi.org/10.1148/radiol.2021212085 PMid:34726541 PMCid:PMC8805519
- Kim,
R. Y. (2024). Radiomics and artificial intelligence for risk
stratification of pulmonary nodules: Ready for primetime? Cancer
Biomarkers, 1-11. https://doi.org/10.3233/CBM-230360 PMid:38427470 PMCid:PMC11300708
- Oke,
J. L., Pickup, L. C., Declerck, J., Callister, M. E., Baldwin, D.,
Gustafson, J., Peschl, H., Ather, S., Tsakok, M., Exell, A., &
Gleeson, F. (2018). Development and validation of clinical prediction
models to risk stratify patients presenting with small pulmonary
nodules: a research protocol. Diagnostic and prognostic research, 2,
22. https://doi.org/10.1186/s41512-018-0044-3 PMid:31093569 PMCid:PMC6460802
- Liang,
W., Tao, J., Cheng, C., Sun, H., Ye, Z., Wu, S., Guo, Y., Zhang, Q.,
Chen, Q., Liu, D., Liu, L., Tian, H., Lin, T., Zhong, N., Fan, J.,
& He, J. (2024). A clinically effective model based on cell-free
DNA methylation and low-dose CT for risk stratification of pulmonary
nodules. Cell Reports Medicine, 101750. https://doi.org/10.1016/j.xcrm.2024.101750 PMid:39341207 PMCid:PMC11513810
- De
Valliere, S., & Barker, R. D. (2004). Residual lung damage after
completion of treatment for multidrug-resistant tuberculosis.
International Journal of Tuberculosis and Lung Disease, 8(6), 767-771.
- Cupido,
G., & Günther, G. (2024). Post tuberculosis lung disease and
tuberculosis sequelae: A narrative review. The Indian journal of
tuberculosis, 71(1), 64-72. https://doi.org/10.1016/j.ijtb.2023.04.001 PMid:38296392
- Ma,
Y., Ye, X. P., Fu, X. Y., & Wu, G. H. (2022). Zhonghua jie he he hu
xi za zhi = Zhonghua jiehe he huxi zazhi = Chinese journal of
tuberculosis and respiratory diseases, 45(10), 955-959.
- Ehrlich,
R., Akugizibwe, P., Siegfried, N., & Rees, D. (2021). The
association between silica exposure, silicosis and tuberculosis: a
systematic review and meta-analysis. BMC Public Health, 21(1), 953. https://doi.org/10.1186/s12889-021-10711-1 PMid:34016067 PMCid:PMC8136154
- Cheepsattayakorn,
A., & Cheepsattayakorn, R. (2018). Silicosis-Associated
Tuberculosis: Management and Control. American Journal of Public Health
Research, 6(2), 125-129.
- Rupani,
M. P. (2006). Silicosis predicts drug resistance and retreatment among
tuberculosis patients in India: a secondary data analysis from
Khambhat, Gujarat (2006-2022). BMC Pulmonary Medicine, 24(1). https://doi.org/10.1186/s12890-024-03338-6 PMid:39425124 PMCid:PMC11490045
- D'Sa,
L., Pezzuto, F., Lunardi, F., Scalvenzi, F., Tinè, M., Comacchio, G.
M., Giraudo, C., & Calabrese, F. (2023). A Complex Case of
Pulmonary Silico-Tuberculosis and Review of Literature. Diagnostics,
13(17). https://doi.org/10.3390/diagnostics13172728 PMid:37685266 PMCid:PMC10486577
- Pandey,
S. K., Singh, K. U., Dingankar, R. S., Jadhav, K., Gupta, K., &
Yadav, R. K. (2023). Prediction of tuberculosis disease progression
with AI analysis of clinical data. 2023 International Conference on
Artificial Intelligence for Innovations in Healthcare Industries
(ICAIIHI), 1-6. https://doi.org/10.1109/ICAIIHI57871.2023.10489091
- Lv,
X., Li, Y., Cai, B., He, W., Wang, R., Chen, M., Pan, J., & Hou, D.
(2023). Utility of Machine Learning and Radiomics Based on Cavity for
Predicting the Therapeutic Response of MDR-TB. Infection and drug
resistance, 16, 6893-6904. https://doi.org/10.2147/IDR.S435984 PMid:37920476 PMCid:PMC10619461
- Lavrova,
A. I., Esmedljaeva, D. S., Belik, V., & Postnikov, E. B. (2019).
Matrix Metalloproteinases as Markers of Acute Inflammation Process in
the Pulmonary Tuberculosis. Data, 4(4), https://doi.org/10.3390/data4040137.
- Amaral,
E. P., Vinhaes, C. L., Oliveira-de-Souza, D., Nogueira, B. M. F.,
Akrami, K., Akrami, K., & Andrade, B. B. (2021). The Interplay
Between Systemic Inflammation, Oxidative Stress, and Tissue Remodeling
in Tuberculosis. Antioxidants & Redox Signaling, 34(6), 471-485. https://doi.org/10.1089/ars.2020.8124 PMid:32559410 PMCid:PMC8020551
- Squeglia,
F., Ruggiero, A., & Berisio, R. (2018). Collagen degradation in
tuberculosis pathogenesis: the biochemical consequences of hosting an
undesired guest. Biochemical Journal, 475(19), 3123-3140. https://doi.org/10.1042/BCJ20180482 PMid:30315001
- Kumar,
N. P., Moideen, K., Nancy, A., Viswanathan, V., Thiruvengadam, K.,
Sivakumar, S., Hissar, S., Kornfeld, H., & Babu, S. (2021). Acute
Phase Proteins Are Baseline Predictors of Tuberculosis Treatment
Failure. Frontiers in immunology, 12, 731878. https://doi.org/10.3389/fimmu.2021.731878 PMid:34867953 PMCid:PMC8634481
- Moores,
R., Brilha, S., Brilha, S., Schutgens, F., Elkington, P. T., Elkington,
P. T., & Friedland, J. S. (2017). Epigenetic Regulation of Matrix
Metalloproteinase-1 and -3 Expression in Mycobacterium tuberculosis
Infection. Frontiers in Immunology, 8, 602. https://doi.org/10.3389/fimmu.2017.00602 PMid:28596772 PMCid:PMC5442172
- Källenius,
G., Correia‐Neves, M., & Sundling, C. (2024). Diagnostic markers
reflecting dysregulation of the host response in the transition to TB
disease. International Journal of Infectious Diseases, 106984. https://doi.org/10.1016/j.ijid.2024.106984 PMid:38417614
- Im,
J. G., Itoh, H., Lee, K. S., & Han, M. C. (1995). CT-pathology
correlation of pulmonary tuberculosis. Critical Reviews in Diagnostic
Imaging, 36(3), 227-285.
- Lee,
J., Lee, K. S., Jung, K.-J., Han, J., Kwon, O., Kim, J. H., & Kim,
T. (2000). Pulmonary tuberculosis: CT and pathologic correlation.
Journal of Computer Assisted Tomography, 24(5), 691-698. https://doi.org/10.1097/00004728-200009000-00005 PMid:11045687
- Deshpande,
S., Joshi, A., & Shah, A. (2020). Aftermath of pulmonary
tuberculosis: computed tomography assessment. Polish Journal of
Radiology, 85(1), 137-147. https://doi.org/10.5114/pjr.2020.93714 PMid:32322321 PMCid:PMC7172931
- Im, J. G., Itoh, H., & Han, M. C. (1995). CT of pulmonary tuberculosis. Seminars in Ultrasound, CT and MRI, 16(5), 420-434. https://doi.org/10.1016/0887-2171(95)90029-2 PMid:8527173
- Cheng,
N., Wu, S., Luo, X., Xu, C., Lou, Q., Zhu, J., You, L., & Li, B.
(2021). A Comparative Study of Chest Computed Tomography Findings: 1030
Cases of Drug-Sensitive Tuberculosis versus 516 Cases of Drug-Resistant
Tuberculosis. Infection and Drug Resistance, 14, 1115-1128. https://doi.org/10.2147/IDR.S300754 PMid:33776457 PMCid:PMC7987723
- Kim,
S., Min, J., & Lee, J. (2014). Radiological Findings of Primary
Multidrug-resistant Pulmonary Tuberculosis in HIV-seronegative
Patients. Hong Kong Journal of Radiology, 17(1), 4-8. https://doi.org/10.12809/hkjr1413213
Supplementary Files
 |
Supplementary Table S1. Variable-level missingness. |
 |
Supplementary Table S2. Complete case versus multiply imputed estimates for the final nine-predictor model. |
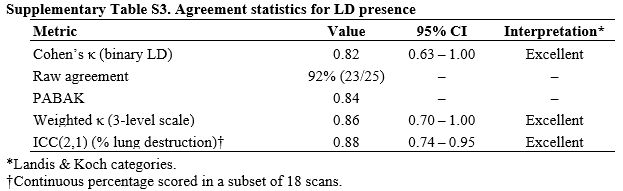 |
Supplementary Table S3. Agreement statistics for LD presence |
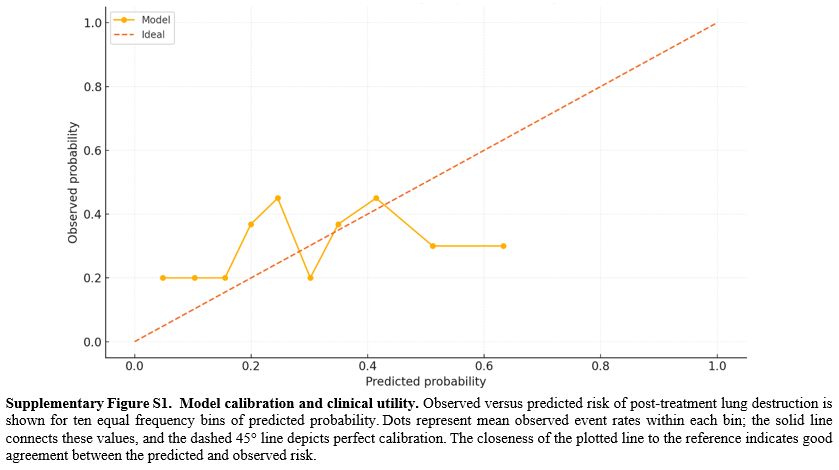 |
Supplementary Figure S1. Model calibration and clinical utility. Observed versus predicted risk of post-treatment lung destruction is shown for ten equal frequency bins of predicted probability. Dots represent mean observed event rates within each bin; the solid line connects these values, and the dashed 45° line depicts perfect calibration. The closeness of the plotted line to the reference indicates good agreement between the predicted and observed risk. |
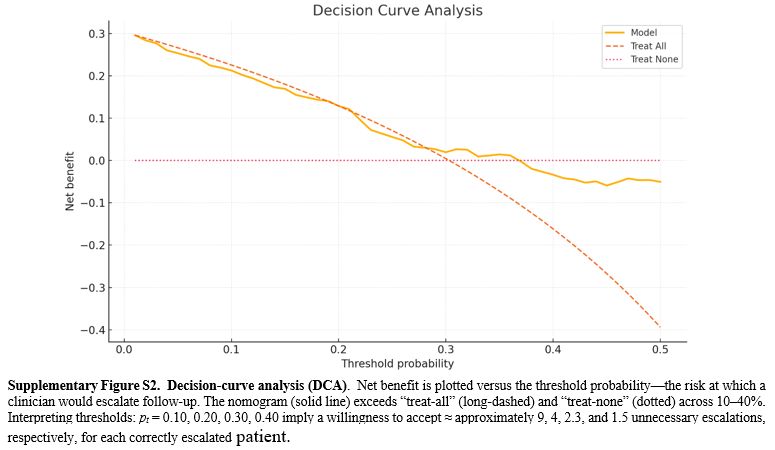 |
Supplementary Figure S2. Decision‑curve analysis (DCA). Net benefit is plotted versus the threshold probability—the risk at which a clinician would escalate follow‑up. The nomogram (solid line) exceeds “treat‑all” (long‑dashed) and “treat‑none” (dotted) across 10–40%. Interpreting thresholds: pt = 0.10, 0.20, 0.30, 0.40 imply a willingness to accept ≈ approximately 9, 4, 2.3, and 1.5 unnecessary escalations, respectively, for each correctly escalated patient. |