Although single-timepoint cytokine studies in pediatric Mycoplasma pneumoniae pneumonia (MPP) show that IL-6/IL-10 and CXCL10/IP-10 correlate with clinical severity,[11,12] most investigations are cross-sectional and rely on routine radiology reports rather than on centrally, blindly adjudicated imaging outcomes aligned with standardized WHO endpoints.[13] Risk tools for necrotizing complications likewise emphasize static clinical or laboratory features and large lesion radiography without standardized adjudication.[14] By contrast, outside MPP, serial cytokine trajectories demonstrate prognostic value in pediatric acute respiratory failure.[15] These gaps motivate the evaluation of whether baseline levels and early changes in key cytokines improve the prediction of centrally adjudicated CXR-defined consolidation (14 days) and CT-defined necrotizing pneumonia (28 days) in children.
We aimed to determine whether baseline (T0) cytokine levels and short-term changes (ΔT0-T1) associate with radiologic complications in pediatric Mycoplasma pneumoniae pneumonia, specifically CXR-defined consolidation within 14 days and CT-defined necrotizing pneumonia within 28 days. To address this objective, we conducted a retrospective single-center cohort study of hospitalized, PCR-confirmed cases and quantified a multiplex cytokine panel (IL 6, IL 8, IL 10, IL 17A, IFN γ, TNF α, and CXCL10/IP 10) using residual clinical specimens collected at four prespecified time points (T0–T3). Analyses incorporated an explicit day 3 landmark at T1, restricting Δ-based predictors to participants who remained event-free at that time to mitigate immortal time bias and preserve temporal ordering between biomarkers and outcomes.
Methods
Study design and participants. We conducted a retrospective, single-center, non-interventional cohort of hospitalized children with PCR-confirmed MPP at Huizhou Zhongda Hulya Hospital from October 2022 to September 2024. This study was conducted in accordance with the Declaration of Helsinki. The protocol was reviewed and approved by the Ethics Committee of Huizhou Zhongda Hulya Hospital, which waived the requirement for informed consent because the study was a retrospective analysis of de-identified, routinely collected data and posed minimal risk to participants. All data were anonymized prior to analysis.Eligible participants were hospitalized children aged 1 month to 16 years with PCR-confirmed Mycoplasma pneumoniae pneumonia during October 2022 to September 2024. Inclusion required availability of a residual clinically indicated blood sample within 24 hours of admission (T0) for cytokine measurement and follow up through 28 days to allow blinded adjudication of CXR defined consolidation ≤14 days and CT defined necrotizing pneumonia ≤28 days (CT obtained at clinicians’ discretion). We excluded screen failures identified prior to analysis: inability to verify PCR positivity; absence of a T0 residual sample within 24 hours; insufficient clinical or imaging data for outcome adjudication within the prespecified windows; age outside the 1-month–16 years range; or not hospitalized for the index episode. Co-infections, pre-T0 systemic steroids, macrolide resistance status, and chronic comorbidities were not exclusionary and were recorded for sensitivity analyses or covariate assessment.
Cytokine sampling and measurements. The hospital clinical laboratory processed venous blood collected for routine care. Serum or plasma was separated by standard centrifugation and aliquoted, and study aliquots were cryopreserved at −80 °C. For testing, aliquots were thawed once on ice, gently mixed, and clarified by brief centrifugation. Repeat freeze–thaw cycles were avoided.
Assay platform, reagents, and core operating parameters: Cytokines were quantified using a multiplex bead-based immunoassay (Luminex® xMAP®): MILLIPLEX® MAP Human Cytokine/Chemokine Magnetic Bead Panel, HCYTMAG 60K (Merck Millipore Sigma, Burlington, MA, USA), run according to the manufacturer’s instructions on a Luminex platform with standard acquisition software. After a single controlled thaw on ice, 25 µL serum/plasma per well was combined with antibody immobilized magnetic beads and incubated 2 hours at room temperature (20–25 °C) with shaking (the IFU also permits overnight, 16–18 h at 4 °C). Plates were then washed and incubated with detection antibodies for 1 hour at room temperature, followed by streptavidin–phycoerythrin for 30 minutes at room temperature, with washes between steps. Calibration used six-point standards spanning 3.2–10,000 pg/mL and five-parameter logistic (5 PL) curve fitting. Concentrations were exported in pg/mL for analysis. Per kit specifications, the lower limits of detection for our analytes were: IL 6 1.3 pg/mL; IL 8 0.7 pg/mL; IL 10 1.6 pg/mL; IL 17A 1.2 pg/mL; IFN γ 1.1 pg/mL; TNF α 1.1 pg/mL; and CXCL10/IP 10 14.0 pg/mL; the upper reportable limit was the highest standard, 10,000 pg/mL, with above range samples diluted and re assayed when available.
Cytokines were measured from residual serum or plasma at four prespecified windows: T0 within 24 hours of admission, T1 on days 3–5, T2 on days 7–10, and T3 within 48 hours before discharge. Because the median length of stay was <7 days, T2 sampling was permitted at hospital-affiliated outpatient sites. Accordingly, the T2 subset may overrepresent children who either improved sufficiently to return on time or remained hospitalized due to greater severity; T2 measures were therefore summarized descriptively and were not used in the primary multivariable models, which relied on T0/T1. Concentrations were log2 transformed prior to analysis, and Δ values were defined as log2 fold changes from T0 to T1. To avoid bias from incomplete sampling, Δ predictors were computed only when both T0 and T1 were available. For consolidation, we used Δ predictors exclusively within the day 3 landmark set, and for NP (CT subset), we allowed Δ predictors only when the T1 sample predated the first CT diagnosing NP (temporal alignment verified for all NP events included in modeling). Models used complete cases for their specified predictors; no imputation was performed.
Sampling completeness and attrition categories: Sampling completeness declined at later windows. To document reasons for missed draws, we classified non collection into prespecified, non mutually exclusive categories recorded from the chart and laboratory logs: (i) early discharge before the window; (ii) outpatient scheduling/no show after discharge (T2); (iii) transfer to another facility or higher level care; (iv) insufficient specimen volume or sample rejection; and (v) operational/logistic constraints.
Because Δ predictors reflect change up to T1, we retrospectively abstracted systemic corticosteroid exposure from the medication administration record (MAR) to identify new initiation or dose intensification occurring after T0 and before T1. Intensification was defined a priori as either an increase in prednisone equivalent daily dose by ≥0.5 mg/kg/day or initiation of pulse dose methylprednisolone. We coded a single indicator (SteroidChange_T0-T1: none vs initiated/intensified) and, when data permitted, a three-level variable (none; continued from pre-T0 without intensification; initiated/intensified).
Outcomes and imaging adjudication. Primary outcomes were chest radiograph (CXR) – defined consolidation within 14 days of admission, using the World Health Organization end point definition, and computed tomography (CT) – defined NP within 28 days. Imaging was obtained at the clinicians’ discretion and was centrally, blindly adjudicated according to prespecified criteria without access to cytokines or other predictors. Accordingly, the NP component estimates risk among scanned children (a conditional evaluation) and is not extrapolated to unscanned children. All participants underwent CXR. A subset underwent CT based on clinical indications. Incidence and confidence intervals for imaging and outcomes are reported with explicit denominators to promote transparency.
CT was performed at the clinicians’ discretion; therefore, NP models were restricted to the CT subset and should be interpreted conditionally on the presence of CT. The primary NP analysis used Firth-penalized logistic regression with predictors limited to T0 IL-6 and, when temporally valid, ΔIL-6 (T1 prior to the first CT establishing NP). To probe selection on observed covariates into the scanned subset, we conducted a pre specified sensitivity analysis using inverse probability of scanning weights (IPSW) estimated via logistic regression for the probability of receiving CT within 28 days as a function of baseline variables available before CT (age, sex, pre T0 systemic steroids, viral coinfection, and T0 cytokines IL 6, IL 10, and CXCL10/IP 10). Stabilized weights were truncated at the 1st/99th percentiles to curb extreme values, and robust (sandwich) standard errors were used. Because Firth penalization is not standard with probability weights, the IPSW sensitivity used weighted logistic regression with the same predictors, interpreted alongside the primary Firth model. We did not fit a Heckman two-stage model because we lacked a credible exclusion restriction variable that affects scanning but not NP risk. Instead, we report the IPSW sensitivity and make the target evaluation explicit (risk among children who are scanned). The NP component’s generalizability is therefore limited to settings with similar CT ordering practices.
Statistical analysis. We summarized continuous variables as medians (IQRs) and categorical variables as counts with 1 decimal place. Key proportions are reported with
Wilson 95% confidence intervals (CIs). Cytokines were analyzed on the log2 scale. Δ predictors were defined as log2 fold change from T0 to T1. Univariable screening used logistic regression for each cytokine with Benjamini–Hochberg false discovery rate (FDR) control within outcome families. Multivariable inference used penalized logistic regression tailored to each decision point: an Admission model incorporating T0 cytokines to predict CXR defined consolidation ≤14 days in the full cohort, and a day 3 landmark model restricted to participants event free at T1 using Δ cytokines (T0-T1) to predict post T1 consolidation. For NP in the CT subset, we used Firth-penalized logistic regression with predictors T0 IL-6 and, when temporally valid, ΔIL-6. Temporal validity was defined as a priori as the T1 sample collected strictly before the first CT that established NP. All primary multivariable models were cytokine only and are therefore interpreted as mutually adjusted across cytokines.
To assess robustness to confounding while limiting overfitting, we pre-specified sensitivity models that added age, sex, viral coinfection, and pre-T0 systemic steroids. Because Δ predictors can be influenced by intercurrent therapy, we specifically addressed steroid initiation/intensification between T0 and T1 using three complementary approaches in the landmark analysis: adding a SteroidChange_T0-T1 indicator as a covariate, inverse probability of treatment weighting (IPTW) for starting/intensifying steroids before T1 with stabilized weights from baseline covariates (age, sex, viral coinfection, pre T0 steroids, and T0 IL 6, IL 10, CXCL10/IP 10), truncating at the 1st/99th percentiles and using robust standard errors, and restriction to children without steroid change before T1. For NP, because CT was obtained at the clinician's discretion, the primary evaluation is conditional on scanning. We added inverse probability of scanning sensitivity using stabilized, truncated weights from baseline covariates, with robust standard errors, and interpreted alongside the Firth model.
Model performance was evaluated by discrimination and calibration. Clinical utility was examined using decision curve analysis (DCA) across 5–40% thresholds, a range chosen a priori to reflect feasible decision points for early imaging/consult escalation in this population (lower thresholds imply imaging nearly all children; higher thresholds exceed the cohort prevalence). For each threshold pt, the net benefit was calculated as, and we also reported the net reduction in interventions per 100 versus treating all. Uncertainty in the model curve was summarized using pointwise 95% bootstrap bands (patient-level resampling with refitting); treat-all and treat-none are deterministic and shown without bands.
Results
Out of 286 hospitalized children with PCR-confirmed Mycoplasma pneumoniae pneumonia, 268 were included after a quality review of the data (Figure 1). The median age was 6.1 years (IQR 3.2–9.4), 53.0% were male, and the median length of stay was 6 days (IQR 4–9). Sampling occurred within predefined windows: T0 for all 268 children (100.0%), T1 for 212 children (79.1%), T2 for 148 children (55.2%; with 41.2% inpatient and 58.8% outpatient), and T3 for 96 children (35.8%). Before T0, 30 children (11.2%) received systemic steroids, and 64 (23.9%) had a viral coinfection. Macrolide-resistance testing was available for 152 children (56.7%), with resistance found in 44 (28.9%). All children had chest radiography, with 96 (35.8%) meeting the WHO endpoint for consolidation within 14 days. Computed tomography was performed on 124 children (46.3%), identifying necrotizing pneumonia (NP) in 28 children (22.6%; 10.4% overall) (Tables 1-2 and Figure 1).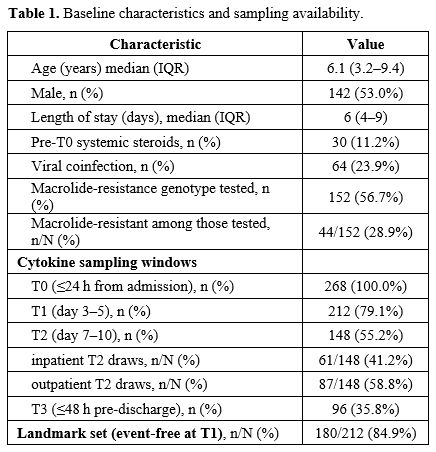 |
Table 1. Baseline characteristics and sampling availability. |
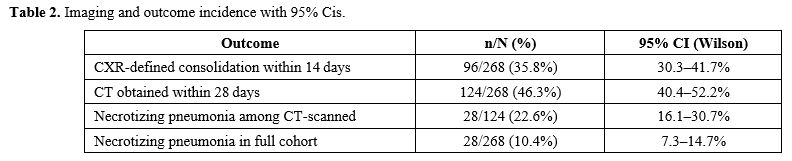 | Table 2. Imaging and outcome incidence with 95% Cis. |
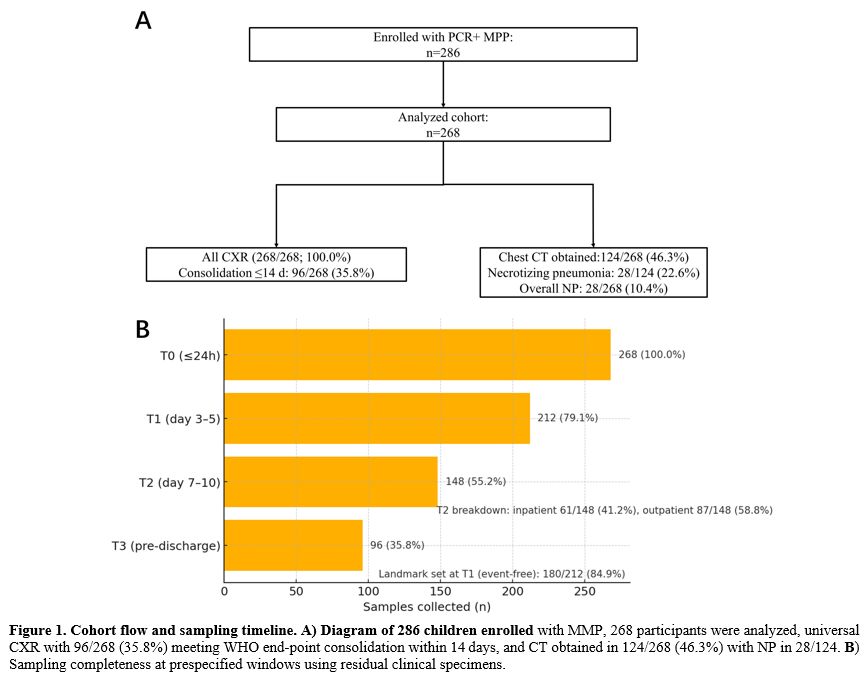 |
Figure 1. Cohort flow and sampling timeline. A) Diagram of 286 children enrolled with MMP, 268 participants were analyzed, universal CXR with 96/268 (35.8%) meeting WHO end point consolidation within 14 days, and CT obtained in 124/268 (46.3%) with NP in 28/124. B) Sampling completeness at prespecified windows using residual clinical specimens. |
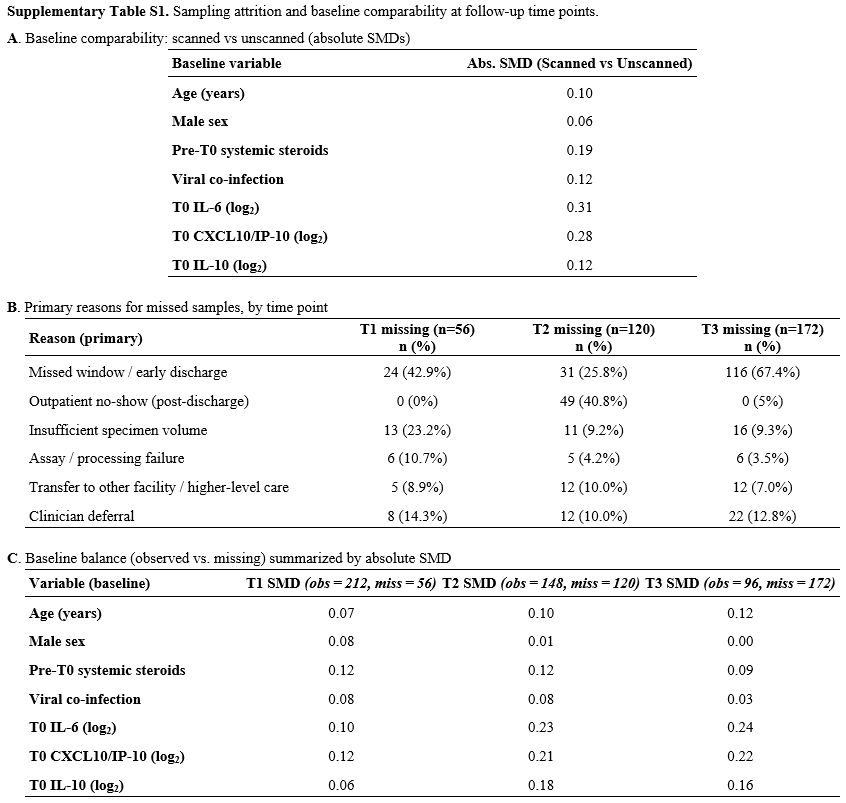
A comparison of baseline characteristics between scanned and unscanned children (age, sex, pre-T0 steroids, viral coinfection, and T0 IL-6/IL-10/IP-10) was summarized using absolute standardized differences to assess selection bias into the CT subset (Supplementary Table S1A). Attrition rates were 20.9% at T1, 44.8% at T2, and 64.2% at T3. Supplementary Table S1B details reasons for missing data at each window, while Supplementary Table S1C compares baseline characteristics (age, sex, pre-T0 steroids, viral co-infection, and T0 cytokines) between children with and without samples at T1/T2/T3 to evaluate selection bias. Given these patterns, findings from T2 and T3 are interpreted descriptively, with primary analyses focused on T0 and T1.
In the cytokine only multivariable model (mutually adjusted across cytokines), higher admission IL 6, CXCL10/IP 10, and IL 10 predicted CXR defined consolidation with mutually adjusted ORs per log2 unit of 1.45 (95% CI 1.16–1.83; q=0.010), 1.52 (1.21–1.93; q<0.010), and 1.28 (1.03–1.60; q=0.040), respectively.
Discrimination was AUC 0.78 (95% CI 0.73–0.83; optimism corrected 0.76) and calibration slope 0.97. Results were similar after adding age, sex, viral coinfection, and pre-T0 steroids, supporting the primary cytokine only specification (Table 3, Figure 2, and Supplementary Table S2).
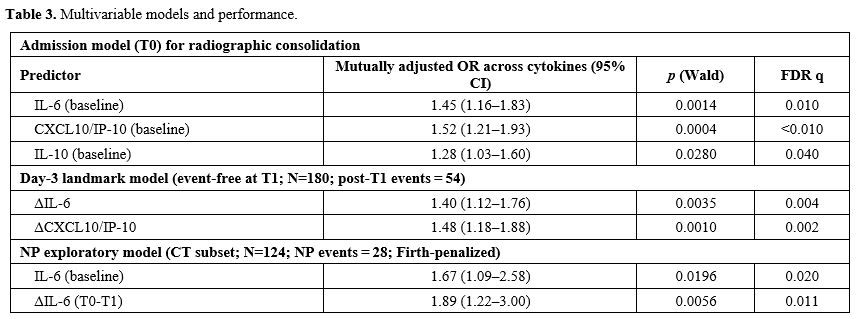 |
Table 3. Multivariable models and performance. |
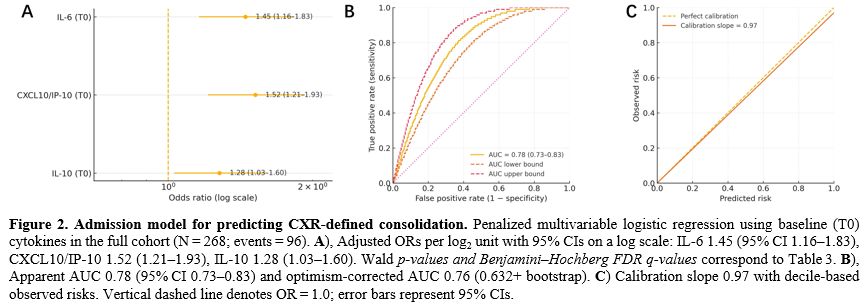 |
Figure 2. Admission model for predicting CXR defined consolidation. Penalized multivariable logistic regression using baseline (T0) cytokines in the full cohort (N = 268; events = 96). A), Adjusted ORs per log2 unit with 95% CIs on a log scale: IL 6 1.45 (95% CI 1.16–1.83), CXCL10/IP 10 1.52 (1.21–1.93), IL 10 1.28 (1.03–1.60). Wald p-values and Benjamini–Hochberg FDR q-values correspond to Table 3. B), Apparent AUC 0.78 (95% CI 0.73–0.83) and optimism corrected AUC 0.76 (0.632+ bootstrap). C) Calibration slope 0.97 with decile-based observed risks. Vertical dashed line denotes OR = 1.0; error bars represent 95% CIs. |
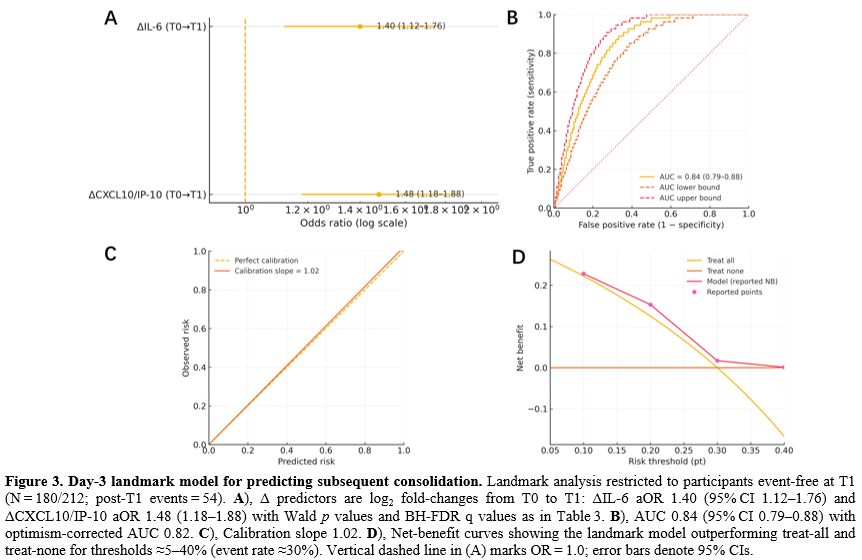
Among children event-free at T1 (n=180/212; post-T1 events=54), rises in IL-6 and CXCL10/IP-10 were associated with subsequent consolidation (mutually adjusted ORs per log2 fold change 1.40 [95% CI 1.12–1.76; q=0.004] and 1.48 [1.18–1.88; q=0.002]). Discrimination improved versus admission (AUC 0.84, 95% CI 0.79–0.88; optimism corrected 0.82) with a calibration slope of 1.02. Decision curve analysis (5–40% thresholds) showed higher net benefit than treat all/none, with bootstrap 95% confidence bands and illustrative gains at sentinel thresholds: at 10%, model NB 0.228 versus treat all 0.222 (≈5.5 fewer interventions per 100); at 20%, 0.153 versus 0.125 (≈11.3 fewer/100), at 30%, 0.017 versus 0.000 (≈3.9 fewer/100), and at 40%, model NB 0.001 while treat all was harmful (−0.167; ≈25.2 fewer/100). Because Δ predictors may be influenced by therapy, we examined intercurrent steroid initiation/intensification before T1: covariate adjustment, IPTW using baseline covariates, and restriction to children without steroid change. These approaches yielded estimates and performance similar to the primary model (Table 3, Figure 3, and Supplementary Table S2).
 |
|
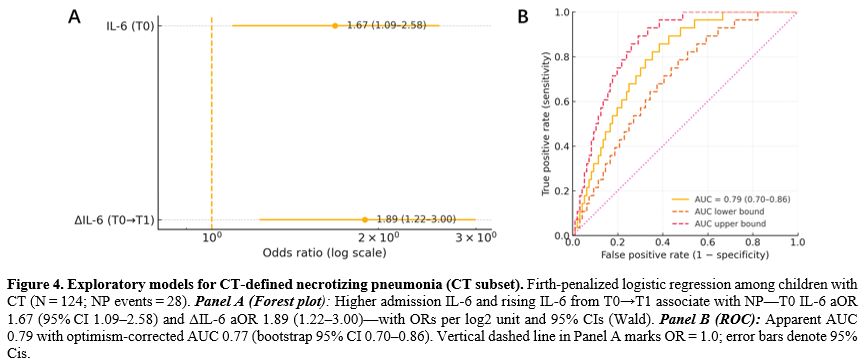
In children who underwent CT (n=124; NP=28), Firth penalized models (cytokine only, mutually adjusted) associated higher T0 IL 6 and rising IL 6 with NP (OR 1.67, 95% CI 1.09–2.58; and 1.89, 1.22–3.00), with AUC 0.79 (optimism corrected 0.77). In the CT subset (n = 124), 98 (79.0%) had T1 collected before the first CT and were included in ΔIL 6 analyses, including 22/28 (78.6%) NP cases; 26 were excluded (no T1, n = 16; T1 after CT, n = 8; unverifiable timing, n = 2). To probe selection into scanning, inverse probability of scanning weighting based on baseline covariates yielded directionally consistent associations and similar discrimination. By design, these NP estimates are conditional on being scanned and are not extrapolated to unscanned children. IPSW sensitivity produced directionally consistent forecasts (Table 3, Figure 4, and Supplementary Table S2).
 |
|
Across prespecified checks (Supplementary Table S2), effect sizes, discrimination, and calibration were stable. For the admission model, adding clinical covariates, excluding pre T0 steroids, removing viral coinfections, or adjusting for macrolide resistance produced AUCs of 0.77–0.79 (corrected 0.75–0.77) and slopes of 0.96–0.98, with IL-6 and CXCL10/IP-10 remaining significant. At the same time, IL-10 attenuated to borderline significance in the resistance subset. For the landmark models, handling steroid initiation/intensification between T0 and T1 by covariate adjustment, IPTW, or restriction left ΔIL 6 and ΔCXCL10/IP 10 materially unchanged (OR ranges 1.36–1.39 and 1.45–1.47) with AUC 0.83–0.84 (corrected 0.81–0.82) and slopes ≈1.01–1.02. In NP analyses, adding clinical covariates, removing coinfections, or applying scanning weights yielded IL 6 (T0) OR 1.59–1.66 and ΔIL 6 OR 1.81–1.89 with apparent AUC 0.78–0.79 (corrected 0.76–0.77 for unweighted Firth models), reinforcing robustness while acknowledging conditional transportability (Supplementary Table S2).
Calibration in the large (intercept) is reported alongside slope in Figures 2-4 and Supplementary Table S1, and a simple risk stratification table showing bins at 10%, 20%, 30% with observed event rates is provided in Supplementary Table S3 to support pathway thresholding.
Discussion
In this retrospective cohort of hospitalized children with MMP, we found that both admission cytokines and early rises (days 3–5) provided clinically meaningful, temporally coherent predictions of adjudicated CXR-defined consolidation, and ΔIL-6 signaled NP risk among scanned children. These results justify a pragmatic, adjunctive, cytokine-anchored pathway focused on the T0/T1 windows, with NP findings interpreted conditionally on scanning.We make our target evaluation explicit and delimit where they transport: (i) 14 day CXR defined consolidation risk at admission in the full hospitalized MPP cohort; (ii) post T1 (day 3–5) consolidation risk among children event free at T1; and (iii) 28 day CT defined NP risk among children who underwent CT, an explicitly conditional estimate that transports only to scanned children and to centers with similar CT ordering practices.[16-18] In our data, discrimination was AUC 0.78 (bootstrap corrected 0.76) at admission and AUC 0.84 (corrected 0.82) at day 3. In the CT subset, the NP model had an AUC of 0.79 (corrected to 0.77). Adding a minimal clinical panel (age, sex, viral co-infection, pre-T0 steroids) changed AUC trivially (Admission 0.78 vs 0.79; Landmark 0.84 vs 0.84; NP 0.79 vs 0.78), aligning with literature that cytokines (IL-6, CXCL10/IP-10, IL-10) carry the most discriminative signal in pediatric CAP/MPP. That decision curve net benefit, not tiny AUC deltas, should guide adoption.[19-23] We report calibration in the large alongside slope and provide simple risk strata (<10%, 10–<20%, 20–<30%, ≥30%) to support local thresholding and safety monitoring.[16,19]
We outline a research phase, adjunctive protocol using T0 (≤24 h) and T1 (day 3–5) cytokines with center-calibrated operating points (defaults <10% low, ≥20% high within a 5–40% decision curve range) and a pragmatic Δ trigger ≥ +1.0 log2: de-prioritize CT when risk is low, and Δ is stable or declining. Escalate imaging/consultation when risk is high, or Δ rises, always under clinician override.[18,19] Because CT is clinician-directed, NP findings depend on scanning and are likely to reflect unmeasured drivers (clinical trajectory, oxygen need/SaO2, auscultation/respiratory distress, worsening or large lesion CXR, pleural concern, prior consults, operational constraints).[18,24] To preserve chronological order, ΔIL 6 was analyzed only when T1 preceded the first CT. Later windows were non-random, so T2/T3 summaries are descriptive. Safeguards — single-thaw multiplex pre-analytics, Firth penalization for small NP events, 0.632+ optimism correction, and TRIPOD-aligned reporting — support internal validity while keeping Δ effects associative.[16,25-27]
Immune maturation suggests IL-6 may be less specific in infants (<3 y), whereas CXCL10/IP-10 may provide a more stable signal in school-age children (≥3 y). Accordingly, we recommend age-aware calibration of the same 10%/20% operating points and focusing Δ-based triggers at day 3–5.[11,22,23] Therapeutics can modulate cytokines, macrolides are immunomodulatory, and IVIG can lower inflammatory mediators, so Δ associations remain prognostic. Global macrolide resistance in Mycoplasma pneumoniae argues for thoughtful escalation within an adjunctive strategy.[28,29] Feasibility depends on platform and logistics: on-site Luminex/multiplex with daily batching can deliver same-day/next-day turnaround, whereas send-out testing often exceeds 24 h. A limited panel (IL 6, IP 10 ± IL 10) with verified LoD/LoQ and inter-assay CV ≤15–20% can lower barriers to adoption.[25] Generalizability remains restricted: NP results transport only to scanned children, and overall performance depends on center-specific CT thresholds and workflows. Therefore, external, multi site validation with local calibration is required before broader use.[16-18]
This single-center, retrospective study is susceptible to design and data constraints that temper inference. NP was evaluated only among children who underwent CT, introducing spectrum and selection considerations. Δ cytokine models apply only to children who are event-free at T1, and later windows were non-random because of discharge timing and outpatient follow-up. The residual sample design contributed to missingness, and unmeasured confounding may persist. We mitigated risks using Firth penalization, optimism correction, inverse probability weighting for scanning, steroid change controls, and TRIPOD-aligned transparent reporting, but these safeguards do not substitute for external validation.
Next steps are external, multi-site validation with center-specific calibration of operating points, including age-aware thresholds (<3 y vs ≥3 y) and deployment of a limited IL-6 6/IP IP-10 (± IL-10) panel. We propose a prospective pathway evaluation with safety monitoring and an impact study on CT utilization, clinical outcomes, and workflow. In the interim, our findings support the pragmatic, adjunctive use of T0/T1 cytokines to inform early triage and targeted imaging, while keeping NP inferences conditional on being scanned.
Ethics approval and consent to participate
This study was conducted in accordance with the Declaration of Helsinki. The protocol was reviewed and approved by the Ethics Committee of Huizhou Zhongda Huiya Hospital, which waived the requirement for informed consent because this was a retrospective analysis of de-identified routinely collected data and posed no more than minimal risk to participants. All data were anonymized prior to analysis.Data availability statement
Data sets generated during the current study are available from the corresponding author on reasonable request.Author Contribution Statement
The authors confirm contribution to the paper as follows: study conception and design: H.Y.; data collection: H.Y., C.Z.; analysis and interpretation of results: H.Y., C.Z.; draft manuscript preparation: H.Y., C.Z. All authors reviewed the results and approved the final version of the manuscript.References
- Zhang, X., Sun, R., Jia, W., Li, P., & Song, C.
(2024). Clinical Characteristics of Lung Consolidation with Mycoplasma
pneumoniae Pneumonia and Risk Factors for Mycoplasma pneumoniae
Necrotizing Pneumonia in Children. Infectious Disease and Therapy,
1-15. https://doi.org/10.1007/s40121-023-00914-x PMid:38265626 PMCid:PMC10904708
- Wang,
L., Hu, Z., Jiang, J., & Jin, J. (2024). Serum inflammatory markers
in children with Mycoplasma pneumoniae pneumonia and their predictive
value for mycoplasma severity. World Journal of Clinical Cases, 12(22),
4940-4946. https://doi.org/10.12998/wjcc.v12.i22.4940 PMid:39109035 PMCid:PMC11238786
- Zhang,
Y. X., Li, Y., Wang, Y., Ren, Y. F., Yang, Y., Qi, J., Yang, H., Liang,
X., & Zhang, R. F. (2024). Prospective cohort study on the clinical
significance of interferon-γ, D-dimer, LDH, and CRP tests in children
with severe mycoplasma pneumonia. Medicine, 103(41), e39665. https://doi.org/10.1097/MD.0000000000039665 PMid:39465799 PMCid:PMC11479529
- Zhou,
Y., Hu, M., Ye, B., Chen, Z., & Zhang, Y. (2020). Early prediction
of necrotizing pneumonia from mycoplasma pneumoniae pneumonia with
large pulmonary lesions in children. Scientific Reports, 10(1), 19061. https://doi.org/10.1038/s41598-020-76083-5 PMid:33149220 PMCid:PMC7643079
- Yang,
M., Meng, F., Wang, K., Gao, M., Lu, R., Li, M., Zhao, F., Huang, L.,
Zhang, Y., Cheng, G., Cheng, G., & Wang, X. (2017). Interleukin 17A
as a good predictor of the severity of Mycoplasma pneumoniae pneumonia
in children. Scientific Reports, 7(1), 12934. https://doi.org/10.1038/s41598-017-13292-5 PMid:29021577 PMCid:PMC5636901
- Luo,
X. qin, Luo, J., Wang, C. jie, Luo, Z., Tian, D., & Xie, X. hong.
(2023). Clinical features of severe Mycoplasma pneumoniae pneumonia
with pulmonary complications in childhood: A retrospective study.
Pediatric Pulmonology, 58(10), 2815-2822. https://doi.org/10.1002/ppul.26593 PMid:37431970
- Li,
M., Wei, X., Zhang, S.-S., Li, S., Chen, S.-H., Shi, S.-J., Zhou,
S.-H., Sun, D.-Q., Zhao, Q., & Xu, Y. (2023). Recognition of
refractory Mycoplasma pneumoniae pneumonia among Myocoplasma pneumoniae
pneumonia in hospitalized children: development and validation of a
predictive nomogram model. BMC Pulmonary Medicine, 23. https://doi.org/10.1186/s12890-023-02684-1 PMid:37817172 PMCid:PMC10566172
- Li,
L., Guo, R., Zou, Y., Wang, X., Wang, Y., Zhang, S., Wang, H., Jin, X.,
& Zhang, N. (2024). Construction and Validation of a Nomogram Model
to Predict the Severity of Mycoplasma pneumoniae Pneumonia in Children.
Journal of Inflammation Research, 17, 1183-1191. https://doi.org/10.2147/JIR.S447569 PMid:38410419 PMCid:PMC10895981
- Zhang,
Y. Y., Dai, L. M., Zhou, Y. L., Yang, D. H., Tang, L. F., & Chen,
Z. M. (2019). Zhonghua er ke za zhi = Chinese journal of pediatrics,
57(8), 625-630.
- Chen,
Q., Hu, T., Wu, L., & Chen, L. (2024). Clinical Features and
Biomarkers for Early Prediction of Refractory Mycoplasma Pneumoniae
Pneumonia in Children. Emergency medicine international, 2024, 9328177.
https://doi.org/10.1155/2024/9328177 PMid:38222094 PMCid:PMC10787049
- Li,
M., Chen, Y., Li, H., Yang, D., Zhou, Y., Chen, Z., & Zhang, Y.
(2021). Serum CXCL10/IP-10 may be a potential biomarker for severe
Mycoplasma pneumoniae pneumonia in children. BMC infectious diseases,
21(1), 909. https://doi.org/10.1186/s12879-021-06632-4 PMid:34481469 PMCid:PMC8418284
- Wang,
L. P., Hu, Z. H., Jiang, J. S., & Jin, J. (2024). Serum
inflammatory markers in children with Mycoplasma pneumoniae pneumonia
and their predictive value for mycoplasma severity. World journal of
clinical cases, 12(22), 4940-4946. https://doi.org/10.12998/wjcc.v12.i22.4940 PMid:39109035 PMCid:PMC11238786
- World
Health Organization Vaccine Trials Investigators' Group. (2001).
Standardization of interpretation of chest radiographs for the
diagnosis of pneumonia in children (WHO/V&B/01.35). Geneva: World
Health Organization. Retrieved from https://who-cres.mcri.edu.au/media/1315/who-vaccine-trials-group-cxr-stand-doc.pdf
- Zhou,
Y., Hu, M., Ye, B., Chen, Z., & Zhang, Y. (2020). Early prediction
of necrotizing pneumonia from mycoplasma pneumoniae pneumonia with
large pulmonary lesions in children. Scientific reports, 10(1), 19061. https://doi.org/10.1038/s41598-020-76083-5 PMid:33149220 PMCid:PMC7643079
- Ardila,
S. M., Weeks, H. M., Dahmer, M. K., Kaciroti, N., Quasney, M., Sapru,
A., Curley, M. A. Q., Flori, H. R., & Biomarkers in Children with
Acute Lung Injury (BALI) and Randomized Evaluation for Sedation
Titration for Respiratory Failure (RESTORE) Study Investigators and
Pediatric Acute Lung Injury and Sepsis Investigators (PALISI) Network
(2023). A Targeted Analysis of Serial Cytokine Measures and
Nonpulmonary Organ System Failure in Children With Acute Respiratory
Failure: Individual Measures and Trajectories Over Time. Pediatric
critical care medicine: a journal of the Society of Critical Care
Medicine and the World Federation of Pediatric Intensive and Critical
Care Societies, 24(9), 727-737. https://doi.org/10.1097/PCC.0000000000003286 PMid:37195096 PMCid:PMC10524322
- Collins,
G. S., Reitsma, J. B., Altman, D. G., & Moons, K. G. (2015).
Transparent reporting of a multivariable prediction model for
individual prognosis or diagnosis (TRIPOD): the TRIPOD statement. BMJ
(Clinical research ed.), 350, g7594. https://doi.org/10.1161/CIRCULATIONAHA.114.014508 PMCid:PMC4297220
- World
Health Organization Vaccine Trials Investigators' Group.
Standardization of interpretation of chest radiographs for the
diagnosis of pneumonia in children. 2001. https://who-cres.mcri.edu.au/media/1315/who-vaccine-trials-group-cxr-stand-doc.pdf
- American College of Radiology. ACR Appropriateness Criteria®: Pneumonia in the immunocompetent child. 2019. https://acsearch.acr.org/docs/3102387/Narrative/
- Vickers,
A. J., & Elkin, E. B. (2006). Decision curve analysis: a novel
method for evaluating prediction models. Medical decision making : an
international journal of the Society for Medical Decision Making,
26(6), 565-574. https://doi.org/10.1177/0272989X06295361 PMid:17099194 PMCid:PMC2577036
- Fernandes,
C. D., Arriaga, M. B., Costa, M. C. M., Costa, M. C. M., Costa, M. H.
M., Vinhaes, C. L., Silveira-Mattos, P. S., Fukutani, K. F., &
Andrade, B. B. (2019). Host Inflammatory Biomarkers of Disease Severity
in Pediatric Community-Acquired Pneumonia: A Systematic Review and
Meta-analysis. Open forum infectious diseases, 6(12), ofz520. https://doi.org/10.1093/ofid/ofz520 PMid:31867405 PMCid:PMC6917028
- Yang,
M., Meng, F., Gao, M., Cheng, G., & Wang, X. (2019). Cytokine
signatures associate with disease severity in children with Mycoplasma
pneumoniae pneumonia. Scientific reports, 9(1), 17853. https://doi.org/10.1038/s41598-019-54313-9 PMid:31780733 PMCid:PMC6882793
- Ding,
S., Wang, X., Chen, W., Fang, Y., Liu, B., Liu, Y., Fei, G., &
Wang, L. (2016). Decreased Interleukin-10 Responses in Children with
Severe Mycoplasma pneumoniae Pneumonia. PloS one, 11(1), e0146397. https://doi.org/10.1371/journal.pone.0146397 PMid:26751073 PMCid:PMC4708986
- Li,
P., Liu, J., & Liu, J. (2022). Procalcitonin-guided antibiotic
therapy for pediatrics with infective disease: A updated meta-analyses
and trial sequential analysis. Frontiers in cellular and infection
microbiology, 12, 915463. https://doi.org/10.3389/fcimb.2022.915463 PMid:36211950 PMCid:PMC9532766
- Chen,
Y., Li, L., Wang, C., Zhang, Y., & Zhou, Y. (2023). Necrotizing
Pneumonia in Children: Early Recognition and Management. Journal of
clinical medicine, 12(6), 2256. https://doi.org/10.3390/jcm12062256 PMid:36983257 PMCid:PMC10051935
- de
Jager, W., Bourcier, K., Rijkers, G. T., Prakken, B. J., &
Seyfert-Margolis, V. (2009). Prerequisites for cytokine measurements in
clinical trials with multiplex immunoassays. BMC immunology, 10, 52. https://doi.org/10.1186/1471-2172-10-52 PMid:19785746 PMCid:PMC2761376
- Firth, D. (1993). Bias reduction of maximum likelihood estimates. Biometrika, 80(1), 27-38. https://doi.org/10.1093/biomet/80.1.27
- Efron,
B., & Tibshirani, R. (1997). Improvements on cross-validation: The
.632+ bootstrap method. Journal of the American Statistical
Association, 92(438), 548-560. https://doi.org/10.1080/01621459.1997.10474007
- Kim,
K., Jung, S., Kim, M., Park, S., Yang, H. J., & Lee, E. (2022).
Global Trends in the Proportion of Macrolide-Resistant Mycoplasma
pneumoniae Infections: A Systematic Review and Meta-analysis. JAMA
network open, 5(7), e2220949. https://doi.org/10.1001/jamanetworkopen.2022.20949 PMid:35816304 PMCid:PMC9274321
- Centers for Disease Control and Prevention. (2024). Clinical care of Mycoplasma pneumoniae infection. U.S. Department of Health & Human Services. https://www.cdc.gov/mycoplasma/hcp/clinical-care/index.html
Supplementary Files
 |
Supplementary Table S1. Sampling attrition and baseline comparability at follow up time points. |
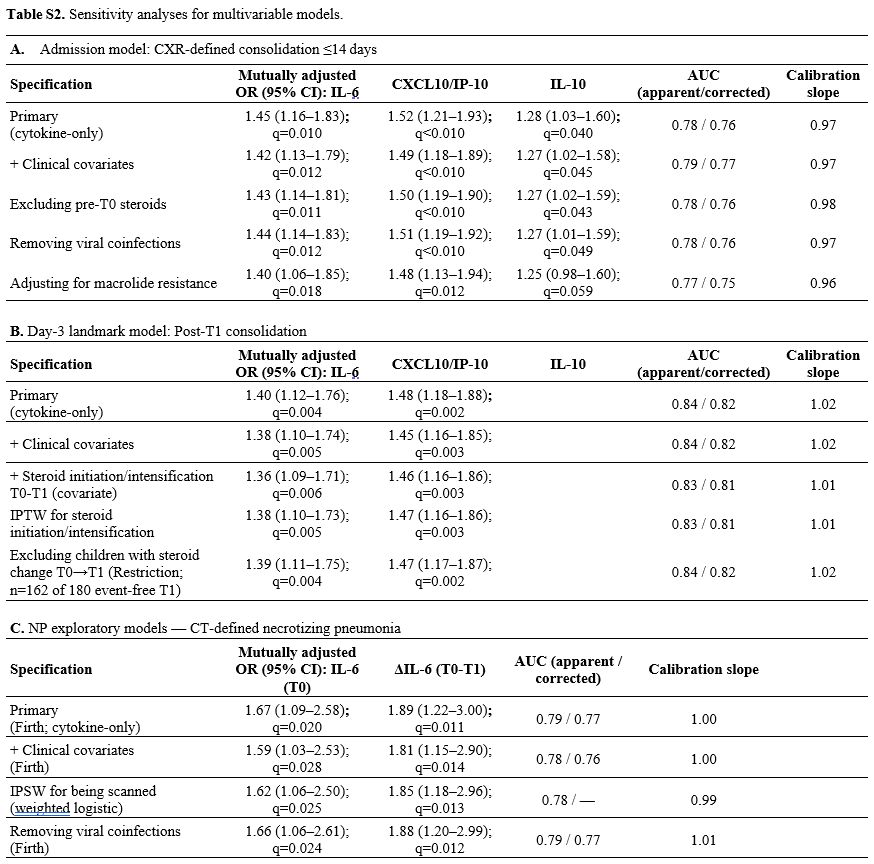 |
Supplementary Table S2. Sensitivity analyses for multivariable models. |
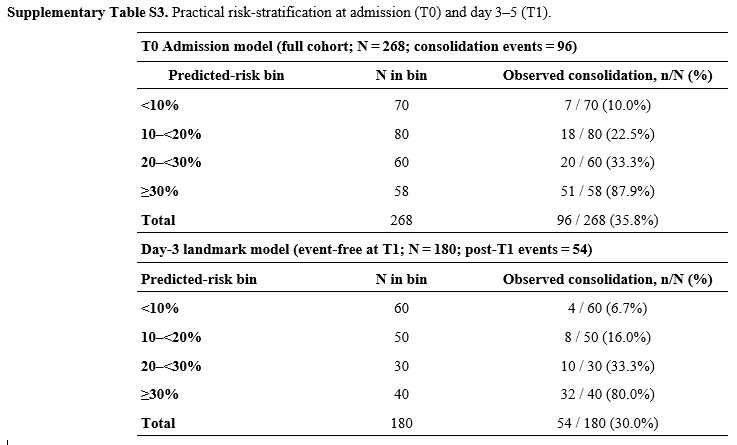 |
Supplementary Table S3. Practical risk stratification at admission (T0) and day 3–5 (T1). |