Current standards of care for β-TDT patients recommend an annual 2-h oral glucose tolerance test (OGTT) starting at age 10 (or earlier if the patient has severe iron overload).[2] Recommendations do not include simultaneous measurement of insulin response during OGTT, while glycated hemoglobin (HbA1c) is considered an unreliable biomarker for long-term glucose control in β-TDT.[2]
The diagnostic criteria for DM of the American Diabetes Association (ADA) are based on fasting plasma glucose (FPG) ≥ 126 mg/dL or 2-h PG:≥ 200 mg/dL, after glucose load, or random venous plasma glucose (PG)≥ 200 mg/dL associated with clinical symptoms of hyperglycemia or hyperglycemic crisis, and/or HbA1c≥ 6.5%.[3]
To the best of our knowledge, no studies have evaluated the diagnostic accuracy of FPG ≥ 126 mg/dL in patients with β-TDT. Thus, the ICET-A promoted a multicenter survey to establish: (a) the concordance rate of criteria used to diagnose diabetes between FPG and 2-hour PG post OGTT, and (b) to evaluate the optimal cutoff value of FPG to establish confirmation of DM diagnosis.
Patients and Methods
We retrospectively selected 71 β-TDT patients with FPG ≥ 126 mg/dL, who were followed at three Thalassemia centers (Iran, Italy, and Oman) and underwent annual or biannual 2-h OGTTs over the last 30 years. The main exclusion criteria included: (a) non-transfusion-dependent thalassemia (NTDT); b) bone marrow transplanted patients; (c) pregnancy; (d) patients on treatment with medications influencing glucose metabolism; (e) patients with incomplete data, and (f) positive history of recent surgery, or illness, or current use of oral hypoglycemic agents. Data collected at OGTT screening included: age, gender, anthropometric measurements [standing height, weight and body mass index (BMI), according to Center for Disease Control and Prevention],[4] and patients’ medical data (age at first transfusion, age of splenectomy, type and dose of chelating drugs, family history of diabetes, relevant biochemical and hematological parameters). Serum alanine aminotransferase (ALT) was measured by an automated analyzer (normal range 0–40 mU/L), and active HCV infection was determined by a qualitative HCV-RNA assay according to the manufacturer's instructions. Iron overload (IOL) was assessed by serum ferritin (SF) in μg/L. IOL was arbitrarily classified as mild (SF:< 800 µg/L),moderate (SF: ≥ 800 µg/L and < 1,500 µg/L), high (SF: ≥ 1,500 µg/L and < 3,000 µg/L), and severe (SF: ≥ 3,000 µg/L).OGTT was performed after a 10-h fast using 75 g dextrose monohydrate, and results were evaluated according to the current ADA criteria. Plasma glucose (PG) concentrations were measured by an automated glucose oxidase reaction. Data on insulin secretion, sensitivity, and resistance were available for 27 patients followed at a single Center (Ferrara). Serum insulin concentrations were assessed by a commercial immunoassay technique (Diagnostic Products Corporation, Los Angeles, CA) at 0', 30', 60', and 120' minutes after OGTT. The following surrogate indices were calculated: homeostasis model assessment (HOMA-IR), insulinogenic index (IGI), Matsuda Whole Body Insulin Sensitivity Index (Matsuda Index), and oral disposition index (oDI). The oral disposition index (oDI) was determined as the product of the Matsuda index and the IGI obtained during the OGTT.[5]
Statistical analysis was conducted using STATA (v12.1, College Station, TX). Numeric variables are expressed as mean ± standard deviation (SD) and 95% confidence intervals (CI). The Kolmogorov-Smirnov test was used to verify the normality of the distributions of the variables. Normally distributed continuous variables were compared using a one-way analysis of variance (ANOVA). and non-normally distributed variables were calculated using the Kruskal-Wallis test. Relationships between variables were assessed using Pearson's linear correlation for normally distributed variables and Spearman's Rank Correlation for non-normally distributed quantitative variables. According to Swinscow, the correlation coefficient was considered as follows: <0.4 as weak, from 0.4 to 0.59 as moderate, from 0.6 to 0.79 as strong, and ≥ 0.8 as very strong.[6] The categorical data were analyzed using the chi-square (χ2) test. Furthermore, time-dependent receiver operating characteristic (ROC) curve analyses and respective areas under the curve. Multiple linear regression analyses were employed to evaluate the relationship between the dependent variable, 2-h PG after OGTT, and potential associated risk factors: age, gender, BMI, pre-transfusion hemoglobin level, oral iron chelating agents, SF, history of splenectomy, and positive family history for T1 DM and T2 DM. Other variables were not assessed because the major risk factors for dysglycemia currently reported in the literature include older age, high BMI, elevated SF levels, chronic liver disease, and history of splenectomy.[1,2,7] A p-value <0.05 was considered statistically significant.
Ethics. All patients provided informed consent in accordance with principles of the Declaration of Helsinki. Patients underwent only routine diagnostic procedures in accordance with international recommendations for the diagnosis and management of dysglycemia in β-TDT patients.[2] The study was approved by the local institutional review boards or was waived in accordance with the local legislation and institutional requirements.
Results
The cohort included 71 β-TDT patients (34 males and 37 females), with a mean age of 25.6 ± 10.5 years (range: 13– 59.7 years). Of these, 19/71 patients (26.7%) were under 18 years of age. 60/71 patients were of normal weight (84.5%), 3/71 (4.2%) were underweight, and 8/71 (11.2%) were overweight or obese.Genotypic data were available for 49 patients, with the majority (39/49; 79.5%) being homozygous for β⁰-thalassemia and 10 patients (20.4%) having a compound heterozygous β⁰/β⁺genotype. The mean annual pre-transfusion Hb level was 9.2 ± 0.38 (range: 8-10.2 g/dL; median: 9.1 g/dL).
A positive family history for type 1 or 2 DM was reported in 26/66 (39.3%) patients. A past history of splenectomy was reported in 46/71 (56.3%) patients with β-TDT. Mean and median ALT in 49/71 patients were 59.8 ± 44.3 and 49 IU/L, respectively. A positive HCV RNA history was reported in 19/49 (38.7%).
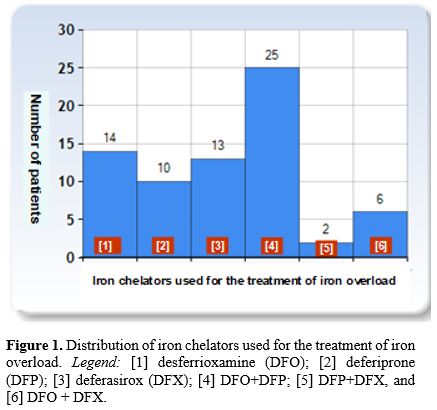
For IOL treatment, various iron chelators have been used over the last 3 decades. Over the years, different combinations have been developed to allow individualized therapy in β-TDT patients with poor adhesion to iron chelation therapy, persistent IOL, and/or organ damage. The most common treatment was the combination of desferrioxamine (DFO) plus deferiprone (DFP) (25/70 patients; 35.7%), followed by subcutaneous desferrioxamine (DFO: 14/70; 20.0%). One adolescent patient refused any iron chelation therapy (Figure 1).
 |
|
The mean value of SF was 3,492 ± 3,063 µg/L (95% CI 2,780–4,204). In 9/71 (12.6%) patients, the SF levels were < 800 µg/L, and in 37/71 (52.1%) patients, they were > 2,500 µg/L. A 14-year-old patient with Th-RDM refused ICT.
The mean FPG was 141.6 ± 16.5 mg/dL (95% 137.7–145.4). The mean 1-h PG, after glucose load, was 253.4 ± 73.1 (95% 236.3–270.4) and the mean 2-h PG, after glucose load, was 233.8 ± 67.0 mg/dL (95% 218.215–249.385). Among 71 β-TDT patients with FPG ≥ 126 mg/dL, 2-h PG ≥ 200 mg/dL was documented in 53 patients (74.6%), while PG 2-h after OGTT was 140-199 mg/dl in 12 patients (16.9 %) and < 140 mg/dl in 6 patients (8.5%).
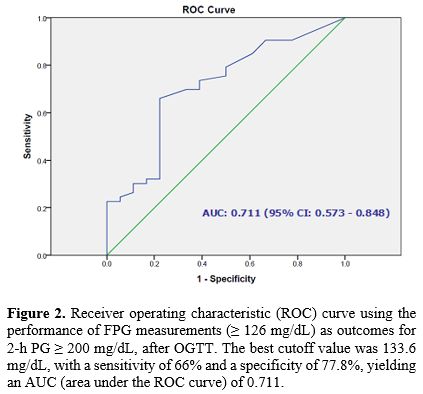
The ROC curve analysis showed that the optimal cutoff value for FPG ≥ 126 mg/dL to detect 2-h PG ≥ 200 mg/dL after OGTT was 133.6 mg/dL, with a sensitivity of 66% and specificity of 77.8% (Figure 2).
 |
|
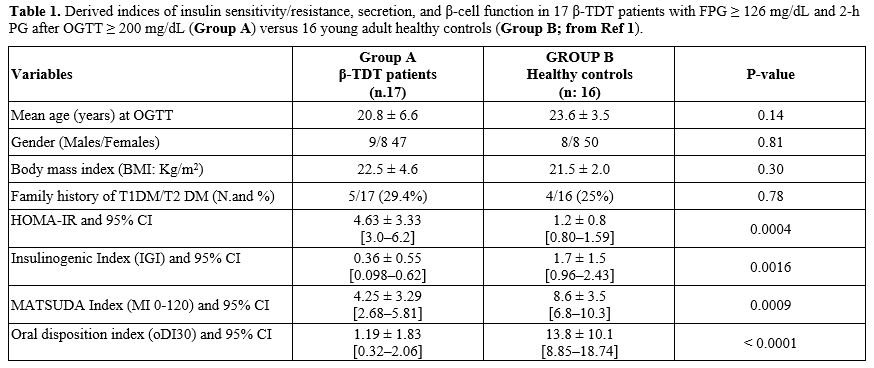
Data on insulin secretion, sensitivity, and resistance were available for 27 patients. The surrogate indices of insulin secretion and sensitivity/resistance in 17 β-TDT patients with FPG ≥ 126 mg/dL and 2-h PG after OGTT ≥ 200 mg/dL were compared to those in 16 young adult healthy controls (Table 1). The increased HOMA-IR index was associated with a significant defect in β-cell secretion (IGI) and a reduction in oDI, indicating insufficient compensation for IR and reflecting a decline in pancreatic β-cell function. In the remaining 10 patients, 6 had FPG ≥ 126 mg/dL and PG 2-h after OGTT between 140 -199 mg/dL, and 4 patients had FPG ≥ 126 mg/dL with PG 2-h after OGTT < 140 mg/dL; comparison with healthy controls was not performed due to the small numbers.
 |
|
A linear, significant but weak correlation was found between SF and 2-h PG after OGTT (r: 0.3909, P: 0.00089). A moderate correlation was documented between FPG and 2-h PG after OGTT (r: 0.4669; P: 0.000055), and between 30-min vs. 2-h PG after OGTT (47 patients; r: 0.429, P: 0.0036).
A strong correlation was observed between 1-h PG and 2-h PG after OGTT (48 patients; r = 0.7325, P < 0.00001). Moreover, the combination of FPG ≥ 126 mg/dL and 1-h PG 253.5 mg/dL (1st quartile) was associated with 2-h PG > 200 mg/dL in 44/48 (91,6%) β-TDT patients.
The multivariate linear regression model confirmed an association between 2-h PG after OGTT and SF level (t-stat: 2.4798; P: 0.015), but not with the other investigated variables.
Conclusions
Pancreatic IOL in β-TDT patients generally begins after the first decade of life and increases with age. The incidence of dysglycemia is primarily driven by chronic IOL from frequent blood transfusions, through reactive oxygen species (ROS)- mediated impairment of insulin synthesis, secretion, and apoptosis, contributing to the development of Th-RDM.[8]A significant correlation was found between SF and 2-h PG after OGTT (r: 0.3909, P: 0.00089). In 9/71 (12.6%) patients, the SF levels were <800 µg/L, and in 37/71 (52.1%) patients,> 2,500 µg/L (95% CI: 2,780–4,204). A high risk of Th-RDM has been reported in the UK, using a univariate analysis, in β-TDT patients with persistently elevated SF levels (an average 10-year SF level >1,500 µg/L) compared to those with lower average SF levels.[9] In addition to IOL, other risk factors for developing dysglycemia in β-TDT patients include: severity of genotype and clinical phenotype, advanced age at onset of chelation therapy, poor compliance with chelation therapy, chronic liver disease, overweight/obesity, and history of splenectomy. Additional risk factors include associated endocrine complications, zinc deficiency, pancreatic fatty replacement, low insulin-like growth factor-1 (IGF-1), and reduced physical activity.[1,2,6,8]
The present study has important implications for clinical practice: the use of high FPG as a single screening test is not sufficiently discriminative for diagnosing diabetes in patients with β-TDT. The ROC analysis showed that the best cutoff value of FPG for detecting 2-h PG ≥ 200 mg/dL after OGTT was 133.6 mg/dL, with a sensitivity of 66% and specificity of 77.8%. Nonetheless, even with this cutoff, 15/29 β-TDT patients (51.7%) had 2-h PG < 200 mg/dL.
The reported sensitivity of FPG ≥126 mg/dL to detect 2-h OGTT diagnosed diabetes was 44.7% in Japanese subjects,[10] 70.1% in UK,[11] and 41% in US subjects.[12] Basically, the strength of association between FPG and 2-h PG is highly variable and depends on various factors.[10-12] Reproducibility and accuracy of PG levels may be influenced by pre-analytical, analytical, and post-analytical issues. The pre-analytical phase is the most important and requires standardized procedures to minimize variability and bias, both in the analytical methods used and in biological variability.[13,14]
For the foregoing reasons, clinicians should be prudent when two different tests are used, and the results of FPG ≥ 126 mg/dL versus 2-h PG post-glucose load are discordant. In practice, healthcare professionals might decide to closely follow patients at risk and consider a second OGTT, as recommended by the ADA.[3] The long-term follow-up in 10 β-TDT patients with discordance between FPG and 2-PG levels documented the development of diabetes in 7/10 patients, after 4.5 ± 2.9 years (range: 1-10 years), and an isolated impaired fasting glucose in 3 patients, after 1, 4, and 7 years.
Several studies across different ethnic groups have shown that intermediate glucose values at 1 h post-glucose load predict an increased risk of incident T2DM.[15] In the present study, the combination of FPG ≥ 126 mg/dL and 1-h PG 253.5 mg/dL (1st quartile) was strongly associated with 2-h PG:≥ 200 mg/dL. Additional studies are needed to expand our understanding of the role of elevated 1-h PG in patients with dysglycemia and to evaluate whether shortening the OGTT from 2-h to 1-h would be more practical, acceptable, and effective in clinical practice.[15-18]
The major limitations in this study were evaluated. First, the small number of patients included in the retrospective survey. Second, there is a need to obtain further evidence on the diagnostic accuracy of FPG and to establish the optimal cutoff for maximum diagnostic accuracy, the concentration in large numbers of patients with β-TDT in different countries. Third, although a single FPG measurement is acceptable for epidemiological studies, its day-to-day variability can lead to misclassification of glucose tolerance.[19] The day-to-day intraindividual coefficients of variation range from 6.4 to 11.4% for FPG and 14.3 to 16.7% for 2-h PG during OGTT.[13,14] Finally, our study did not perform direct clamp measurements of insulin sensitivity and secretion; these were assessed using surrogate indices: HOMA-IR, IGI, MI (0-120), and oDI.
Despite these limitations, this study provides, for the first time, valuable insights into the diagnostic accuracy of elevated FPG for screening dysglycemia in β-TDT patients. The concordance rate between elevated FPG and 2-h PG was high at 74.6%, but it also highlighted disagreement between the two values in 25% of our patients with β-TDT. Substantially, it indicates that the risk of diabetes increases with the degree of fasting hyperglycemia, underlining the importance of long-term follow-up in patients with discordant levels between FPG and 2-h PG post glucose load, and suggests that 1-h PG, like in the general population,[20] is a sensitive marker for detecting β-TDT patients at high risk for Th-RDM.
Author contributions
VDS conceived and designed the retrospective observational study, wrote the original draft. VDS, MF, and SD are the guarantors of the data integrity and take full responsibility for its content. VDS and IE performed formal analysis and data interpretation. SD and PT played a pivotal role in shaping the final paper version. MF, ATS, FS, and MK contributed to the intellectual content. All authors have accepted responsibility for the entire content of this scientific letter and approved its submission.Acknowledgements
We thank all the participants in the study. We are also indebted to our colleagues for their help in facilitating this study.References
- De Sanctis V, Soliman A, Tzoulis P, Daar S, Karimi
M, Yassin MA, Pozzobon G, Kattamis C. Clinical characteristics,
biochemical parameters, and insulin response to oral glucose tolerance
test (OGTT) in 25 transfusion-dependent β-thalassemia (TDT) patients
recently diagnosed with diabetes mellitus (DM). Acta Biomed. 2021;92
(6): e2021488. https://doi.org/10.23750/abm.v92i6.12366
- De
Sanctis V, Saki F, Karimi M, Faranoush M, Elhakim I, Soliman AT, Daar
S, Tzoulis P. Fasting plasma glucose levels within the high normal
range are associated with a significantly increased risk of future
dysglycemia in transfusion-dependent β thalassemia: A decade-long
multicenter retrospective analysis. Mediterr J Hematol Infect Dis.
2025, 17(1): e2025072. https://doi.org/10.4084/MJHID.2025.072 PMid:41235033 PMCid:PMC12611354
- American
Diabetes Association Professional Practice Committee; 2. Diagnosis and
Classification of Diabetes: Standards of Care in Diabetes-2025.
Diabetes Care. 2025;48 (Supplement 1): S27-S49. https://doi.org/10.2337/dc25-S002 PMid:39651986
- Center
for Disease Control and Prevention. Use and interpretation of the WHO
and CDC growth charts for children from birth to 20 years in the United
States 2014. Available online: https://www.cdc.gov/nccdphp/dnpa/growthcharts/resources/growthchart.pdf (accessed on 1 February 2023).
- De
SanctisV, SolimanAT, Daar S, Tzoulis P, Di Maio S, Kattamis C. Oral
glucose tolerance test: how to maximize its diagnostic value in
children and adolescents. Acta Biomed. 2022;93 (5): e2022318. https://doi.org/10.23750/abm.v93i5.13615
- Swinscow TDV. Statistics at square one. XVI-The chi squared 2 tests. BMJ.1976;2:573-574. https://doi.org/10.1136/bmj.2.6035.573 PMid:963437 PMCid:PMC1688097
- Evangelidis
P, Venou TM, Fani B, Vlachaki E, Gavriilaki E on behalf of the
International Hemoglobinopathy Research Network (INHERENT).
Endocrinopathies in Hemoglobinopathies: What Is the Role of Iron? Int J
Mol Sci. 2023;24:16263. https://doi.org/10.3390/ijms242216263 PMid:38003451 PMCid:PMC10671246
- De
Sanctis V, Soliman AT, Tzoulis P, Daar S, Fiscina B, KattamisC.
Pancreatic changes affecting glucose homeostasis in transfusion
dependent β-thalassemia (TDT): a short review. Acta Biomed. 2021;
92(3):e 20 21232. https://doi.org/doi:10.23750/abm.v92i3.11685
- Shah
F, Huey K, Deshpande S, Turner M, Chitnis M, Schiller E, Yucel A, Moro
Bueno L, Oliva EN. Relationship between serum ferritin and outcomes
inβ-thalassemia: A systematic literature review. J Clin
Med.2022;11:4448. https://doi.org/10.3390/jcm11154448 PMid:35956067 PMCid:PMC9369259
- Sato
Y, Ohfusa H, Katakura M, Komatsu M, Yamada S, Yamauchi K, Ichikawa K,
Aizawa T, Hashizume K. A problem with the diagnosis of diabetes
mellitus based on fasting plasma glucose. Diabet. Med.
2002;19(1):82-83. https://doi.org/10.1046/j.1464-5491.2002.676_4.x PMid:11869312
- Gatling
W, Begley JP. Diagnosing diabetes mellitus in clinical practice: is
fasting plasma glucose a good initial test? Practical Diabetes Int.
2001;18(3); 89-93. https://doi.org/10.1002/pdi.127
- Huang
J, Ou HY, Karnchanasorn R, Samoa R, Chuang LM, Chiu KC, Feng W.
Clinical implication of fasting and post-challenged plasma glucose in
diagnosis of diabetes mellitus. Endocrine. 2015;48 (2): 511-518. https://doi.org/10.1007/s12020-014-0301-3 PMid:24895042
- Ricós
C, Alvarez V, Cava F, García-Lario JV, Hernández A, Jiménez CV,
Minchinela J, Perich C, Simón M. Current databases on biological
variation: pros, cons and progress. Scand J Clin Lab Invest. 1999;59
(7): 491-500. https://doi.org/10.1080/00365519950185229 PMid:10667686
- McDonald GW, Fisker GF, Burnham C. Reproducibility of the oral glucose tolerance test. Diabetes.1965;14:473-480. https://doi.org/10.2337/diab.14.8.473 PMid:14334838
- Bergman
M, Buysschaert M, Ceriello A, Hussain A, Mohan V, Sesti G, Tuomilehto
J. Current diagnostic criteria identify risk for type 2 diabetes too
late. Lancet Diabetes Endocrinol. 2023;11(4): 224-226. https://doi.org/10.1016/S2213-8587(23)00039-6 PMid:36803366
- Ahuja
V, Aronen P, Pramodkumar TA, Looker H, Chetrit A, Bloigu AH,
Juutilainen A, Bianchi C, La Sala L, Anjana RM, Pradeepa R, Venkatesan
U, Jebarani S, Baskar V, Fiorentino TV, Timpel P, DeFronzo RA, Ceriello
A, Del Prato S, Abdul-Ghani M, Keinänen-Kiukaanniemi S, Dankner R,
Bennett PH, Knowler WC, Schwarz P, Sesti G, Oka R, Mohan V, Groop L,
Tuomilehto J, Ripatti S, Bergman M, Tuomi T. Accuracy of 1-hour plasma
glucose during the oral glucose tolerance test in diagnosis of type 2
diabetes in adults: a meta-analysis. Diabetes Care.
2021;44(4):1062-1068. https://doi.org/10.2337/dc20-1688 PMid:33741697 PMCid:PMC8578930
- De
Sanctis V, Soliman AT, Tzoulis P, Daar S, Pozzonon GC, Kattamis C . A
study of isolated hyperglycemia (blood glucose ≥ 155 mg/dL) at 1-hour
of oral glucose tolerance test (OGTT) in patients with β-transfusion
dependent thalassemia (β-TDT) followed for 12 years. Acta Biomed.
2021;92 (4):e 2021322. https://doi.org/10.23750/abm.v92i4.11105
- De Sanctis V, Faranoush M, Vlachaki E, Venou TM, Soliman AT, Daar S, Tzoulis P, Kattamis C. Post-load plasma glucose increase (PG-gap) as a risk factor for developing dysglycemia in patients with transfusion-dependent β-thalassemia (β-TDT): Retrospective analysis over 8 years. Mediterr J Hematol Infect Dis. 2025;17(1): e2025069. https://doi.org/10.4084/MJHID.2025.069 PMid:41235026 PMCid:PMC12611359
- Ollerton
RL, Playle R, Ahmed K, Dunstan FD, Luzio SD, Owens DR. Day-to-day
variability of fasting plasma glucose in newly diagnosed type 2
diabetic subjects. Diabetes Care.1999;22(3):394-398 https://doi.org/10.2337/diacare.22.3.394 PMid:10097916
- Klein
KR, Walker CP, McFerren AL, Huffman H, Frohlich F, Buse JB.
Carbohydrate intake prior to oral glucose tolerance testing. J Endocr
Soc. 2021; 5 (5):1-7. https://doi.org/10.1210/jendso/bvab049 PMid:33928207 PMCid:PMC8059359