In conventional therapies, TDT patients require lifelong blood transfusion and iron chelation therapy, which brings many challenges and unmet needs.[6] As a result, new therapies and drugs for TDT are being continuously explored. In recent years, extensive basic and clinical research has shown that increasing γ-globin gene expression raises fetal hemoglobin (HbF) levels, thereby improving hemoglobin (Hb) levels in patients with β-thalassemia.[7-9] Therefore, CRISPR-Cas9 gene therapies to reactivate γ-globin have been developed.[10]
Thalidomide is a promising alternative therapy. It is an immunomodulatory drug and a potent inducer of HbF. Research indicates that thalidomide can increase γ-globin production in patients with β-thalassemia, reducing α-globin accumulation and improving the α/β imbalance, thereby raising HbF levels. Potential mechanisms include: (1) thalidomide induces γ-globin expression by increasing ROS-mediated p38 MAPK signaling and histone H4 acetylation in human CD34+ cells. (2) thalidomide enhances STAT5 expression and may suppress the extrinsic caspase activation pathway. This reduces caspase-mediated degradation of GATA-1 transcription factors, promoting cellular differentiation and ameliorating ineffective erythropoiesis.[11]
For TDT patients unable to undergo gene therapy or stem cell transplantation, thalidomide is an actual option. It offers a practical, cost-effective way to reduce transfusion requirements. However, the effects of thalidomide in TDT patients require comprehensive evaluation. This systematic review aims to synthesize existing evidence on the efficacy and safety of thalidomide in TDT patients to inform its clinical use. The protocol for this study has been registered in the International Prospective Register of Systematic Reviews (PROSPERO, CRD420251040839). Ethical approval is unnecessary because no people or animals are selected as subjects in this meta-analysis.
Methods
Information sources and search strategy. To assess the clinical efficacy and safety of thalidomide in patients with transfusion-dependent β-thalassemia (TDT), a systematic literature search was performed. The following electronic bibliographic databases were searched (up to January 24th, 2026): MEDLINE (PubMed), EMBASE (Ovid), CENTRAL (The Cochrane Library), Web of Science, China Biology Medicine (CBM, SinoMed), China National Knowledge Infrastructure (CNKI), VIP, and Wangfang data. An additional search of the gray literature was conducted on the same day using OpenGrey. Chinese and English search terms were both used. And Mesh terms were searched following words: “thalassemia”, “β-thalassemia”, “beta-thalassemia”, “Cooley's anemia”, “Mediterranean anemia”, “erythroblastic anemia”, and “thalidomide”. There was no restriction on age, country, race, gender, or year of publication. In addition, manual searches were made utilizing the reference lists of the original studies.Eligibility criteria.
Population: Patients who were diagnosed with TDT.
Intervention: Thalidomide alone treatment.
Control: Placebo or no.
Study type: Randomized controlled trials (RCTs) and observational studies.
Primary outcomes: Hemoglobin (Hb) level, fetal hemoglobin (HbF) level, serum ferritin (SF) level, liver iron concentration (LIC),major response rate (MRR), and overall response rate (ORR). Major response (MaR) was defined as transfusion independence (a 100% reduction in transfusion requirements). Minor response (MiR) was defined as ≥50% reduction of transfusion requirement. Major response rate (MRR) = number of MaR+ MiR/number of cases observed. Overall response rate (ORR) = number of MaR+ MiR/number of cases observed.
Secondary outcomes: The types and quantities of adverse drug events (ADEs)
Exclusion criteria.
- Population: Patients have other diseases that require blood transfusion or affect hemoglobin levels.
- Study type: (1) The sample size of included studies was less than 10 patients. (2) The follow-up period in the prospective study or the treatment duration of thalidomide in the retrospective study was less than 3 months. If the follow-up period (or treatment duration) in a study varies and includes patients with follow-up periods (or treatment durations) of ≥ 3 months and < 3 months, then patients with a follow-up period (or treatment duration) of < 3 months should be excluded.
- Others: (1) Case series and case reports. (2) Thesis. (3) The language was not Chinese or English. (4) Literature without access to the full text available.
Papers selection and data collection. Firstly, two researchers independently screened the results (titles and abstracts) of the literature search for potentially relevant studies. Secondly, we retrieved full reports of potentially relevant studies, and two researchers independently determined whether they met the predefined inclusion criteria. Two researchers resolved discrepancies through discussion and, on several occasions, consulted a third researcher. Further, we collected data from the included studies on a specially designed data collection form.
For multiple-arm studies, we included only the relevant arms that included thalidomide as part of the intervention in at least one group. For studies reporting outcomes at multiple follow-up time points, we collected the data from the final follow-up time point. Where necessary, we contacted the authors of included studies to obtain any data that needed further clarification or was not reported.
Study risk of bias assessment. Two researchers independently assessed the risk of bias in the included papers. Differences in the reviewers' decisions were resolved by consensus.
For RCTs, bias risk was assessed using version 2 of the Cochrane risk-of-bias tool for randomized trials (RoB 2).[12] Five domains are included in RoB 2 to cover all types of bias that are currently understood to affect the results of randomized trials. These are: bias arising from the randomization process, bias due to deviations from intended interventions, bias due to missing outcome data, bias in measurement of the outcome, and bias in selection of the reported result. After assessing the risk of bias across the 5 domains using the signaling questions, we determined the overall risk of bias in the trial by considering practical circumstances. The response options for the overall risk-of-bias judgment include “low risk of bias”, “some concerns,” and “high risk of bias”. We excluded high-risk-of-bias studies from quantitative analysis.
For observational studies, the Methodological Index for Non-Randomized Studies (MINORS) was applied to assess bias risk.[13] The MINORS tool includes 12 evaluation criteria. The first 8 criteria apply to studies without a control group (maximum score: 16); when the remaining 4 criteria are added, they apply to studies with a control group (maximum score: 24). Higher scores indicate better evidence quality. We exclude from the quantitative analysis studies without a control group that score below 6, and studies with a control group that score below 8.
Effect measures and synthesis methods. The methods of Wan et al.[14] and Hou et al.[15] were used to estimate the sample mean and SD from the sample size, median, range, and/or interquartile range. When studies report baseline outcomes and changes but not post-treatment outcomes, calculate the latter using subgroup merging.[16]
The meta-analysis was performed using STATA 18, and the effect indicators and 95% confidence intervals (95% CI) were calculated. The effect size for continuous outcomes was the mean difference (MD), while the risk ratio (RR) was used for binary outcomes. For RCTs with baseline imbalance, the change-from-baseline values rather than final post-treatment scores were used. The standardized mean change (SMC) was adopted as the effect size to synthesize mean differences across studies, with results reported as standardized mean differences (SMDs) with 95% confidence intervals (Hedge’s g method used). Forest maps were created for each outcome. Heterogeneity among studies was assessed using the I2 Index. When I2<50%, a fixed-effect model (inverse variance method) was applied; otherwise, the random-effects model (DerSimonian-Laird method) was applied. Statistical significance was defined as p < 0.05.
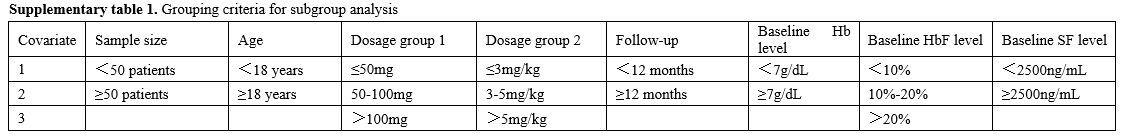
Where I² > 50%, meta-regression and subgroup analysis were conducted to identify the main sources of heterogeneity. Subgroup analysis was stratified by country. Meta-regression analysis was performed when more than 10 studies reported data for a given covariate, including sample size, age, dosage group 1, dosage group 2, follow-up, baseline Hb level, baseline HbF level, and baseline SF level. The dosage was categorized into group 1 and group 2 based on the different units. If fewer than 10 studies reported data for a covariate, subgroup analysis was performed instead. If fewer than 4 studies reported data for a covariate, subgroup analysis was not performed. Grouping criteria for subgroup analysis are presented in Supplementary Table 1. Leave-one-out analysis is used to confirm the stability of results.
Reporting bias and certainty assessment. Publication bias assessment was conducted for outcome measures reported in ≥10 studies. The Egger’s test and funnel plots were used to assess publication bias. The Egger’s test quantifies funnel plot asymmetry to provide a statistical test for bias.
The overall certainty of the effect estimates was assessed using the GRADE system (GRADEpro GDT online tool: https://gradepro.org/). The overall quality of the evidence was graded as high, moderate, low, or very low. The high certainty indicated that we were very confident the true effect was close to the estimated effect. The moderate certainty meant we were moderately confident the true effect was likely close to the estimate, though possibly substantially different. The low certainty meant our confidence in the effect estimate was limited, as the true effect might have differed substantially from it. The very low certainty meant we had very little confidence in the effect estimate, since the true effect was likely substantially different from it.
Results
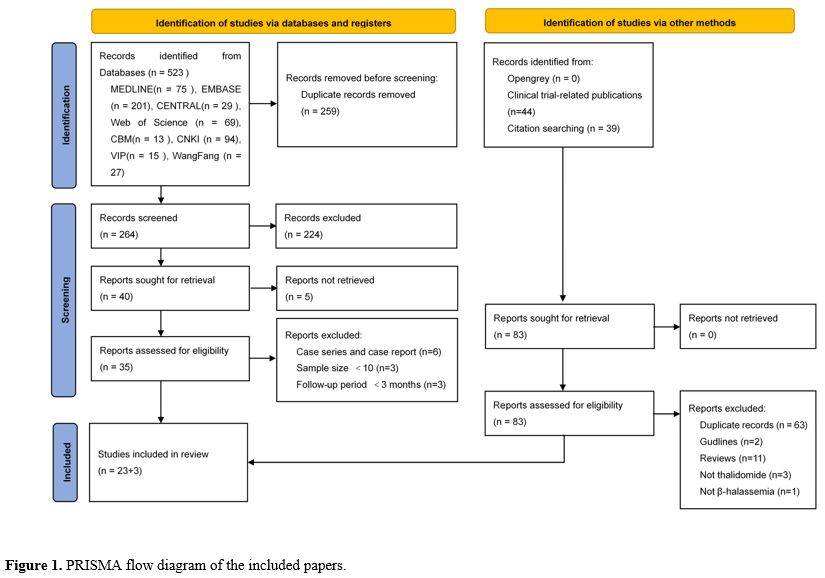
Results of search. The PRISMA flow diagram of the included papers is provided in Figure 1. 523 records were retrieved from the database, and 23 papers were included in our review.On the one hand, 12 clinical trials were excluded because they did not post results, but 4 of those trials were linked to 44 papers. On the other hand, 3 excluded systematic reviews linked to 39 papers. A total of 83 records were assessed for eligibility, and 3 papers were included in our review.
Finally, 26 papers were included via databases and other methods.[17-42]
 |
|
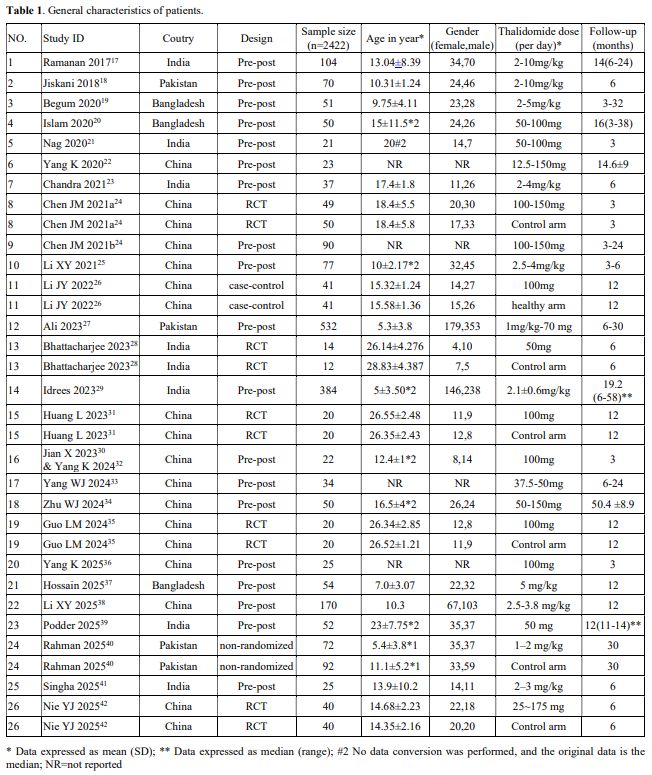
Properties of the included papers. Table 1 provides the general characteristics of patients in the included papers. In Chen JM 2021,[24] 99 patients were enrolled in a 3-month follow-up randomized controlled trial (RCT). Subsequently, 90 of these patients participated in a long-term extension trial (a single-arm pre-post trial). Therefore, we considered the initial RCT and the subsequent pre-post trial as two distinct studies, designated as Chen JM 2021a and Chen JM 2021b, respectively. The TDT patients in Jian X 2023[30] and Yang K 2024[32] were the same cohort, and each study reported different outcomes. Therefore, we combined Jian X 2023[30] and Yang K 2024[32] into a single named Jian X 2023 & Yang K 2024. Therefore, 26 studies (from 26 papers) were included for qualitative analysis.
 |
|
Among the 26 studies, there were 19 pre-post studies,[17-25,27,29,30,32-34,36-39,41] 5 RCTs,[24,28,1,35,42] 1 case-control study,[26] and 1 non-randomized clinical trial.[40] A total of 2422 patients were included. Some studies included both patients with TDT and NTDT, whereas our study only reported the baseline characteristics of TDT patients. Therefore, in some studies listed in Table 1, the age and gender of patients were marked as "NR". In the 5 RCTs, only the control group of Chen JM 2021a used a placebo, while the control groups in the other studies only received conventional blood transfusion treatment without additional interventions.
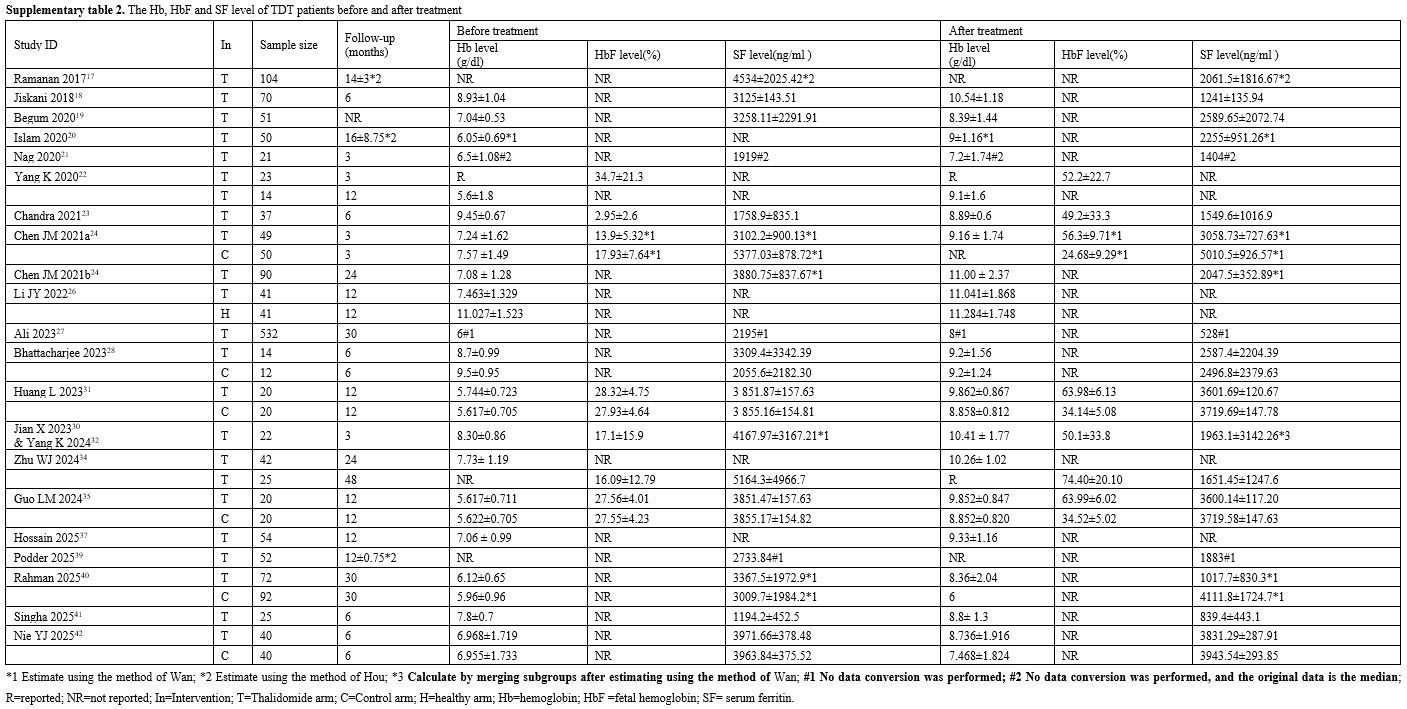
The Hb, HbF, and SF levels of TDT patients before and after treatment are shown in Supplementary Table 2. None of the studies reported the liver iron concentration. Two RCTs with baseline imbalance, the changes in Hb, HbF, and SF level from baseline to endpoint in five RCTs were shown in Supplementary Table 3. The responses of TDT patients to thalidomide in our study and included studies are shown in Supplementary Table 4. The responses of TDT patients to thalidomide were defined differently in each of the included studies. The response data included in our study were defined according to the specifications we had previously established. The response data in the included studies were also shown in Supplementary Table 4.
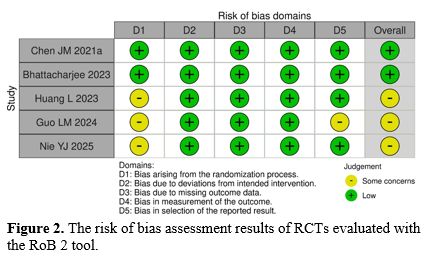
Study risk of bias assessment. Figure 2 presents the risk of bias assessment for the included RCTs,[24,28,31,35,42] evaluated using the ROB 2 tool. None of the studies had a high risk of bias. The risk of bias for Huang L 2023,[31] Guo LM 2024,[35] and Nie YJ 2025[42] in domain 1 was "some concerns". There was no clear information indicating whether the allocation sequence was concealed until the participants were enrolled and assigned to an intervention. And the risk of bias for Guo LM 2024[35] in domain 5 was "some concerns". This study didn’t provide any information about a pre-specified analysis plan that was finalized before unblinded outcome data were available for analysis. Thus, there was no information to confirm whether the data that produced these outcomes were analyzed in accordance with a pre-specified analysis plan.
 |
|
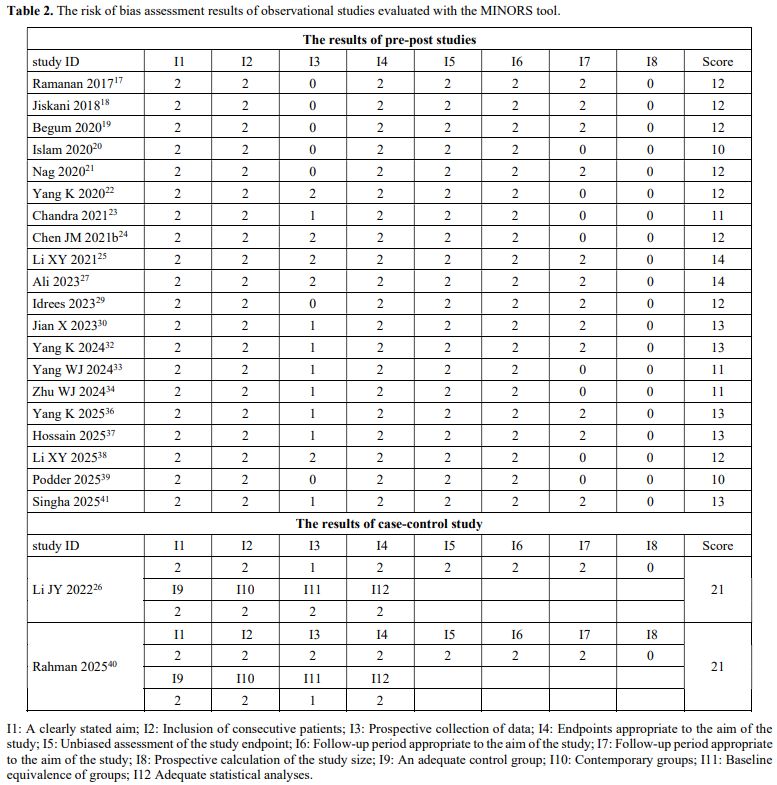
Table 2 presents the risk of bias assessment for the included observational studies,[17-27,29,30,32-34,36-41] evaluated using the MINORS tool. No studies were excluded due to low scores. At the same time, none of the studies conducted a prospective calculation of the study size. Although some studies had a protocol established before the beginning of the study, the unavailability of these protocols precluded comparison with the study results, resulting in Item 3 being awarded only 1 point for these studies. The differences in age and weight between the thalidomide group and non-thalidomide group were statistically significant; therefore, Item 11 was rated as 1 point in Rahman 2025.[40]
 |
|
The MRR and ORR to thalidomide
Meta-analysis results. The meta-analysis results of the MRR and ORR to thalidomide are shown in Figure 3.One RCT,[24] including 99 patients, reported MaR but didn’t report MiR. Therefore, the MRR and ORR from this trial were the same. The pooled MRR and ORR estimates are shown in Figure 3 a and c, respectively. Random-effect models were used for this meta-analysis. Compared with the control group, the thalidomide group had a significantly higher MRR and ORR (RR= 6.95, 95% CI: 2.96 – 16.27).
One non-randomized clinical trial[40] reported MaR in the thalidomide arm but not in the control arm, and did not report MiR. Therefore, this trial was not included in the meta-analysis. The reported MRR and ORR in this trial were the same, both 73.62%.
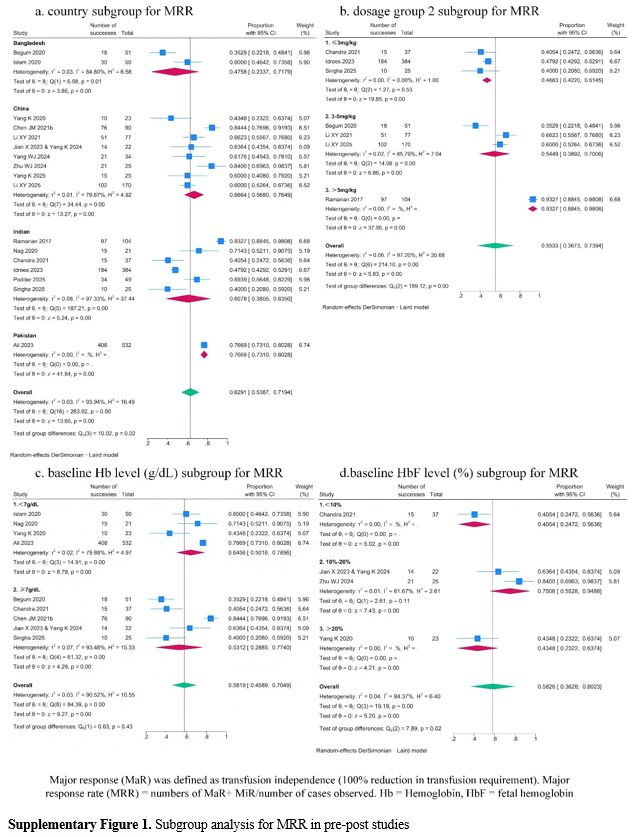
Seventeen pre-post studies, including 1719 patients, reported both MaR and MiR. The meta-analysis results for MRR and ORR are shown in Figure 3 b and d, respectively. For MRR, significant heterogeneity was observed (I2=93.94%), and a random-effects model was applied. The pooled MRR was 62.91% (95% CI: 53.87 - 71.94%). Similarly, for ORR, the high heterogeneity was found (I2=94.17%), and a random effects model resulted in a pooled ORR of 75.07% (95% CI: 66.82 - 88.33%).
 |
|
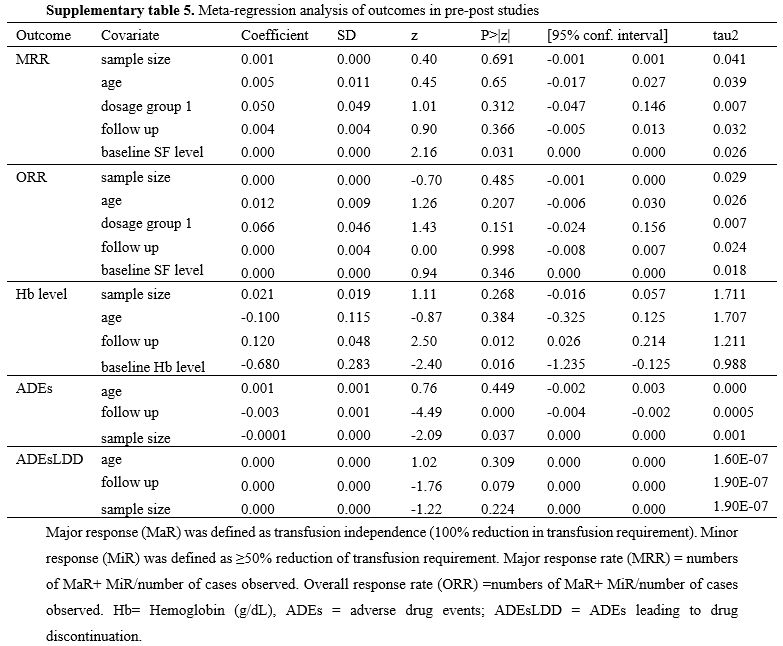
Meta-regression analysis results. Meta-regression analysis was not performed for the single RCT. For the 17 pre-post studies, the results of the meta-regression analysis are shown in Supplementary Table 5. Baseline SF level was significantly associated with MRR (p=0.031, coefficient=0.0001). After introducing “baseline SF level” in the model, the between-study variance component decreased from 0.0312 to 0.0257, explaining 17.63% of the heterogeneity. And meta-regression did not identify sources of heterogeneity in the ORR meta-analysis.
Subgroup analysis results. Subgroup analysis of pre-post studies showed potential effect of the country, dosage group 2, and baseline HbF level on MRR (p for subgroup differences were 0.02, 0.00, and 0.02, respectively; Supplementary Figure 1 a, b, and d). But considerable unexplained heterogeneity remained within some subgroups, indicating that these factors may also not be the main source of heterogeneity in the MRR meta-analysis.
Subgroup analysis of pre-post studies also showed potential effect of the country, dosage group 2 baseline Hb level, and baseline HbF level on ORR (p for subgroup differences were 0.02, 0.00, 0.04, and 0.00, respectively (Supplementary Figure 2 a-d). Considerable unexplained heterogeneity remained within the country, dosage group 2, and baseline Hb level subgroups, indicating that these factors may also not be the main source of heterogeneity in the ORR meta-analysis. In contrast, no heterogeneity was observed within the baseline HbF level subgroups, indicating that baseline HbF level may explain a portion of the overall heterogeneity in the ORR meta-analysis. Notably, the pooled ORR estimates increased progressively with higher baseline HbF level, suggesting a potential positive correlation between baseline HbF level and ORR.
Sensitivity analysis results. Leave-one-out analysis showed that the meta-analysis results for MRR and ORR in both pre-post studies were robust (Supplementary Table 6). After removing the largest pre–post study (Ali 2023),[27] the pooled MRR and ORR decreased from 62.91% (95% CI: 53.87% - 71.94%) to 61.78% (95% CI: 51.16% - 72.40%) and from 75.07% (95% CI: 66.82% - 83.33%) to 74.86% (95% CI: 65.12% - 84.60%), respectively. The greatest absolute difference in effect size was observed following the exclusion of Ramanan 2017,[17] with the pooled MRR decreasing from 62.91% (95% CI: 53.87% - 71.94%) to 60.86% (95% CI: 52.61% - 69.10%). For ORR, the greatest difference occurred after removing Begum 2020,[19] resulting in an increase from 75.07% (95% CI: 66.82% - 83.33%) to 77.52% (95% CI: 65.41% - 82.22%).
The changes in Hb level (g/dl)
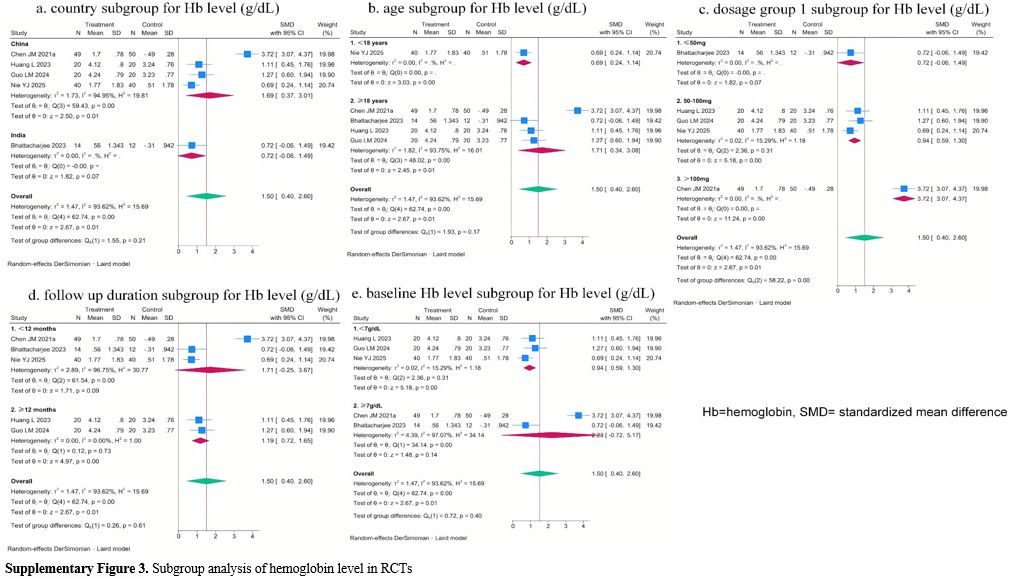
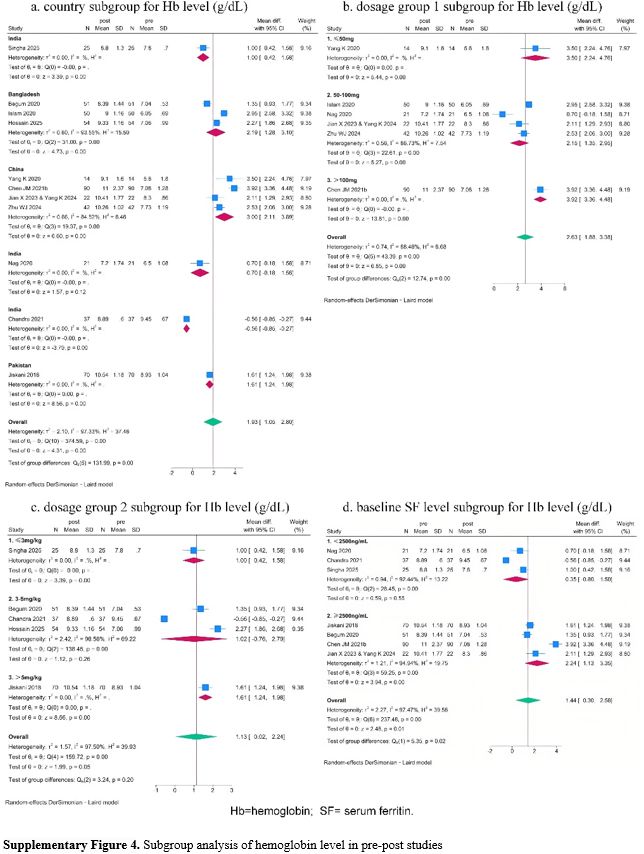
Meta-analysis results. The meta-analysis results of Hb level in RCTs and pre-post studies are shown in Figure 4. Five RCTs, including 285 patients, reported Hb level. A random-effects model was used for the meta-analysis (I2=93.62%). The pooled SMC was 1.50 (95% CI: 0.40 -2.60; p = 0.01), indicating a large beneficial effect of the thalidomide arm compared with the control arm for increasing Hb level (Figure 4. a). Twelve pre-post studies, including 1008 patients, reported Hb level. Significant heterogeneity was observed (I2=97.33%), and a random-effects model was applied. The meta-analysis indicated a significant increase in Hb level of 1.93 g/dL (95% CI:1.05 – 2.80 g/dL) following thalidomide treatment (Figure 4. b).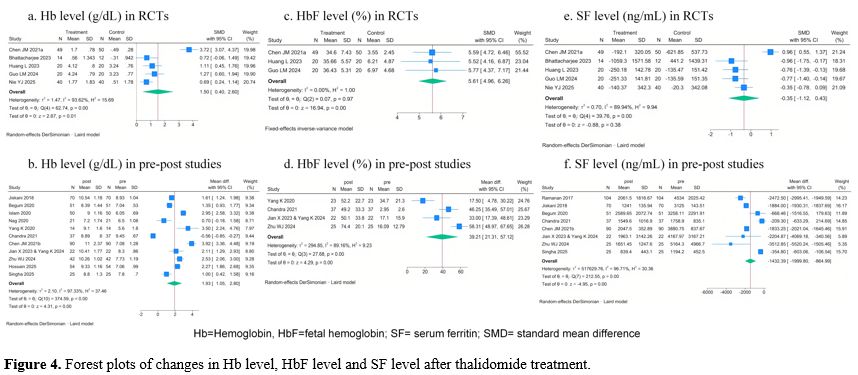 |
|
In one case-control study,[26] Hb levels in TDT patients increased from a mean value of 7.463±1.329 g/dL to 11.041±1.868 g/dL in the thalidomide arm, with no statistically significant difference in Hb levels observed between this arm and the healthy arm (p=0.545). And in one non-randomized clinical trial,[40] Hb level of patients in the thalidomide arm increased significantly from a mean value of 6.12 ± 0.65 g/dL to 8.36 ± 2.04 g/dL (p<0.0001), while the Hb level of patients in the non-thalidomide arm did not show a significant change (5.96 ± 0.96 g/dL to 6 g/dL).
Meta-regression analysis results. The results of the meta-regression analysis for the 12 pre-post studies are presented in Supplementary Table 5. Follow-up duration and baseline Hb level were significantly associated with changes in Hb level (follow-up duration: p=0.012, coefficient= 0.1200; baseline Hb level: p=0.016, coefficient=-0.6798). After introducing these two variables in the model, the between-study variance component decreased from 2.10 to 1.211 and 0.9876, explaining 43.33% and 52.97% of the heterogeneity, respectively.
• Subgroup analysis results
Subgroup analysis showed a potential effect of dosage group 1 on Hb level changes in RCTs (p for subgroup differences was 0.00, Supplementary Figure 3 c). No heterogeneity was observed within the thalidomide dosage group 1 subgroups, indicating that baseline thalidomide dosage group 1 may explain a portion of the overall heterogeneity in the Hb level change meta-analysis. Notably, the pooled SMC estimates increased progressively with higher thalidomide dosage, suggesting a potential positive correlation between thalidomide dosage and Hb level change.
Subgroup analysis of pre-post studies also indicated the potential effect of country, dosage group 1, and baseline SF level on Hb level changes (Supplementary Figure 4 a, b, d). But considerable unexplained heterogeneity remained within some subgroups, indicating that these factors may also not be the main source of heterogeneity in the meta-analysis.
• Sensitivity analysis results
Leave-one-out analysis showed that the meta-analysis results for Hb level changes in both RCTs and pre-post studies were robust (Supplementary Table 6). In pre-post studies, after removing the largest pre–post study (Chen JM 2021b[24]), the pooled Hb level change decreased from 1.93 g/dL (95% CI:1.05 – 2.80 g/dL) to 1.72 g/dL (95% CI:0.86 – 2.58 g/dL). Additionally, the greatest absolute difference in effect size was observed after excluding Chandra 2021,[23] with the pooled Hb level change increasing from 1.93 g/dL (95% CI:1.05 – 2.80 g/dL) to 2.18 g/dL (95% CI:1.60 – 2.75 g/dL).
The changes in HbF level (%)
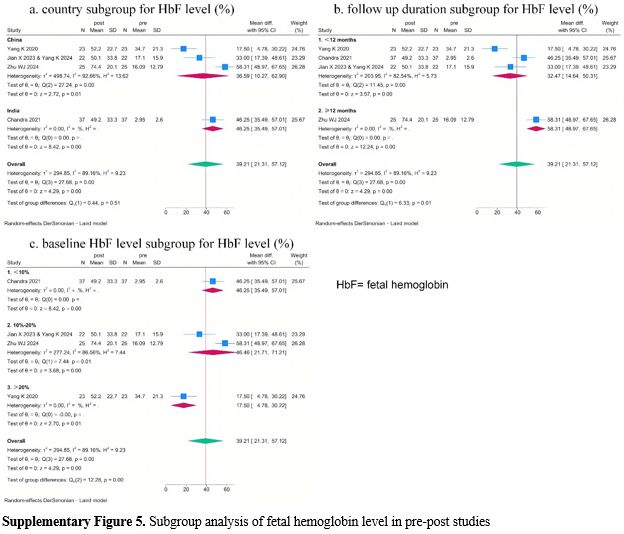
• Meta-analysis resultsThe meta-analysis results of HbF level (%) change after thalidomide treatment are shown in Figure 4. Three RCTs including 179 patients, HbF level. No significant heterogeneity was observed (I2=0.00%), and the fixed-effects model was applied. The pooled SMC was 5.61 (95% CI: 4.96 – 6.26; p = 0.00), indicating a large beneficial effect of the thalidomide arm compared with the control arm for increasing HbF level (Figure 4 c). Four pre-post studies, including 107 patients, reported HbF level. Significant heterogeneity was observed (I2=89.16%), and a random-effects model was applied. The meta-analysis indicated a significant increase in HbF level of 39.21% (95% CI:21.31% - 57.12%) following thalidomide treatment.
• Subgroup analysis results
Subgroup analysis of pre-post studies also indicated the potential effect of follow-up duration and baseline HbF level on HbF level changes (Supplementary Figure 5). But considerable unexplained heterogeneity remained within some subgroups, indicating that these factors may also not be the main source of heterogeneity in the meta-analysis.
• Sensitivity analysis results
Leave-one-out analysis showed that the meta-analysis results for HbF level changes in both RCTs and pre-post studies were robust (Supplementary Table 6). In pre-post studies, after removing the largest pre–post study (Chandra 2021[23]), the pooled HbF level change decreased from 39.21% (95% CI:21.31% - 57.12%) to 36.59% (95% CI:10.27% - 62.91%). Additionally, the greatest absolute difference in effect size was observed after excluding Yang K 2020,[22] with the pooled Hb level change increasing from 39.21% (95% CI:21.31% - 57.12%) to 46.99% (95% CI:33.52% - 60.47%).
The changes in SF level (ng/ml)
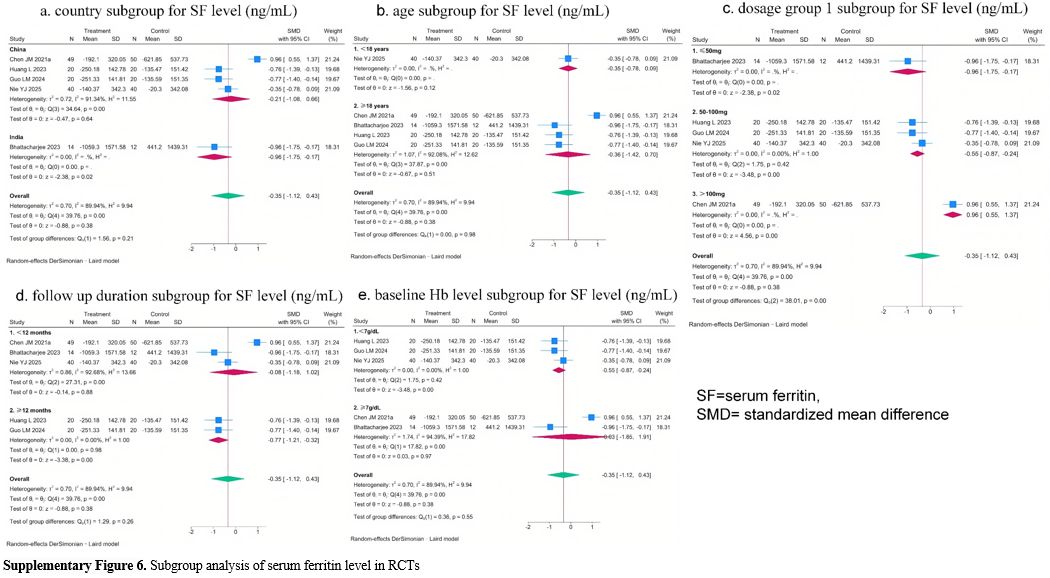
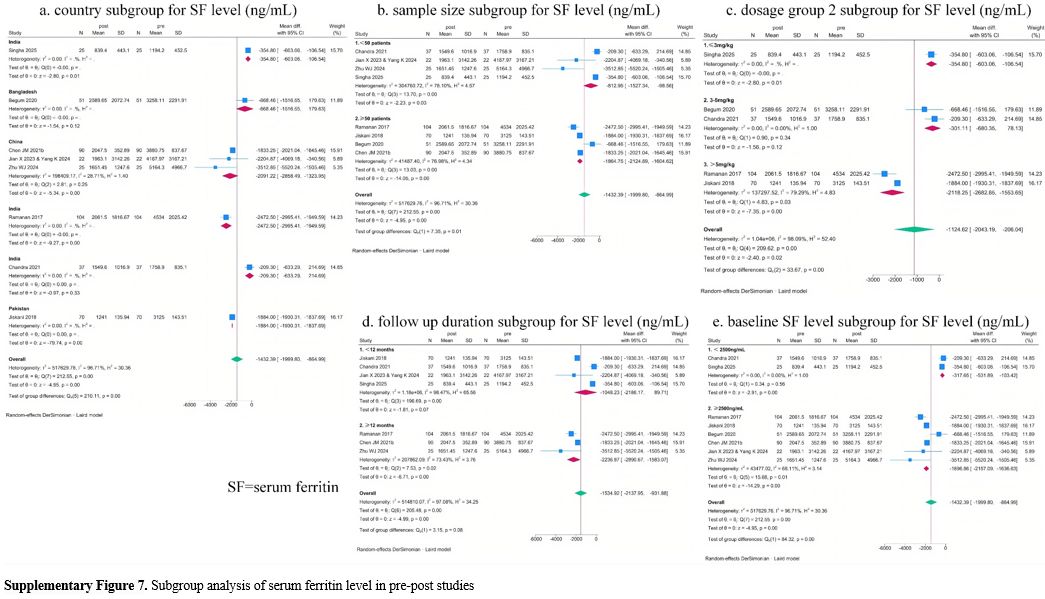
• Meta-analysis resultsThe meta-analysis results of SF level (ng/mL) change after thalidomide treatment are shown in Figure 4. Five RCTs, including 285 patients, reported SF level. Significant heterogeneity was observed (I2=89.94%), and a random-effects model was applied. The pooled SMC was -0.35 (95% CI: -1.12 – 0.43; p = 0.38), with no significant between-group difference in mean change from baseline (Figure 4. e). Eight pre-post studies, including 424 patients, reported the SF level. significant heterogeneity was observed (I2=96.71%), and a random-effects model was applied. The meta-analysis indicated a significant change in SF level of -1432.39 ng/mL (95% CI:-1999.80– -864.99 ng/mL) following thalidomide treatment.
In one non-randomized clinical trial,[40] SF level of patients in the thalidomide arm decreased significantly from a mean value of 3367.5 ± 1972.9 ng/mL to 1017.7 ± 830.3 ng/mL (p<0.001). By contrast, SF level in the non-thalidomide arm increased significantly from 3009.7 ± 1984.2 ng/mL to 4111.8 ± 1724.7 mg/mL (p<0.001).
• Subgroup analysis results
Subgroup analysis of RCTs indicated the potential effect of dosage group 1 on SF level changes (Supplementary Figure 6 c). No heterogeneity was observed within the thalidomide dosage group 1 subgroups, indicating this factor may explain a portion of the overall heterogeneity in the meta-analysis. Notably, the pooled SMC estimates decreased progressively with higher thalidomide dosage, suggesting a potential negative correlation between thalidomide dosage group 1 and SF level changes.
Subgroup analysis of pre-post studies also indicated the potential effect of country, sample size, thalidomide dosage group 2, follow-up duration, and baseline SF level on SF level changes (Supplementary Figure 7). Considerable unexplained heterogeneity remained within sample size, thalidomide dosage group 2, follow-up duration, and baseline SF level subgroups, indicating these factors may not be the main source of heterogeneity in the meta-analysis. Although no heterogeneity was observed within country subgroups, most subgroups included only one study. Therefore, it cannot be concluded that this factor may explain a portion of the overall heterogeneity in the meta-analysis.
• Sensitivity analysis results
In RCTs, leave-one-out analysis revealed that the overall result was not robust, as exclusion of one study (Chen JM 2021a[24]) reversed the statistical significance (Supplementary Table 6), with the pooled SMC decreasing from -0.35 (95% CI: -1.12 – 0.43) to -0.61 (95% CI: -0.90 - -0,.32). And in pre-post studies. leave-one-out analysis showed that the meta-analysis results for SF level changes were robust. After removing the largest pre- and post–study (Ramanan 2017),[17] the pooled SF level change increased from -1432.39 ng/mL (95% CI:-1999.80– -864.99 ng/mL) to -1263.72 ng/mL (95% CI:-1887.20– -640.24 ng/mL). Additionally, the greatest absolute difference in effect size was also observed after excluding Ramanan 2017.[17]
Safety analysis
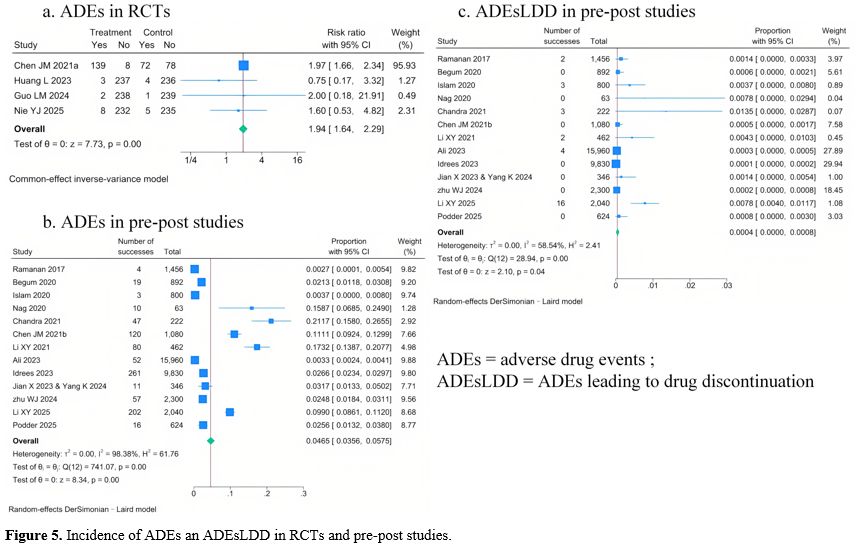
• Meta-analysis resultsThe meta-analysis results of adverse drug events (ADEs) incidence in RCTs and pre-post studies are shown in Figure 5.
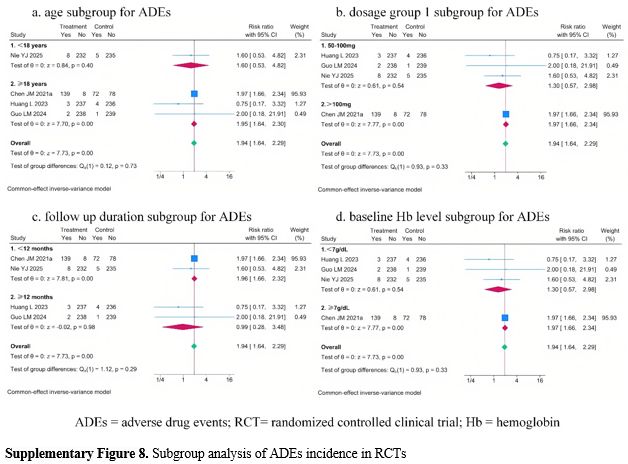
Four RCTs, including 259 patients, reported ADE incidence, and the pooled ADE incidence estimates are shown in Figure 5. A fixed-effect model was used for this meta-analysis. Compared with the control group, the thalidomide group had a significantly higher ADE incidence (RR=1.94, 95% CI:1.64 – 2.29). Thirteen pre-post studies, including 1640 patients, reported ADE incidence, and the pooled ADE incidence estimates are shown in Figure 5 b. A random-effects model was applied (I2=98.38%), and the pooled ADEs incidence was 4.65 per 100 person-months (95% CI: 3.56 – 5.75 per 100 person-months).
No RCTs reported the ADEs leading to drug discontinuation (ADEsLDD) incidence, and thirteen pre-post studies reported these. A random-effects model was applied (I2=58.54%), and the pooled ADEsLDD incidence was 0.04 per 100 person-months (95% CI: 0.00 – 0.08 per 100 person-months) (Figure 5 c).
 |
|
One RCT28 only reported ADEs incidence in the thalidomide arm, which was 22.62 per 100 person-months. For comparison, the ADEsLDD incidence was 3.57 per 100 person-months.
• Meta-regression analysis results
For the 13 per-post studies, the results of the meta-regression analysis are shown in Supplementary Table 5. Follow-up duration and sample size were significantly associated with ADEs incidence (p=-0.003, coefficient=0.0001 and p=-0.0001, coefficient=0.037, respectively). After introducing “follow-up duration” and “sample size” in the model, the between-study variance component increased from 0.0003 to 0.0005 and 0.001, respectively. These results suggested that “follow-up duration” and “sample size” did not explain the between-study heterogeneity in this meta-analysis.
• Subgroup analysis results
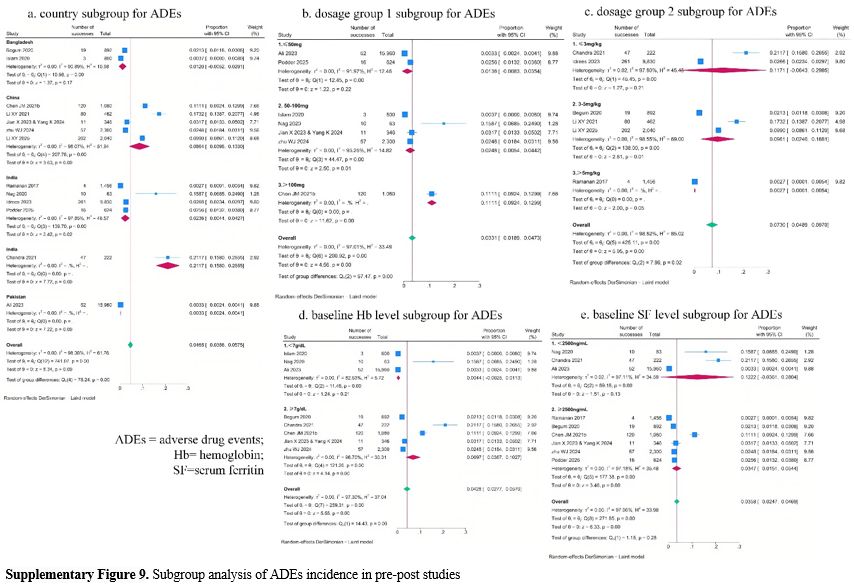
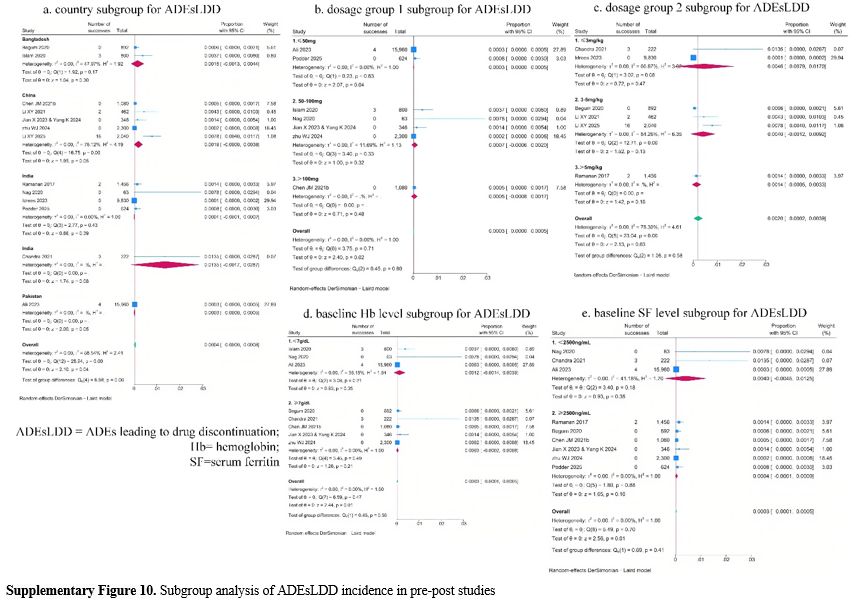
Subgroup analysis revealed no significant findings for ADEs in the RCTs and for ADEsLDD in pre-post studies (Supplementary Figure 8 and Figure 10). And subgroup analysis showed a potential effect of country, thalidomide dosage group 1, thalidomide dosage group 2, and baseline Hb level on ADEs incidence in pre-post studies (Supplementary Figure 9). But considerable unexplained heterogeneity remained within some subgroups, indicating that these factors may also not be the main source of heterogeneity in the meta-analysis.
• Sensitivity analysis results
Leave-one-out sensitivity analysis of ADEs incidence in RCTs showed that the overall result was not robust, as exclusion of one study (Chen JM 2021a[24]) reversed the statistical significance (Supplementary Table 6), with the pooled RR decreasing from 1.94 (95% CI:1.64 – 2.29) to 1.30 (95% CI:0.57 – 2.98). And in pre-post studies. leave-one-out analysis showed that the meta-analysis results for ADEs incidence were robust.
After removing the largest pre–post study (Ali 2023[27]), the pooled ADEs incidence increased from 4.65 per 100 person-months (95% CI: 3.56 – 5.75 per 100 person-months) to 5.7 per 100 person-months (95% CI: 4.2 – 7.2 per 100 person-months). Additionally, the greatest absolute difference in effect size was also observed after excluding Ali 2023.[27]
Leave-one-out sensitivity analysis of ADEsLDD incidence in pre-post studies showed that the overall result was not robust, as exclusion of four studies (Ramanan 2017,[17] Islam 2020,[20] Li XY 2021,[25] and Li XY 2025)[38] reversed the statistical significance. And after removing the largest pre- and post–study (Ali 2023[27]), the pooled ADEsLDD incidence increased from 0.04 per 100 person-months (95% CI: 0.00 – 0.08 per 100 person-months) to 0.1 per 100 person-months (95% CI: 0.0 – 0.2 per 100 person-months).
• Types of ADEs and ADEsLDD
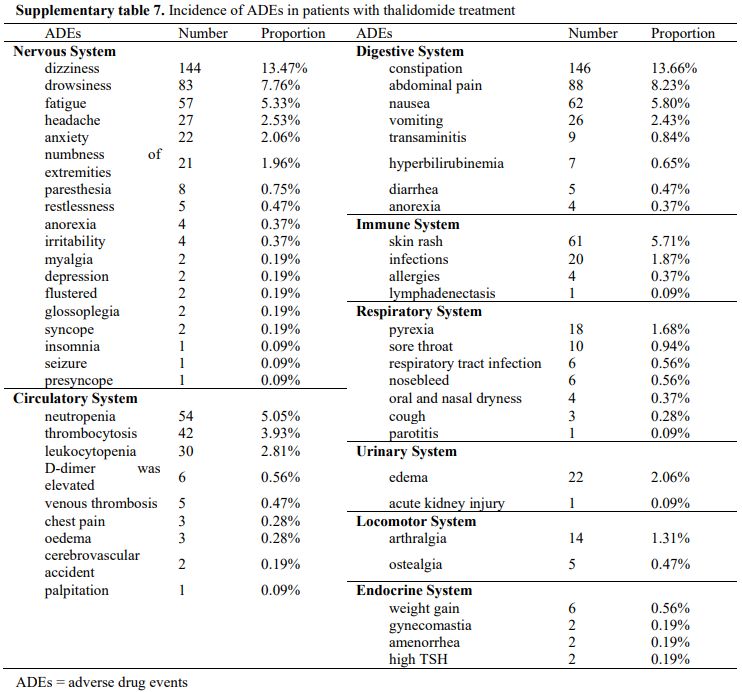
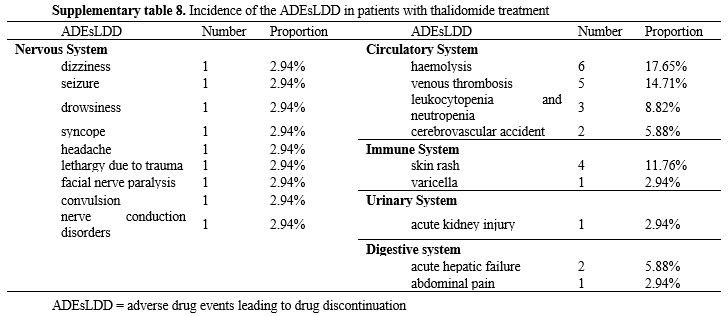
The thalidomide arms of the 5 RCTs, 13 pre-post studies, and 1 non-randomized clinical trial collectively reported 1020 ADEs (Supplementary table 7). The top five ADEs by incidence were constipation (13.66%), dizziness (13.47%), abdominal pain (8.23%), drowsiness (7.76%), and nausea (5.80%). Most of the symptoms were tolerable (n = 74, 44%). The thalidomide arms of the 1 RCTs, 6 pre-post studies, and 1 non-randomized clinical trial collectively reported 34 ADEsLDD (Supplementary table 8). The top four ADEsLDD by incidence were hemolysis (17.65%), venous thrombosis (14.71%), skin rash (11.76%), and leukocytopenia and neutropenia (8.82%). Most ADEs were mild and resolved spontaneously without withdrawal, whereas other symptoms were alleviated with temporary dose reductions.
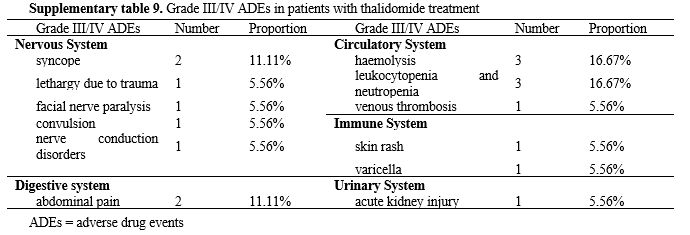
• Grade III/IV ADEs and thrombosis
Only 1 RCT[28] and 2 pre-post studies[23,38] reported 18 Grade III/IV ADEs (Supplementary table 9). The top four Grade III/IV ADEs by incidence were hemolysis (16.61%), leukocytopenia and neutropenia (16.61%), syncope (11.11%), and abdominal pain (11.11%). One RCT28 and four pre-post studies[17,25,27,38] reported 7 cases of thrombosis, all of which led to treatment discontinuation.
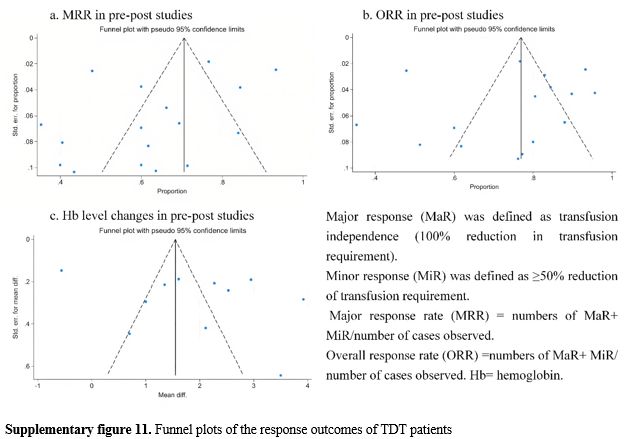
Reporting bias and certainty assessment. For all outcomes assessed, the Egger’s test indicated no significant publication bias: MRR (p = 0.14), ORR (p = 0.77), and changes of Hb level (p = 0.22). According to the results of funnel plots (Supplementary figure 11), as well as the Egger’s test, no reporting bias was observed in this study.
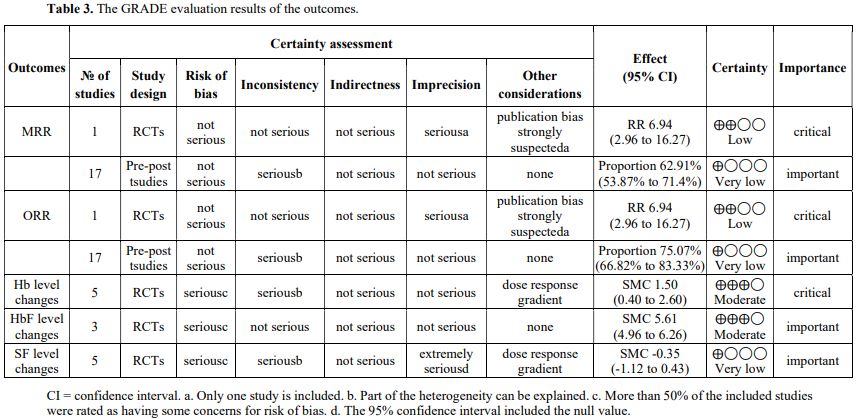
GRADE evaluation results of the outcomes are presented in Table 3. Compared with the control group, thalidomide showed significant benefits in achieving higher MRR and ORR among TDT patients. However, these beneficial effects were supported by low-certainty evidence. The certainty of evidence was downgraded primarily due to the inclusion of only one RCT,[24] which led to one-level downgrades for imprecision and potential publication bias. In pre-post studies, these findings of pooled MRR and ORR were supported by very low certainty evidence. The certainty of evidence was downgraded primarily because of extreme heterogeneity (I² > 90%). Since a part of the heterogeneity could be explained, the rating was downgraded by one level for inconsistency. In RCTs, compared with the control group, thalidomide significantly increased Hb levels compared with the control group in TDT patients. This finding was supported by moderate certainty evidence. The certainty of evidence was downgraded by one level for risk of bias, as more than 50% of the included RCTs were judged to have some concerns. It was also downgraded by one level for inconsistency due to extreme heterogeneity (I² > 90%), as a part of this heterogeneity could be explained. The rating was subsequently upgraded by one level for the presence of a dose-response gradient. In RCTs, compared with the control group, thalidomide significantly increased HbF levels compared with the control group in TDT patients. This finding was also supported by moderate certainty evidence. The certainty of evidence was downgraded by one level for risk of bias, as more than 50% of the included RCTs were judged to have some concerns. In RCTs, thalidomide showed no significant between-group difference in SF level changes compared with the control, a finding supported by evidence of very low certainty. The certainty of evidence was downgraded by one level for risk of bias, as more than 50% of the included RCTs were judged to have some concerns. It was also downgraded by one level for inconsistency due to extreme heterogeneity (I² > 90%), as a part of this heterogeneity could be explained. Because the 95% confidence interval included the null value, the certainty of evidence was downgraded by two levels for imprecision. The rating was subsequently upgraded by one level for the presence of a dose-response gradient.
 |
|
Discussion
The findings from RCTs should carry greater weight in clinical practice. The meta-analysis of RCTs indicated that compared with the control group, the thalidomide group had a significantly higher MRR and ORR (RR= 6.95, 95% CI: 2.96 – 16.27) (low certainty). A large beneficial effect was also observed in the improvement of Hb level (SMC=1.50, 95% CI: 0.40 -2.60) (moderate certainty) and HbF level (SMC=5.61, 95% CI: 4.96 – 6.26) (moderate certainty). However, the thalidomide group was associated with a higher incidence of ADEs (RR=1.94, 95% CI:1.64 – 2.29), while no significant between-group difference was found in SF level changes (SMC= -0.35, 95% CI: -1.12 – 0.43; p = 0.38) (very low certainty).Notably, the pooled results from observational studies provide only limited support for clinical decision-making. The meta-analysis of pre-post showed the following pooled outcomes: MRR, 62.91% (95% CI: 53.87 - 71.94%) (very low certainty); ORR, 75.07% (95% CI: 66.82 - 88.33%) (very low certainty); Hb level change, 1.94 g/dL (95% CI:1.05 – 2.80 g/dL); HbF level change, 39.21% (95% CI:21.31% - 57.12%); SF level change, -1432.39 ng/mL (95% CI:-1999.80– -864.99 ng/mL); ADEs incidence, 4.65 per 100 person-months (95% CI: 3.56 – 5.75 per 100 person-months); and ADEsLDD incidence, 0.04 per 100 person-months (95% CI: 0.00 – 0.08 per 100 person-months).
In recent years, 3 systematic reviews have reported on the efficacy of thalidomide in TDT patients. These 3 systematic reviews were Lu YF 2022,[43] Ali 2022,[44] and Atta 2024.[45] Findings of our study and the previous three systematic reviews are shown in Supplementary Table 10. For MRR, ORR, Hb level changes, and HbF level changes, the findings of our study were consistent with those of the previous three systematic reviews. For SF level changes, our findings were inconsistent with those reported by Lu YF 2022.[44] This difference may be caused by differences in the included studies. We included 8 studies, whereas Lu YF 2022[43] included only 3. In Lu YF 2022,[43] Ali 2022,[44] and Atta 2024,[45] the ADE incidences were 30% (95%CI: 15 to 47%), 41.2% (=322/780), and 44%, respectively. Most reported ADEs were mild, with constipation being the most common. These findings of three previous systematic reviews were consistent with those reported in our study.
In conventional therapies, TDT patients require lifelong blood transfusion and iron chelation therapy, which brings many challenges and unmet needs. Our study indicated that compared with the control group, thalidomide significantly increased MRR, ORR, Hb level, and HbF level. Therefore, thalidomide was associated with potential benefits for TDT patients. For example, in settings where access to adequate blood products is limited,[46] thalidomide can reduce transfusion dependence in TDT patients. This reduction may alleviate the associated economic and psychological burdens on both patients and their families, thereby contributing to an improved quality of life. In Africa and the Western Pacific, around 97.3% of TDT patients did not receive blood transfusions, compared to 47.6% in the Americas and 46.8% in China.[5,47] The major contributors to medical costs are iron chelation therapy and blood transfusions.[47-49] In China, standard blood transfusion and iron chelation therapy for TDT children aged 0-5 costs CNY 20,000-30,000 annually, but 68.18% of thalassemia patient families have annual incomes below CNY 30,000.[47] Frequent hospital visits for blood transfusions and iron chelation therapy demand substantial time and energy for TDT patients, significantly disrupting their studies, work, and personal lives. In China,[47] nearly 40% of thalassemia patients have had to suspend or drop out of school due to their illness, and one-third of caregivers report moderate-to-severe care burden. A study conducted in Thailand demonstrated that transfusion dependence is associated with poor quality of life among patients with TDT.[50] Even in high-income countries, such situations cannot be avoided.[1,51,52]
Liver iron concentration (LIC) was designated as a primary outcome. However, no included studies reported LIC data. This constituted an important limitation. However, other studies have shown that thalidomide can reduce liver iron overload. A pre-post study[53] reported liver R2* increased from 702.21 Hz to 595.00 Hz (p<0.001) at 3rd month after thalidomide treatment, and further decreased to 464.33 Hz (p<0.001) at 12 months after treatment.
Lenalidomide is a new generation of immunomodulator, a derivative of thalidomide. Due to its stronger angiogenesis inhibition and immunomodulatory effects, along with the advantages of almost no neurotoxicity and teratogenicity, it is currently widely used in the treatment of hematological diseases. Multiple studies have demonstrated that the overall ADE distribution of thalidomide and lenalidomide is consistent,[54] but there are some differences in the specific ADE signal characteristics. The adverse reactions to thalidomide-based treatment regimens are considerably milder.[54,55] In contrast, lenalidomide-based regimens have a lower risk for neurologic adverse events but an increased risk of hematologic adverse events.[54,55]
Although our systematic review included 21 studies, only 5 were RCTs. For some outcomes, the meta-analysis included only one RCT, resulting in a relatively small sample size. Although all outcomes showed favorable results, concerns about the quality of evidence remain. Therefore, additional large sample, high-quality RCTs are warranted in future research.
In contrast to the meta-analysis of RCTs on HbF levels, all other outcome meta-analyses showed extremely high heterogeneity (I2>89%). Meta regression and subgroup analysis for Hb levels indicated that dosage group 1 may account for some of the overall heterogeneity in the RCTs, whereas follow-up duration and baseline Hb level appeared to explain part of the heterogeneity in the pre–post studies. Dosage group 1 was also found to explain a portion of heterogeneity in the RCT meta analysis of SF levels. For the remaining meta analyses, the substantial heterogeneity could not be attributed to any identifiable factor. The presence of such high heterogeneity reduces the reliability of the findings and represents an important limitation of this study. Further high quality, rigorously conducted clinical studies are needed to strengthen the evidence base.
The sample size calculation for the RCT was reported by Chen JM 2021,[24] which indicated that approximately 100 participants would be required, assuming a 10% dropout rate, and about 90 participants if no dropouts occurred. With the exception of this trial, the other four included RCTs enrolled fewer than 90 participants. This small sample size may reduce statistical power and compromise the reliability of the findings, representing a limitation of our study. Future large-scale RCTs are needed to strengthen the evidence.
Yang K 2025[36] included the same patients as Jian X 2023[30] & Yang K 2024,[32] adding 3 new participants. Among the patients included in Zhu WJ 2024,[34] 29 were enrolled in the Chen JM 2021a and Chen JM 2021b. This factor may lead to an overestimation of the clinical efficacy of thalidomide, representing a limitation of this study.
A dose-response meta-analysis was not performed because the included studies did not report outcome data across multiple intervention levels, which is a prerequisite for such analyses. Meta-regression and subgroup analyses indicated no significant correlation between thalidomide dosage and MRR, ORR, HbF levels, ADEs, or ADEsLDD. However, subgroup analysis of RCTs indicated that with increasing thalidomide dosage, the pooled Hb level change estimates increased gradually, whereas the pooled SF level change estimates decreased gradually. Notably, when the thalidomide dosage was>100 mg, the changes in SF level in the control arm were more pronounced than those in the thalidomide arm. This suggested that the effect of dosage on SF level changes may be qualitative in nature. However, most subgroups included only one study, and the total number of included studies was limited. Therefore, no definitive conclusion can be reached on the association between thalidomide dosage and changes in Hb and SF levels, and further research is warranted.
Some conference abstracts were included. Owing to their brief format, these abstracts may lack substantial data and detailed information. Furthermore, no relevant studies were identified from OpenGrey, which may lead to the omission of unpublished negative studies. Although publication bias was not detected by Egger’s test, the above factors may still introduce potential bias into the pooled results.
All included studies were conducted in a limited number of Asian countries (China, India, Pakistan, Bangladesh, and Iraq), resulting in a restricted geographical representation. Although beta-thalassemia is prevalent in Mediterranean countries, the Middle East, Central Asia, India, Southern China, and the Far East, as well as countries along the north coast of Africa and in South America.[47] Population migration and intermarriage between different ethnic groups have introduced thalassemia in almost every country of the world, including Northern Europe, where thalassemia was previously absent. This regional clustering may limit the generalizability of the findings and reduce their external validity for clinical practice in other populations, which represents a limitation of this review. Further studies across broader geographic regions are needed to improve the applicability of the evidence.
Our study showed that the top four ADEsLDD by incidence were haemolysis (17.65%), venous thrombosis (14.71%), skin rash (11.76%) and leukocytopenia and neutropenia (8.82%), while the top four Grade III/IV ADEs by incidence were haemolysis (16.61%), leukocytopenia and neutropenia (16.61%), syncope (11.11%) and abdominal pain (11.11%). These findings indicate that circulatory system disorders represent the most frequent and clinically significant serious ADEs associated with thalidomide. This is supported by case report,[56] which also documents a high incidence of such events when thalidomide is used for other indications.[57-59] Consequently, vigilant monitoring for circulatory system-related adverse reactions is essential during clinical use of thalidomide.
One RCT[28] and four pre-post studies[17,25,27,38] reported 7 cases of thrombosis, all of which led to treatment discontinuation. Among the four pre-post studies, the thalidomide dosage was > 5mg/kg in Ramanan 2017,[17] 3-5mg/kg in Li XY 2021[25] and Li XY 2025,[38] and ≤ 50mg in Ali 2023.[27] Ramanan 2017[17] and Ali 2023[27] each reported 2 cases of thrombosis, whereas Li XY 2021[25] and Li XY 2025[38] each reported 1 case of thrombosis. Bhattacharjee 2023[28] was an RCT in which the thalidomide dosage was ≤ 50mg, with one case of thrombosis reported. Three pre-post studies (Ramanan 2017,[17] Ali 2023[27]) reported baseline SF levels. The baseline SF level was ≥2500 ng/mL in Ramanan 2017,[17] which reported 2 cases of thrombosis, while the baseline SF level was<2500 ng/mL in Ali 2023,[27] which also reported 2 cases of thrombosis. One RCT (Bhattacharjee 2023)[28] reported 1 case of thrombosis, with a baseline SF level of ≥2500 ng/mL. Similarly, two studies (Ali 2023[27] and Bhattacharjee 2023[28]) reported baseline SF levels. The baseline Hb level was <7g/dL in Ali 2023,[27] which reported 2 cases of thrombosis, while the baseline Hb level was ≥7g/dL in Bhattacharjee 2023,[28] which also reported 1 case of thrombosis. Owing to the limited number of studies reporting thalidomide dosage, baseline Hb level, and thrombosis events, it was difficult to determine whether a correlation exists among these factors. Multiple studies[60,61] have demonstrated that thalidomide is associated with thrombosis-related adverse reactions. Patients treated with thalidomide show a higher cumulative incidence of thrombotic events compared to those not receiving the drug. These results emphasize the importance of proactive thrombotic risk assessment and vigilant monitoring in clinical practice when using thalidomide therapy. However, whether a correlation exists between thrombosis formation and thalidomide dosage, as well as baseline Hb and SF level, requires further investigation.
Patients in groups Ali 2023,[27] Zhu WJ 2024,[34] and Rahman 2025[40] received additional aspirin or clopidogrel as part of their treatment regimen. ADEs reported in some studies[20,21] were underreported compared with the actual number observed. Therefore, this study may have underestimated these safety risks of thalidomide.
The GRADE certainty of evidence for most outcomes was rated as very low to low, with no outcome assessed as high certainty. This constitutes a major limitation of the present review, highlighting the need for more rigorously designed, high-quality RCTs to provide more reliable evidence.
Conclusions
The meta-analysis of RCTs demonstrated that, compared with the control group, thalidomide significantly increased MRR (low certainty), ORR (low certainty), Hb level (moderate certainty), and HbF level (moderate certainty), with no significant between-group difference in SF level changes (very low certainty). The meta-analysis of pre-post showed the following pooled outcomes: an MRR of 62.91% (very low certainty), an ORR of 75.07% (very low certainty), a Hb level change of 1.94 g/dL, a HbF level change of 39.21%, and an SF level change of -1432.39 ng/mL. The ADEs incidence was 4.65 per 100 person-months, and ADEsLDD incidence was 0.04 per 100 person-months, with most reported as mild and tolerable. These RCTs' findings should be prioritized to inform clinical practice, whereas the pooled results from observational studies provide only limited guidance for clinical decision-making.These RCT findings demonstrate that thalidomide was associated with potential benefits for TDT patients. However, it can also induce serious circulatory ADEs, and the incidence of such ADEs has been underestimated in our study. Therefore, the potential risks of thalidomide must be thoroughly weighed in clinical practice.
The low quality of evidence is attributed to the limited sample size, geographical concentration (primarily in Asia), high risk of bias, and substantial heterogeneity of the included RCTs. Therefore, future large-scale, globally diverse (including regions beyond Asia), and high-quality RCTs are warranted.
References
- Working party on Immunohematology, Chinese society
of blood transfusion. Chinese expert consensus on clinical transfusion
for transfusion-dependent thalassemia (TDT) patients. J Clin Transfus
Med, 2023(2). https://doi.org/10.3969/j.issn.1671-2587.2023.02.002
- Musallam
KM, Cappellini MD, Porter JB, Farmakis D, Eleftheriou A, Angastiniotis
M, Taher AT. TIF Guidelines for the Management of Transfusion-Dependent
β-Thalassemia. Hemasphere. 2025 Mar 5;9(3):e70095. https://doi.org/10.1002/hem3.70095
- Kattamis A, Kwiatkowski JL, Aydinok Y. Thalassaemia. Lancet. 2022 Jun 18;399(10343):2310-2324. https://doi.org/10.1016/S0140-6736(22)00536-0
- Lai
K, Huang G, Su L, He Y. The prevalence of thalassemia in mainland
China: evidence from epidemiological surveys. Sci Rep. 2017 Apr
19;7(1):920. https://doi.org/10.1038/s41598-017-00967-2
- Shah FT, Sayani F, Trompeter S, Drasar E, Piga A. Challenges of blood transfusions in b-thalassemia. Blood Rev 2019;37:100588. https://doi.org/10.1016/j.blre.2019.100588
- Njeim
R, Naouss B, Bou-Fakhredin R, Haddad A, Taher A. Unmet needs in
β-thalassemia and the evolving treatment landscape. Transfus Clin Biol.
2024 Feb;31(1):48-55. https://doi.org/10.1016/j.tracli.2023.12.003.
- Writing
group for practice guidelines for diagnosis and treatment of genetic
diseases, medical genetics branch of Chinese medical association.
Clinical practice guidelines for β-thalassemia. Chin J Med Genet, 2020,
37(3): 243-251. https://doi.org/10.3760/cma.j.issn.1003-9406.2020.03.004
- Gong
Y, Zhang X, Zhang Q, Zhang Y, Ye Y, Yu W, Shao C, Yan T, Huang J, Zhong
J, Wang L, Li Y, Wang L, Xu X. A natural DNMT1 mutation elevates the
fetal hemoglobin level via epigenetic derepression of the γ-globin gene
in β-thalassemia. Blood. 2021 Mar 25;137(12):1652-1657. https://doi.org/10.1182/blood.2020006425
- Liang
Y, Zhang X, Liu Y, Wang L, Ye Y, Tan X, Pu J, Zhang Q, Bao X, Wei X, Li
D, Kurita R, Nakamura Y, Li D, Xu X. GATA zinc finger domain-containing
protein 2A (GATAD2A) deficiency reactivates fetal haemoglobin in
patients with β-thalassaemia through impaired formation of
methyl-binding domain protein 2 (MBD2)-containing nucleosome
remodelling and deacetylation (NuRD) complex. Br J Haematol. 2021
Jun;193(6):1220-1227. https://doi.org/10.1111/bjh.17511
- Frangoul
H, Altshuler D, Cappellini MD, Chen YS, Domm J, Eustace BK, Foell J, de
la Fuente J, Grupp S, Handgretinger R, Ho TW, Kattamis A, Kernytsky A,
Lekstrom-Himes J, Li AM, Locatelli F, Mapara MY, de Montalembert M,
Rondelli D, Sharma A, Sheth S, Soni S, Steinberg MH, Wall D, Yen A,
Corbacioglu S. CRISPR-Cas9 Gene Editing for Sickle Cell Disease and
β-Thalassemia. N Engl J Med. 2021 Jan 21;384(3):252-260. https://doi.org/10.1056/NEJMoa2031054
- Martinez
PA, Li R, Ramanathan HN, Bhasin M, Pearsall RS, Kumar R, Suragani RNVS.
Smad2/3-pathway ligand trap luspatercept enhances erythroid
differentiation in murine β-thalassaemia by increasing GATA-1
availability. J Cell Mol Med. 2020 Jun;24(11):6162-6177. https://doi.org/10.1111/jcmm.15243
- Higgins
JPT, Thomas J, Chandler J, Cumpston M, Li T, Page MJ, Welch VA
(editors). Cochrane Handbook for Systematic Reviews of Interventions
version 6.5(updated August 2024). Cochrane, 2024. Available from www.training.cochrane.org/handbook.
- Slim
K, Nini E, Forestier D, Kwiatkowski F, Panis Y, Chipponi J.
Methodological index for non-randomized studies (minors): development
and validation of a new instrument. ANZ J Surg. 2003 Sep;73(9):712-6. https://doi.org/10.1046/j.1445-2197.2003.02748.x
- Wan
X, Wang W, Liu J, Tong T. Estimating the sample mean and standard
deviation from the sample size, median, range, and/or interquartile
range. BMC Med Res Methodol. 2014 Dec 19;14:135. https://doi.org/10.1186/1471-2288-14-135
- Hou
X, Shi J, Chen X.How to Estimate the Mean and Standard Deviation based
on the Median, Range and Sample Size when Conducting Meta-analysis.
Chin J Evid-based Med, 2015, 15(4):4. https://doi.org/10.7507/1672-2531.20150080
- Zhang T, Li B, Zhong W. Applied methodology for evidence-based medicine (3rd Edition). Central south university press, 2021.
- Ramanan V, Kelkar K. Role of Thalidomide in Treatment of Beta Thalassemia. J Blood Disord Med. 2017, 3(1). http://dx.doi.org/10.16966/2471-5026.119
- Jiskani SA, Memon S. Effect of thalidomide in patients with β–thalassemia major. Hematol Transfus Int J. 2018; 6(6): 234‒236. https://doi.org/10.15406/htij.2018.06.00191
- Begum
M , Moslem M , Begum N , Rahman M Z. Outcome of Treatment with
Thalidomide in Transfusion Dependent Thalassemia Patients: A
Prospective Study in a Thalassemia Center, Dhaka, Bangladesh. Am. J.
Pediatr. Vol. 6, No. 3, 2020, pp. 168-171. https://doi.org/10.11648/j.ajp.20200603.11
- Islam
A, Mahfuz DCH., Ara DT, Telfer DP, Dokal PI, Allard DS, Yeo DJH, Petrou
M, Roberts PD, Wright DJ. Effectiveness of thalidomide in transfusion
dependent thalassemia patients where transfusion and chelation are
challenging with alarming high incidence of transfusion transmitted
infection. Hemasphere. 2020; 4: 1058. https://doi.org/10.1097/HS9.0000000000000404
- Nag
A, Radhakrishnan VS, Kumar J, Bhave S, Mishra DK, Nair R, Chandy M.
Thalidomide in Patients with Transfusion-Dependent E-Beta Thalassemia
Refractory to Hydroxyurea: A Single-Center Experience. Indian J Hematol
Blood Transfus. 2020 Apr;36(2):399-402. https://doi.org/10.1007/s12288-020-01263-2
- Yang
K, Wu Y, Zhou Y, Long B, Lu Q, Zhou T, Wang L, Geng Z, Yin X.
Thalidomide for Patients with β-Thalassemia: A Multicenter Experience.
Mediterr J Hematol Infect Dis. 2020 May 1;12(1):e2020021. https://doi.org/10.4084/MJHID.2020.021
- Chandra
J, Parakh N, Sidharth, Singh N, Sharma S, Goel M, Pemde H. Efficacy and
Safety of Thalidomide in Patients With Transfusion-Dependent
Thalassemia. Indian Pediatr. 2021 Jul 15;58(7):611-616.
- Chen
JM, Zhu WJ, Liu J, Wang GZ, Chen XQ, Tan Y, Xu WW, Qu LW, Li JY, Yang
HJ, Huang L, Cai N, Wang WD, Huang K, Xu JQ, Li GH, He S, Luo TY, Huang
Y, Liu SH, Wu WQ, Lu QY, Zhou MG, Chen SY, Li RL, Hu ML, Huang Y, Wei
JH, Li JM, Chen SJ, Zhou GB. Safety and efficacy of thalidomide in
patients with transfusion-dependent β-thalassemia: a randomized
clinical trial. Signal Transduct Target Ther. 2021 Nov 18;6(1):405. https://doi.org/10.1038/s41392-021-00811-0
- Li
X, Hu S, Liu Y, Huang J, Hong W, Xu L, Xu H, Fang J. Efficacy of
Thalidomide Treatment in Children With Transfusion Dependent
β-Thalassemia: A Retrospective Clinical Study. Front Pharmacol. 2021
Aug 12; 12: 722502. https://doi.org/10.3389/fphar.2021.722502
- Li
J, Cai N, Huang L, Yang H. Clinical effect of thalidomide comprehensive
intervention in treatment of growth and development of β-thalassemia
patients. J Chin Med Pharm Res, 2022 (1): 40-42. https://doi.org/10.3969/j.issn.1007-1180.2022.17.013
- Ali
Z, Ismail M, Rehman IU, Rani GF, Ali M, Khan MTM. Long-term clinical
efficacy and safety of thalidomide in patients with
transfusion-dependent β-thalassemia: results from Thal-Thalido study.
Sci Rep. 2023 Aug 21;13(1):13592. https://doi.org/10.1038/s41598-023-40849-4
- Bhattacharjee
U, Khadwal A, Shafiq N, Lad D, Sharma P, Das R, Shukla P, Jain A,
Prakash G, Malhotra P. A Phase 2 Randomized Controlled Trial of
Single-Agent Hydroxyurea Versus Thalidomide Among Adult Transfusion
Dependent β Thalassemia Patients. Indian J Hematol Blood Transfus. 2023
Apr;39(2):266-275. https://doi.org/10.1007/s12288-022-01620-3
- Idrees
M, Khan MTM., Bawazir W, Hazzazi MS, Kabrah SM, Altayar MA, Al-Jaouni
S, Almashjary MN, Harakeh S, Yousafzai YM. Safety and efficacy of
low-dose thalidomide in patients with transfusion dependent
thalassemia: a clinico-hematological assessment. J Popul Ther Clin
Pharmacol. 2023, 30(17), 1344-1353. https://doi.org/10.53555/jptcp.v30i17.2709
- Jian
X, Liu X, Peng W, Li L, Hua F, Chen K, Zhang J, Luo S, Yang K, Wu Y.
Long-term efficacy and safety of thalidomide treatment in children with
β-thalassemia major. Pediatr Blood Cancer. 2023 Apr 28: e30391. https://doi.org/10.1002/pbc.30391
- Huang
L, Cai N, Li J. Efficacy of thalidomide combined with blood transfusion
in transfusion-dependent β-Thalassemia. Mod Med Health Res, 2023,
7:55-57. https://doi.org/10.3969/j.issn.2096-3718.2023.16.019
- Yang
K, Liu X, Peng W, Hua F, Li L, Chen K, Zhang J, Luo S, Li W, Ding Y,
Chen J, Xiao J. Effects of Thalidomide on Erythropoiesis and Iron
Homeostasis in Transfusion-Dependent β-Thalassemia. Mediterr J Hematol
Infect Dis. 2024 Jan 1;16(1):e2024001. https://doi.org/10.4084/MJHID.2024.001
- Yang
WJ, Kang QP, Zhou Q, Lin T, Gong XM, Huang CJ, Dou M, Lin Y. Clinical
efficacy of thalidomide for various genotypes of beta thalassemia. BMC
Med Genomics. 2024 Jul 18;17(1):191. https://doi.org/10.1186/s12920-024-01963-y
- Zhu
W, He Y, Huang M, Fu S, Liu Z, Wang X, Li Z, Li X, Chen J, Li Y.
Long-Term Follow-Up of Patients Undergoing Thalidomide Therapy for
Transfusion-Dependent β-Thalassaemia: A Single-Center Experience. Int J
Gen Med. 2024 Apr 30; 17: 1729-1738. https://doi.org/10.2147/IJGM.S462991
- Guo
L. Efficacy of thalidomide combined with blood transfusion in
transfusion-dependent β-Thalassemia. China science and technology
journal database (medicine), ,2024(8):182-185.
- Yang
K, Gong Y, Xiao J. Evaluating the Role of Red Blood Cell Lifespan in
Transfusion-Dependent β-Thalassemia and Impact ofThalidomide Treatment.
Am J Hematol. 2025 Mar;100(3):501-504. https://doi.org/10.1002/ajh.27557
- Faria
Hossain, Olia Sharmeen, Md. Fakhrul Alam,Md. Hasan Moshiur Shawon,
Rowshan Rowan. Effects of thalidomide in transfusion-dependent
beta-thalassemia patients. Annals of International Medical and Dental
Research, 2025, 11(2), 18-23. https://doi.org/10.53339/aimdr.2025.11.2.3
- Xinyu
Li, Weicong Hong, Jinni Wu, Qianyi Liu, Yong Liu, Shuting Hu, Luhong
Xu, Honggui Xu, Danping Zhong, Junjiu Huang, Jianpei Fang. Clinical
patterns of thalidomide in the treatment of transfusion-dependent
β-thalassaemia in children: a prospective single-arm study in China,
Annals of Medicine, 2025, 57:1, 2561219, https://doi.org/10.1080/07853890.2025.2561219
- Dibakar
Podder, Sandeep Saha, Siddhartha Roy, Sambit Samanta, Nilanjan Sinha,
Pampi Majumder, Maitreyee Bhattyacharyya. Safety and efficacy of
low-dose thalidomide in transfusion dependent E-beta thalassemia.
HemaSphere, 2025, 9, 1837-1838. https://doi.org/10.1002/hem3.70152
- Rahman
IU, Khan MTM, Ali Z, Ahmad S, Shahid M, Zafar S, Aamir FF, Khan I, Ali
M, Jelani M, Khan K, Ahmad N, Yousafzai Y, Mian AA, Siraj S.
Thalidomide confers therapeutic benefit in beta thalassemia patients by
enhancing hemoglobin and hematopoietic gene expression: A
non-randomized clinical trial. Blood Cells Mol Dis. 2025
Jul-Sep;113-114:102936. https://doi.org/10.1016/j.bcmd.2025.102936
- Joydeb
Singha, Arjin Philips Jacoby, Soumya Bhattacharya, Sudipta Sekhar Das.
Pilot Study on the Efficacy and Safety of Thalidomide in
Transfusion-Dependent and Non-transfusion-Dependent Thalassemia: A
Prospective, Non-randomized Interventional Study. Indian Journal of
Hematology and Blood Transfusion, 2025. https://doi.org/10.1007/s12288-025-02162-0
- Yijun
Nie. The Effcacy of Thalidomide in the Treatment of Transfusion
Dependent β-Thalassemia in Children. Smart Healthcare.
2025,11(29):155-158. https://doi.org/10.19335/j.cnki.2096-1219.2025.29.044
- Lu
Y, Wei Z, Yang G, Lai Y and Liu R. Investigating the Efficacy and
Safety of Thalidomide for Treating Patients With ß-Thalassemia: A
Meta-Analysis. Front Pharmacol. 2022, 12:814302. https://doi.org/10.3389/fphar.2021.814302
- Ali
Z, Ismail M, Khan MTM, Rahman IU. Safety and efficacy of Thalidomide in
transfusion-dependent β-thalassemia: a systematic review and
meta-analysis. Khyber Med Univ J 2022;14(3):201-6. https://doi.org/10.35845/kmuj.2022.22729
- Atta
T, Subhan Z, Nabi M, Ain NU, Ali W. Long term thalidomide therapy's
efficacy and safety in transfusion-dependent beta thalassemia major
patients: a systematic review. Khyber Med Univ J 2024;16(3):255-62. https://doi.org/10.35845/kmuj.2024.23705
- Mahapatra
S, Patra K, Marandi MM, Acharya S. Through the Eyes of the Recipient:
Navigating Transfusion Services Amidst COVID-19 in Multi-Transfused
Thalassaemic Patients. Indian J Hematol Blood Transfus. 2025
Apr;41(2):370-376. https://doi.org/10.1007/s12288-024-01837-4
- Beijing
AngelMom Charity Foundation, China Philanthropy Research Institute of
Beijing Normal University. China thalassemia blue book: report on the
prevention and treatment of thalassemia in China (2020). Beijing:
Chinese society press, 2021.
- Alshamsi
S, Hamidi S, Narci HO. Healthcare resource utilization and direct costs
of transfusion-dependent thalassemia patients in Dubai, United Arab
Emirates: a retrospective cost-of-illness study. BMC Health Serv Res.
2022 Mar 5;22(1):304. https://doi.org/10.1186/s12913-022-07663-6
- Udeze
C, Evans KA, Yang Y, Lillehaugen T, Manjelievskaia J, Mujumdar U, Li N,
Andemariam B. Economic and clinical burden of managing
transfusion-dependent β-thalassemia in the United States. J Med Econ.
2023 Jan-Dec;26(1):924-932. https://doi.org/10.1080/13696998.2023.2235928
- Sinlapamongkolkul
P., Surapolchai P. Health-related quality of life in Thai children with
thalassemia as evaluated by PedsQL and EQ-5D-Y: A single-center
experience. Mediterr J Hematol Infect Dis 2020, 12(1): e2020036, DOI: https://dx.doi.org/10.4084/MJHID.2020.036
- Donze
C, Benoit A, Thuret I, Faust C; NaThalY Network; Gauthier A, Berbis J,
Badens C, Brousse V. β-Thalassemia in childhood: Current state of
health in a high-income country. Br J Haematol. 2023
Apr;201(2):334-342. https://doi.org/10.1111/bjh.18631
- Knoth
RL, Gupta S, Perkowski K, Costantino H, Inyart B, Ashka L, Clapp K.
Understanding the Association between Red Blood Cell Transfusion
Utilization and Humanistic and Economic Burden in Patients with
β-Thalassemia from the Patients' Perspective. J Clin Med. 2023 Jan
4;12(2):414. https://doi.org/10.3390/jcm12020414
- Che
J, Luo T, Huang L, Lu Q, Yan D, Meng Y, Xie J, Chen W, Chen J and Long
L (2022) Magnetic Resonance Imaging Quantification of the Liver Iron
Burden and Volume Changes Following Treatment With Thalidomide in
Patients With TransfusionDependent ß-Thalassemia. Front. Pharmacol.
13:810668. https://doi.org/10.3389/fphar.2022.810668
- Zheng
Cai, Peng Men, Zaiwei Song, Rongsheng Zhao. Adverse drug reaction
signals mining of three immunomodulatory drugs based on real-world
data. Chin J Clin Pharmacol. 2024(006):040. https://doi.org/10.13699/j.cnki.1001-6821.2024.06.026
- Visacri
MB, Ribeiro MC, Komoda DS, Duarte BKL, Correa CRS, Maia FOM, Alves
DFDS. Lenalidomide or Thalidomide for Transplant-Ineligible Patients
With Newly Diagnosed Multiple Myeloma? An Overview of Systematic
Reviews. Value Health Reg Issues. 2024 Sep;43:100998. https://doi.org/10.1016/j.vhri.2024.100998
- Xiaoyan
Chen, Wenqiang Kong, Kun Yang. A case of autoimmune hemolytic anemia
caused by thalidomide. Chinese journal of pharmacoepidemiology. 2024,
33 (05): 591-594. https://doi.org/10.12173/j.issn.1005-0698.202309109
- Shu
Xu, Xiaoman Zu, Rui Feng, Shenghong Zhang, Yun Qiu, Baili Chen, Zhirong
Zeng, Minhu Chen, Yao He. Thalidomide in refractory Crohn's disease:
long-term efficacy and safety. Chinese journal of internal medicine.
2020 Jun 1;59(6):445-450. https://doi.org/10.3760/cma.j.cn112138-20191206-00800
- Tingting
Jiang, Hui Su, Yanping Li, Yuanlin Wu, Yue Ming, Chen Li, Ruoqiu Fu, Lu
Feng, Ziwei Li, Li Li, Rui Ni, Yao Liu. Post-marketing safety of
immunomodulatory drugs in multiple myeloma: A pharmacovigilance
investigation based on the FDA adverse event reporting system. Front
Pharmacol. 2022 Dec 1;13:989032. https://doi.org/10.3389/fphar.2022.989032
- Misawa
S, Sato Y, Katayama K, Nagashima K, Aoyagi R, Sekiguchi Y, Sobue G,
Koike H, Yabe I, Sasaki H, Watanabe O, Takashima H, Nishizawa M,
Kawachi I, Kusunoki S, Mitsui Y, Kikuchi S, Nakashima I, Ikeda S,
Kohara N, Kanda T, Kira J, Hanaoka H, Kuwabara S; Japanese POEMS
Syndrome for Thalidomide (J-POST) Trial Study Group. Safety and
efficacy of thalidomide in patients with POEMS syndrome: a multicentre,
randomised, double-blind, placebo-controlled trial. Lancet Neurol. 2016
Oct;15(11):1129-37. https://doi.org/10.1016/S1474-4422(16)30157-0
- Li
P, Xu B, Xu J, Wang Y, Yang Y, Wang W, Maihemaiti A, Li J, Xu T, Ren L,
Lan T, Zhou C, Wang P, Liu P. Thrombosis events in Chinese patients
with newly diagnosed multiple myeloma. Clin Exp Med. 2023
Nov;23(7):3809-3820. https://doi.org/10.1007/s10238-023-01080-7
- Liu Y, Zhou J, Song L, Niu P. Drug-associated deep vein thrombosis: a disproportionality analysis of the FDA adverse event reporting system (FAERS) database. Naunyn Schmiedebergs Arch Pharmacol. 2026 Jan 28. https://doi.org/10.1007/s00210-026-05024-2
Supplementary Files
 |
|
 |
|
 |
|
 |
Supplementary Table 4. Responses of TDT patients in our study and included studies. |
 |
 |
|
 |
Supplementary Table 6. Leave-one-out analysis of outcomes of TDT patients. |
 |
 |
|
 |
|
 |
|
 |
|
 |
|
 |
|
 |
|
 |
|
 |
|
 |
|
 |
|
 |
|
 |
|
 |
|
 |
|