Materials and Methods
From a large series of 684 subjects with hyperferritinemia (serum ferritin > 350 μg/L in men and > 200 μg/L in women) who underwent LICMRI quantification from January 2008 to October 2024,[15] we selected the 66 patients with BTT. All MRIs were performed at diagnosis, prior to iron depletion therapy, together with other investigations usually needed for the characterisation of hyperferritinemia.[16,17] Accurate clinical and biochemical evaluations were performed before the MRI. Age at time of MRI, sex, alcohol intake, body mass index (BMI), presence of arterial hypertension and diabetes, blood count, iron parameters (TSAT and ferritin), liver and metabolic indices (triglycerides, HDL cholesterol, glycemia) were collected. Subjects with a chronic history of alcohol consumption ≥30 g/day in men and ≥20 g/day in women were classified as alcohol drinkers. BMI cut-off points for overweight and obesity were >26 kg/m2 in men and >25 kg/m2 in women, and >30 kg/m2, respectively, and those for metabolic indices were as reported elsewhere.[18] The presence of liver steatosis was assessed by abdominal ultrasound by an expert internal medicine sonographer. Subjects were further classified according to the EASL-EASD-EASO guideline for Metabolically active steatotic liver disease (MASLD).[18] In subjects with steatotic liver disease (SLD), chronic hepatitis, high alcohol intake, and marked iron overload, the assessment of liver damage (e.g., severe fibrosis/cirrhosis) was done by liver function tests, blood-based score (FIB-4),[18] abdominal ultrasound, at diagnosis and during follow-up, and fibroelastography and liver biopsy when needed. LICMRI was assessed as previously reported[19] and was graded according to the severity of iron overload: <3 mg/g (grade 1), >3 <7 mg/g (grade 2), and >7 mg/g (grade 3). Grade 1 included patients with normal or slightly increased LIC not deserving therapeutic intervention, grade 2 those with mild-moderate iron overload in which tailored iron depletion therapy could be considered but is not mandatory, and grade 3 those with moderate-severe iron overload worthy of therapeutic intervention.[20,21] Genotyping of iron-related genes was performed according to the current hemochromatosis guidelines.[22] According to the recent hemochromatosis classification recommendation,[23] we considered p.Cys282Tyr homozygosity, compound heterozygosity for p.Cys282Tyr and another pathogenic HFE variant, and digenic genotypes as genotypes able to favour iron overload (henceforth defined as risk genotypes). In addition, we also included in the group of risk genotypes, the p.His63Asp homozygous and p.His63Asp/p.Cys282Tyr genotypes based on the evidence that they can lead to hepatic iron loading in the animal model,[24] and can act as modifiers of iron phenotype in humans when coexisting with other conditions favoring iron overload.[5,9-10,23] The manuscript is in accordance with ethical standards stated in the 1964 Declaration of Helsinki and its later amendments. Informed written consent for molecular testing and data recording in the local database was obtained from all participants, and the collection was conducted in accordance with Institutional rules.Statistical methods. Due to the skewed nature of continuous variables, median and 1st-3rd quartiles (Q1-Q3) were calculated for descriptive purposes, while qualitative variables were reported as absolute and relative frequencies. The Kruskal-Wallis rank-sum test and the Fisher’s exact test were performed to compare LICMRI grades, as appropriate, and were adjusted for multiple comparisons using the Benjamini-Hochberg method. A linear regression model was performed to evaluate the relationship between LICMRI and risk genotypes, alcohol intake, BMI, SLD, and liver cirrhosis. The effect of each factor was first evaluated alone in univariate models and then combined in a multivariable model to consider their additive effect. All tests were two-sided with a significance level of 0.05. All analyses were performed using R (Version 4.4.3, www.r-project.org).
Results
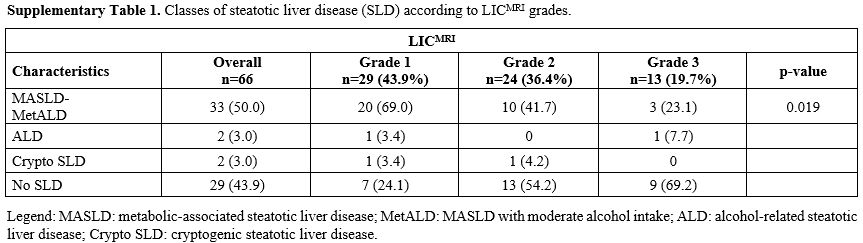
Table 1 shows clinical and biochemical data for subjects according to LICMRI grade. The majority showed normal/mild (n=29, 43.9%) or moderate LICMRI (n=24, 36.4%), and 13 (19.7%) showed LICMRI above 7 mg/g. There was a marked prevalence of men in all the classes. There were two patients with HCV-related chronic hepatitis, one with associated metabolic syndrome, and MASLD showing mild iron accumulation (grade 1), and the second (grade 3) was a heavy alcohol drinker. They both had cirrhosis. A single patient had a history of about twenty transfusions during hospitalisation for multiple trauma. Subjects with higher LICMRI were slightly but not significantly older (p=0.373), had lower haemoglobin concentration (p=0.004), and higher TSAT and ferritin compared to subjects with lower LICMRI (p<0.001). Figure 1 shows the distribution of TSAT and serum ferritin according to LICMRI: 84.6% of BTT subjects with grade 3 LICMRI had TSAT >60%, compared to 25% and 6.9% of those with grade 2 and 1, respectively; 84.6% of patients with grade 3 LICMRI had ferritin >1000 μg/L compared to 45.8% and 31.0% in those with grade 2 and 1, respectively. BMI was significantly higher in subjects with lower LICMRI grades than in those with grade 3 (p=0.002). In detail, 20/29 (69.0%) subjects with LICMRI grade 1 were overweight (14/29, 48.3%) or obese (6/29, 20.7%) compared to 12/24 (50%) and 2/24 (8.3%) of those with grade 2, and 2/13 (15.4%) and 0/13 of those with LICMRI grade 3, respectively (p=0.005). Accordingly, SLD was more frequent in the lower LICMRI classes (p=0.012). Supplementary Table 1 reports the different categories of SLD according to LICMRI, showing a higher frequency of MASLD/MetALD in the lower LICMRI classes (p=0.019). By contrast, liver cirrhosis was significantly more frequent in subjects with grade 3 than in those with grade 1 and 2 (p=0.001 and p=0.025, respectively). Of the four patients with liver cirrhosis in the lower classes of LICMRI, three were heavy alcohol drinkers, one had HCV-chronic hepatitis, and all presented with more than two metabolic alterations.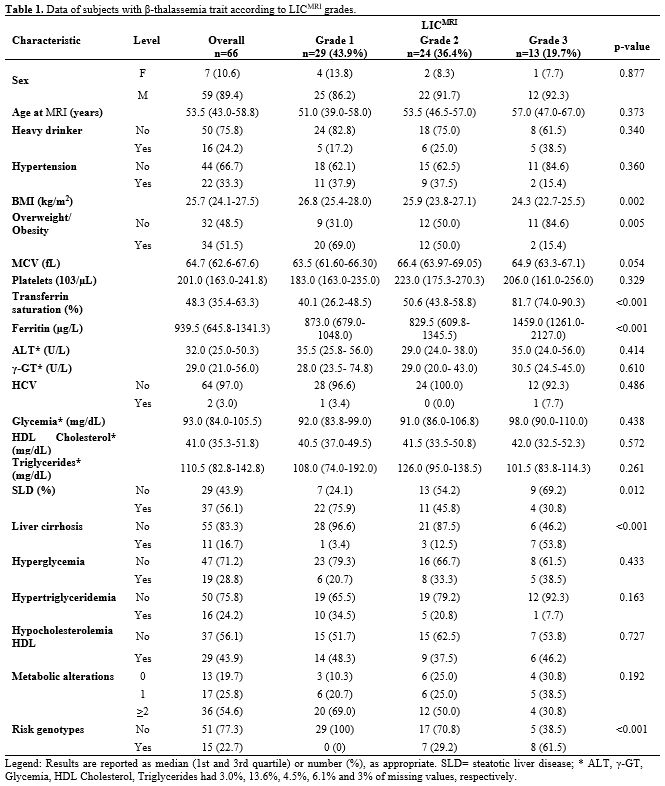 |
Table 1. Data of subjects with β-thalassemia trait according to LICMRI grades. |
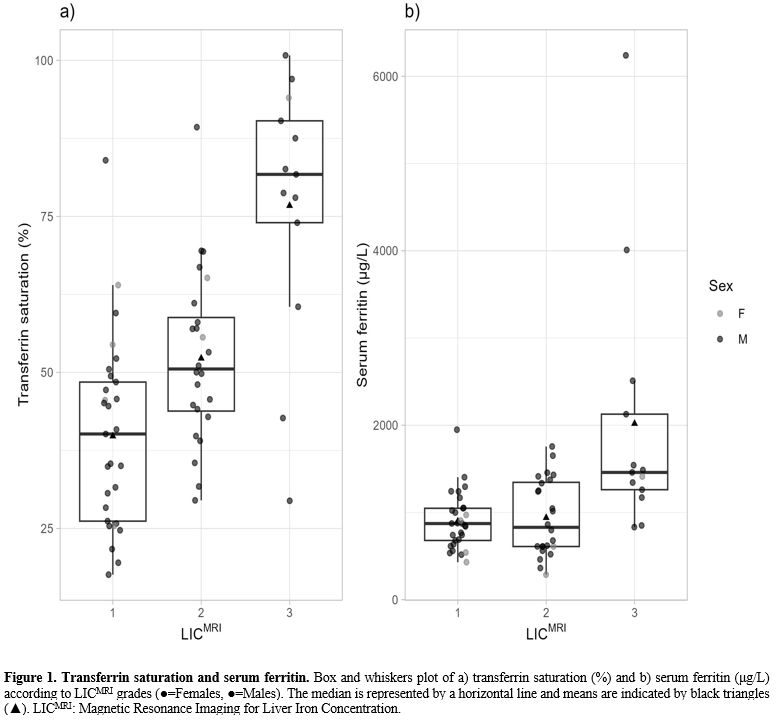 |
Figure 1. Transferrin saturation and serum ferritin. Box and whiskers plot of a) transferrin saturation (%) and b) serum ferritin (μg/L) according to LICMRI grades (●=Females, ●=Males). The median is represented by a horizontal line and means are indicated by black triangles (▲). LICMRI: Magnetic Resonance Imaging for Liver Iron Concentration. |
Results of genetic testing according to LICMRI grading are reported in Table 2, showing a higher frequency of genotypes at risk in LICMRI grade 2 and 3 compared to LICMRI grade 1 (p=0.003 and p<0.0001, respectively). Table 3 shows clinical and genetic details of the 13 subjects with major iron overload. A regression analysis identified risk genotypes, liver cirrhosis, and BMI as significantly associated with LICMRI. Table 4 reports the coefficients of the univariate and multivariable models. The presence of risk genotypes or liver cirrhosis was associated with an increase in LICMRI of 5.9 mg/g (p<0.001) and 5.3 mg/g (p=0.002), respectively. Conversely, for each additional kg/m² in BMI, LICMRI significantly decreased by 0.45 mg/g (p=0.021).
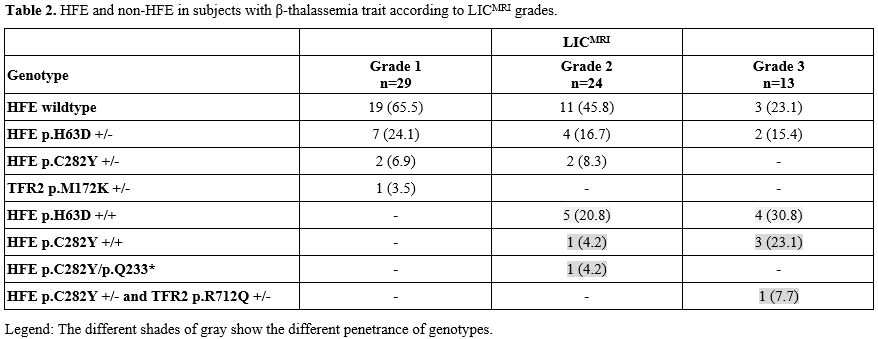 |
Table 2. HFE and non-HFE in subjects with β-thalassemia trait according to LICMRI grades. |
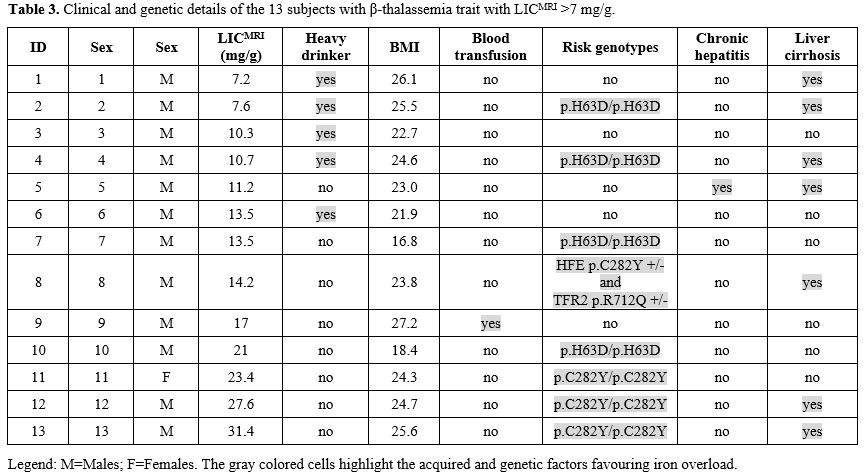 | Table 3. Clinical and genetic details of the 13 subjects with β-thalassemia trait with LICMRI >7 mg/g. |
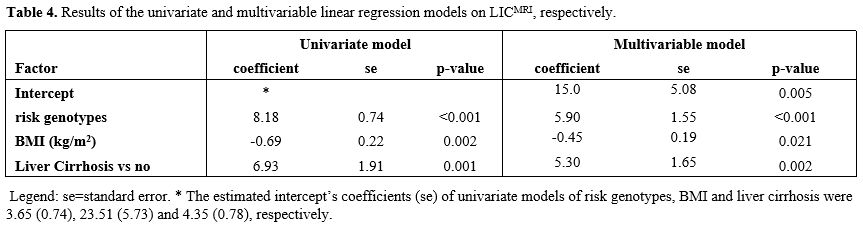 |
Table 4. Results of the univariate and multivariable linear regression models on LICMRI, respectively. |
Discussion
In the present study, we showed that: i. most of the 66 subjects with BTT and hyperferritinemia were males (89.4%); ii. 44% of BTT with hyperferritinemia had normal or slightly increased LICMRI, another 36% had moderate liver iron overload, while only 20% had LIC above the threshold generally considered at risk for liver damage (7 mg/g); iii. The distribution of overweight/obesity, fatty liver, HFE, and non-HFE genotypes favouring iron overload (risk genotypes), and liver cirrhosis significantly differed among the three classes of LICMRI. The higher prevalence of males is consistent with epidemiological studies showing a high prevalence of hyperferritinemia in men.[25] However, determining the risk of iron-related complications in patients with hyperferritinemia based on serum ferritin levels alone is inadequate, as serum ferritin is an unreliable index of liver iron overload.[16,26,27] In fact, while serum ferritin threshold (> 1000 μg/L) has been established in HFE-hemochromatosis to define such risk,[28] this is a major challenge in other patients with hyperferritinemia, as serum ferritin often overestimates the true amount of LIC.[16,26,27] Accordingly, in this series, serum ferritin levels did not differ between LICMRI grades 1 and 2, and many patients had levels above 1000 μg/L, even in lower LICMRI grades (Figure 1). Indeed, only a minority of subjects showed LICMRI above 7 mg/g. This value can be considered a reasonable threshold to distinguish patients at risk of iron-related liver injury who merit iron removal from those who can be followed up to monitor biochemical and clinical trends.[20,21,29] Overweight or obesity and SLD were more frequent in the lower class of LICMRI. This finding confirms that hyperferritinemia associated with metabolic alterations often overestimates the true amount of liver iron stores, confirming that they both can lead to disproportionate serum ferritin levels. By contrast, liver cirrhosis and risk genotypes were more frequent in the most severe class of LICMRI. Other factors, such as chronic viral hepatitis, high alcohol intake, and a history of multiple transfusions, might have favoured the development of major iron overload and/or the progression to liver cirrhosis in individual patients. This highlights the need to carefully evaluate hyperferritinemic subjects at the clinical, biochemical, and instrumental levels to ensure adequate clinical monitoring and appropriate therapies.The role of HFE variants in causing liver iron overload in BTT is controversial, with some suggesting an effect of even single variants in the heterozygous state.[10-14] We have shown that the frequency of heterozygous HFE variants did not differ from that expected in the general population.[30] By contrast, eight out of 13 subjects (61.5%) with severe LICMRI (Table 2 and 3) carried homozygous p.H63D or p.C282Y genotypes, and compound or digenic genotypes (risk genotypes). These results require some further consideration. While it was previously shown that coexistence of BTT can aggravate the iron overload phenotype in subjects homozygous for the p.C282Y mutation,[5] this remains debated for p.H63D homozygosity, which is generally considered a very poor penetrant genotype. However, our findings, together with previous reports,[9,10] support the hypothesis that BTT is an important modifier of p.H63D homozygous penetrance. In the remaining five subjects with high LICMRI, high alcohol intake, chronic hepatitis, multiple transfusions, and liver cirrhosis were variably present, suggesting they may contribute to the development of iron overload (Table 3).[31-35] Multivariable regression analysis showed that overweight, risk genotypes and cirrhosis variably influenced liver iron content as assessed by MRI (Table 4). While we can assume that HFE and non-HFE iron-related risk genotypes were causally involved in the development of iron overload, we cannot define the cause-and-effect relationship between iron overload and liver cirrhosis, as iron overload can favour liver fibrogenesis and liver cirrhosis can increase iron absorption.[29,34] Accordingly, Busti et al.[9] suggested that various cofactors, especially dysmetabolic features, alcohol consumption, and HFE genotypes, can favour the development of hyperferritinemia in BTT, sometimes leading to clinically relevant iron overload.
Conclusions
Our findings indicate that: i. even in patients with BTT, the presence of metabolic alterations and excessive alcohol intake should be evaluated before hyperferritinemia is considered a definitive index of major iron overload; these patients should be managed for lifestyle modification to avoid or limit the risk of alcohol- and metabolic-related complications at both hepatic and cardiovascular level and reevaluated at follow-up; ii. BTT can be considered a modifier of phenotype expression in individuals with HFE and non-HFE genotypes at risk for iron overload, but it is unlikely that BTT alone or in combination with heterozygous HFE variants can cause significant parenchymal iron overload in the liver unless other coexistent factors are present; iii. Quantification of liver iron by MRI is a useful tool for distinguishing BTT subjects with hyperferritinemia who can be followed up from those with major iron overload who deserve iron removal therapies. In clinical practice, accurate collection of patients’ medical history (previous transfusions, high alcohol intake, coexistent metabolic and hepatic diseases) and serum iron parameters can be useful to distinguish those who should first be managed with lifestyle changes and clinical-laboratory monitoring from those who should be started directly on MRI quantification of LIC.[16] Iron parameters would guide gene testing,[18] providing further information for the optimal diagnostic and therapeutic approach for patients. Accordingly, in a large cohort of subjects with hyperferritinemia, we recently showed that TSAT and serum ferritin can identify more than 95% of patients with severe LIC, reducing MRI requirements by more than 50%.[15]Acknowledgements
The project is supported (not financially) by the European Reference Network on Rare Haematological Diseases (ERN-EuroBloodNet)—Project ID No. 10108571. ERN- EuroBloodNet is partly co-funded by the European Union within the framework of the Fourth EU Health Programme. We thank the "Associazione per lo Studio dell'Emocromatosi e delle Malattie da Sovraccarico di Ferro-ETS", Monza, Italy, for supporting the study.Grant Support
G.R. was funded by the European Union - Next Generation EU - NRRP M6C2 - Investment 2.1 Enhancement and strengthening of biomedical research in the NHS project code PNRR-MAD-2022-12376033, title “Evidence-based models for high impact chronic disease prevention and risk of progression management in outpatient community services and community hospitals: towards eHealth integrating stratification on individual history with predictive models of disease progression, using machine learning and artificial intelligence on administrative and clinical databases”, PI Antonio Giampiero Russo. S.G. participated in the manuscript preparation during their personal involvement in the Italian Ministry of University MUR Dipartimenti di Eccellenza 2023-2027 (l. 232/2016, art. 1, commi 314–337). S.G. was partially supported by the grant PRIN 2022SYXEH.References
- Kattamis A, Forni GL, Aydinok Y, Viprakasit V.
Changing patterns in the epidemiology of β-thalassemia. Eur J Haematol.
2020;105(6):692-703. doi: 10.1111/ejh.13512. https://doi.org/10.1111/ejh.13512 PMid:32886826 PMCid:PMC7692954
- Guimarães
JS, Cominal JG, Silva-Pinto AC, Olbina G, Ginzburg YZ, Nandi V,
Westerman M, Rivella S, de Souza AM. Altered erythropoiesis and iron
metabolism in carriers of thalassemia. Eur J Haematol.
2015;94(6):511-8. doi: 10.1111/ejh.12464. https://doi.org/10.1111/ejh.12464 PMid:25307880 PMCid:PMC4393762
- Pippard
MJ, Wainscoat JS. Erythrokinetics and iron status in heterozygous beta
thalassaemia, and the effect of interaction with alpha thalassaemia. Br
J Haematol. 1987;66(1):123-7. https://doi.org/10.1111/j.1365-2141.1987.00115.x-i1
- Jones
E, Pasricha SR, Allen A, Evans P, Fisher CA, Wray K, Premawardhena A,
Bandara D, Perera A, Webster C, Sturges P, Olivieri NF, St Pierre T,
Armitage AE, Porter JB, Weatherall DJ, Drakesmith H. Hepcidin is
suppressed by erythropoiesis in hemoglobin E β-thalassemia and
β-thalassemia trait. Blood. 2015;125(5):873-80. doi:
10.1182/blood-2014-10-606491. https://doi.org/10.1182/blood-2014-10-606491 PMid:25519750 PMCid:PMC4321326
- Piperno
A, Mariani R, Arosio C, Vergani A, Bosio S, Fargion S, Sampietro M,
Girelli D, Fraquelli M, Conte D, Fiorelli G, Camaschella C.
Haemochromatosis in patients with beta-thalassaemia trait. Br J
Haematol. 2000;111(3):908-14. https://doi.org/10.1046/j.1365-2141.2000.02436 PMid:11122155
- Mehta BC, Pandya BG. Iron status of beta thalassemia carriers. Am J Hematol. 1987;24(2):137-41. doi: 10.1002/ajh.2830240204. https://doi.org/10.1002/ajh.2830240204 PMid:3812467
- Fargion
S, Taddei MT, Cappellini MD, Piperno A, Fiorelli G. The iron status of
Italian subjects with beta-thalassemia trait. Acta Haematol.
1982;68(2):109-14. doi: 10.1159/000206961. https://doi.org/10.1159/000206961 PMid:6812365
- White
JM, Richards R, Jelenski G, Byrne M, Ali M. Iron state in alpha and
beta thalassaemia trait. J Clin Pathol. 1986;39(3):256-9. doi:
10.1136/jcp.39.3.256. https://doi.org/10.1136/jcp.39.3.256 PMid:3958216 PMCid:PMC499758
- Busti
F, Castagna A, Marchi G, Vianello A, Chesini F, Bozzini C, Lima CDS,
Martinelli N, Nemeth E, Ganz T, Girelli D. A case series of patients
with β-thalassemia trait and iron overload: from multifactorial
hepcidin suppression to treatment with mini-phlebotomies.
Haematologica. 2025;110(5):1226-1231. doi:
10.3324/haematol.2024.286413. https://doi.org/10.3324/haematol.2024.286413
- Melis
MA, Cau M, Deidda F, Barella S, Cao A, Galanello R. H63D mutation in
the HFE gene increases iron overload in beta-thalassemia carriers.
Haematologica. 2002;87(3):242-245.
- Martins
R, Picanço I, Fonseca A, Ferreira L, Rodrigues O, Coelho M, Seixas T,
Miranda A, Nunes B, Costa L, Romão L, Faustino P. The role of HFE
mutations on iron metabolism in beta-thalassemia carriers. J Hum Genet.
2004;49(12):651-655. doi: 10.1007/s10038-004-0202-z. https://doi.org/10.1007/s10038-004-0202-z PMid:15538648
- Nadkarni
AH, Singh AA, Colaco S, Hariharan P, Colah RB, Ghosh K. Effect of the
Hemochromatosis Mutations on Iron Overload among the Indian β
Thalassemia Carriers. J Clin Lab Anal. 2017;31(3):e22054. doi:
10.1002/jcla.22054. https://doi.org/10.1002/jcla.22054 PMid:27561698 PMCid:PMC6816897
- Mónaco
ME, Alvarez Asensio NS, Haro C, Terán MM, Ledesma Achem ME, Issé BA,
Lazarte SS. Effect of HFE Gene Mutations on Iron Metabolism of
Beta-Thalassemia Carriers. Thalass. Rep. 2023;13:113-121. doi:
10.3390/thalassrep13010010. https://doi.org/10.3390/thalassrep13010010
- Estevão
IF, Peitl Junior P, Bonini-Domingos CR. Serum ferritin and transferrin
saturation levels in β0 and β(+) thalassemia patients. Genet Mol Res.
2011;10(2):632-9. doi: 10.4238/vol10-2gmr1016. https://doi.org/10.4238/vol10-2gmr1016 PMid:21491373
- Risca
G, Pelucchi S, Mariani R, Botti M, Capitoli G, Di Gennaro F, Galimberti
S, Piperno A. Transferrin Saturation and Serum Ferritin Are Main
Predictors of Liver Iron Content in Subjects With Hyperferritinemia.
Clin Gastroenterol Hepatol. 2026;24(1):141-149.e6. doi:
10.1016/j.cgh.2025.02.033. https://doi.org/10.1016/j.cgh.2025.02.033 PMid:40398831
- Piperno A, Pelucchi S, Mariani R. Hereditary Hyperferritinemia. Int J Mol Sci. 2023;24(3):2560. doi: 10.3390/ijms24032560. https://doi.org/10.3390/ijms24032560 PMid:36768886 PMCid:PMC9917042
- Aguilar-Martinez
P, Schved JF, Brissot P. The evaluation of hyperferritinemia: an
updated strategy based on advances in detecting genetic abnormalities.
Am J Gastroenterol. 2005;100(5):1185-94. doi:
10.1111/j.1572-0241.2005.40998.x. https://doi.org/10.1111/j.1572-0241.2005.40998.x PMid:15842597
- European
Association for the Study of the Liver (EASL); European Association for
the Study of Diabetes (EASD); European Association for the Study of
Obesity (EASO). EASL-EASD-EASO Clinical Practice Guidelines on the
management of metabolic dysfunction-associated steatotic liver disease
(MASLD). J Hepatol. 2024;81(3):492-542. doi:
10.1016/j.jhep.2024.04.031. https://doi.org/10.1016/j.jhep.2024.04.031 PMid:38851997
- Galimberti
S, Trombini P, Bernasconi DP, Redaelli I, Pelucchi S, Bovo G, Di
Gennaro F, Zucchini N, Paruccini N, Piperno A. Simultaneous liver iron
and fat measures by magnetic resonance imaging in patients with
hyperferritinemia. Scand J Gastroenterol. 2015;50(4):429-38. doi:
10.3109/00365521.2014.940380. https://doi.org/10.3109/00365521.2014.940380 PMid:25633726
- Olivieri
NF, Brittenham GM. Iron-chelating therapy and the treatment of
thalassemia. Blood. 1997 Feb 1;89(3):739-61. Erratum in: Blood
1997;89(7):2621. https://doi.org/10.1182/blood.V89.3.739 PMid:9028304 PMCid:PMC11969382
- Farmakis
D, Porter J, Taher A, Domenica Cappellini M, Angastiniotis M,
Eleftheriou A. 2021 Thalassaemia International Federation Guidelines
for the Management of Transfusion-dependent Thalassemia. Hemasphere.
2022;6(8):e732. doi: 10.1097/HS9.0000000000000732. https://doi.org/10.1097/HS9.0000000000000732 PMid:35928543 PMCid:PMC9345633
- European
Association for the Study of the Liver. EASL Clinical Practice
Guidelines on haemochromatosis. J Hepatol. 2022;77(2):479-502. https://doi.org/10.1016/j.jhep.2022.03.033 PMid:35662478
- Girelli
D, Busti F, Brissot P, Cabantchik I, Muckenthaler MU, Porto G; on
behalf of the Nomenclature Committee of the International Society for
the Study of Iron in Biology and Medicine (BIOIRON Society),
Hemochromatosis classification: update and recommendations by the
BIOIRON Society. Blood 2022; 139 (20): 3018-3029. doi:
10.1182/blood.2021011338 https://doi.org/10.1182/blood.2021011338 PMid:34601591 PMCid:PMC11022970
- Tomatsu
S, Orii KO, Fleming RE, Holden CC, Waheed A, Britton RS, Gutierrez MA,
Velez-Castrillon S, Bacon BR, Sly WS. Contribution of the H63D mutation
in HFE to murine hereditary hemochromatosis. Proc Natl Acad Sci USA.
2003;100(26):15788-93. doi: 10.1073/pnas.2237037100. https://doi.org/10.1073/pnas.2237037100 PMid:14673107 PMCid:PMC307646
- Sandnes
M, Ulvik RJ, Vorland M, Reikvam H. Hyperferritinemia-A Clinical
Overview. J Clin Med. 2021;10(9):2008. doi:10.3390/jcm10092008 https://doi.org/10.3390/jcm10092008 PMid:34067164 PMCid:PMC8125175
- Olynyk
JK, Gan E, Tan T. Predicting iron overload in hyperferritinemia. Clin
Gastroenterol Hepatol. 2009;7(3):359-62. doi:
10.1016/j.cgh.2008.11.010. https://doi.org/10.1016/j.cgh.2008.11.010 PMid:19095082
- Adams PC. The (Il)logic of iron reduction therapy for steatohepatitis. Hepatology. 2015;62(3):668-670. https://doi.org/10.1002/hep.27866 PMid:25914250
- Allen
KJ, Bertalli NA, Osborne NJ, Constantine CC, Delatycki MB, Nisselle AE,
Nicoll AJ, Gertig DM, McLaren CE, Giles GG, Hopper JL, Anderson GJ,
Olynyk JK, Powell LW, Gurrin LC; Health-Iron Study Investigators. HFE
Cys282Tyr homozygotes with serum ferritin concentrations below 1000
microg/L are at low risk of hemochromatosis. Hepatology.
2010;52(3):925-33. doi: 10.1002/hep.23786. https://doi.org/10.1002/hep.23786 PMid:20583211 PMCid:PMC2932765
- Bassett
ML, Halliday JW, Powell LW. Value of hepatic iron measurements in early
hemochromatosis and determination of the critical iron level associated
with fibrosis. Hepatology. 1986;6(1):24-9. doi: 10.1002/hep.1840060106.
https://doi.org/10.1002/hep.1840060106 PMid:3943787 PMCid:PMC11969382
- Merryweather-Clarke
AT, Pointon JJ, Shearman JD, Robson KJ. Global prevalence of putative
haemochromatosis mutations. J Med Genet. 1997;34(4):275-8. doi:
10.1136/jmg.34.4.275. https://doi.org/10.1136/jmg.34.4.275 PMid:9138148 PMCid:PMC1050911
- Harrison-Findik
DD. Role of alcohol in the regulation of iron metabolism. World J
Gastroenterol. 2007;13(37):4925-30. doi: 10.3748/wjg.v13.i37.4925. https://doi.org/10.3748/wjg.v13.i37.4925 PMid:17854133 PMCid:PMC4434614
- Trinder
D, Ayonrinde OT, Olynyk JK. HCV, iron, and oxidative stress: the new
choreography of hepcidin. Gastroenterology. 2008;134(1):348-51. doi:
10.1053/j.gastro.2007.11.048. https://doi.org/10.1053/j.gastro.2007.11.048 PMid:18166363
- Shander
A, Cappellini MD, Goodnough LT. Iron overload and toxicity: the hidden
risk of multiple blood transfusions. Vox Sang. 2009;97(3):185-97. doi:
10.1111/j.1423-0410.2009.01207.x. https://doi.org/10.1111/j.1423-0410.2009.01207.x PMid:19663936
- Ludwig
J, Hashimoto E, Porayko MK, Moyer TP, Baldus WP. Hemosiderosis in
cirrhosis: a study of 447 native livers. Gastroenterology.
1997;112(3):882-8. doi: 10.1053/gast.1997.v112.pm9041250. https://doi.org/10.1053/gast.1997.v112.pm9041250 PMid:9041250
- Ioannou
GN, Dominitz JA, Weiss NS, Heagerty PJ, Kowdley KV. The effect of
alcohol consumption on the prevalence of iron overload, iron
deficiency, and iron deficiency anemia. Gastroenterology.
2004;126(5):1293-301. doi: 10.1053/j.gastro.2004.01.020. https://doi.org/10.1053/j.gastro.2004.01.020 PMid:151317904.01.020.
Supplementary Files
 |
|