The clinical expression of glucose dysregulation in β-TDT is heterogeneous, reflecting several interacting factors such as: severity of the genotype and clinical phenotype, late initiation of or poor adherence to iron chelation therapy, chronic liver disease, overweight/obesity, coexistent endocrinopathies, zinc deficiency, and splenectomy.[2-4]
Although the importance of annual screening with OGTT is widely recognized, adherence rate remains as low as 41.3% in routine clinical practice.[5] Lack of infrastructure and organization of care, fragmentation between providers, cost and location of services may contribute to low screening rates, as well as patients' characteristics, such as age, ethnicity, educational status, and poor tolerability of standardized glucose solution.[5] Because β-TDT patients already undergo a large battery of annual investigations, the added burden of an OGTT on its own is a plausible driver of the low adherence rate, highlighting the need for exploring a less time consuming screenin test applicable in daily clinical practice.
Several alternative screening tools have been proposed, including HbA1c, fructosamine and glycated albumin; however, their performance in β-TDT is limited because chronic transfusion, ineffective erythropoiesis and shortened red-cell lifespan distort these biomarkers.[6,7] Continuous glucose monitoring (CGM) is a promising option, allowing real-time assessment of glycemic variability and earlier detection of dysglycemia in patients at high risk;[8] however, device cost, training requirements and data-interpretation challenges currently preclude routine use in most thalassemia centres.
An alternative approach is selective screening based on the presence of patient's risk factors.
A study conducted in Italy by Pepe et al.[9] in a cohort of 1,079 β-TDT patients (576 females and 503 males, mean age 37.7 ± 10.1 years, age range 7–65 years) reported that a fasting plasma glucose (FPG) value of 98 mg/dL predicted the presence of an abnormal OGTT (defined as IGT or Th-RDM) with a sensitivity of 60.4% and a specificity of 95.9%. This cut-off is highly specific but detects fewer than two-thirds of patients with an abnormal OGTT, highlighting the need for complementary markers. A lower FPG cut-off value (87.5 mg/dL) was reported in a study conducted in Iran (Tehran and Shiraz) and Italy (Ferrara) in patients who developed Th-RDM.[10]
In an attempt to reduce the costs and address the poor patients' adherence to OGTT, Dritsa et al.[11] have suggested performing OGTT only in the presence of the following characteristics: (i) patients at the beginning of puberty, (ii) fasting plasma glucose above 100 mg/dL, and (iii) homeostasis model assessment of insulin resistance (HOMA1-IR) above 1.85. Adopting these criteria, the researchers obtained a reduction of requested OGTTs equal to 46.4%.
The use of HOMA2-IR, HOMA2 β-cell function (%β) and insulin sensitivity (%S), calculated from fasting plasma glucose and insulin level, could be a convenient minimally invasive alternative first-line screening approach to evaluate the progression risk of β-cell failure and peripheral resistance to insulin action.[12,13]
The main aim of our retrospective observational study was to assess in young adult β-TDT patients with normal fasting plasma glucose (< 100 mg/dL) the association between clinical and laboratory variables, fasting HOMA-2 indices of insulin secretion and sensitivity (HOMA2-IR, HOMA2-%β, HOMA2-%S) and the fasting disposition index (HOMA2-%S/100 × HOMA2-%β/100) with 2-h OGTT outcome (NGT, IGT or Th-RDM). The secondary aims were: (i) to compare the predictive performance of fasting versus dynamic (OGTT-derived) surrogate indices of β-cell function and insulin sensitivity; and (ii) to determine optimal cut-off values for the most informative indices.
Materials and Methods
Study subjects and eligibility criteria. We retrospectively reviewed the medical records of 119 β-TDT patients who were referred, between January 2011 and September 2025, to a single Italian Outpatients Clinic experienced in Endocrinopathies of Thalassemias for an endocrine evaluation or second opinion.Eligibility criteria for patients' inclusion were: (a) β-TDT patients with confirmed FPG < 100 mg/dL who underwent a 2-h OGTT; (b) patients receiving regular blood transfusions and early iron chelation therapy; and (c) patients older than 18 years. The main exclusion criteria were: (a) non-transfusion-dependent thalassemia (NTDT) patients; (b) bone-marrow-transplanted patients; (c) pregnancy; (d) patients on medications influencing glucose metabolism (thiazide diuretics, beta-blockers, corticosteroids); (e) patients with incomplete clinical, biochemical and treatment data; and (f) patients with positive history of recent surgery or illness.
Of 119 patients initially screened, 77 were excluded (FPG ≥ 100 mg/dL, n = 19; NTDT, n = 7; age < 18 yr, n = 31 medication influencing glucose homeostasis, n = 4; incomplete data, n = 14; recent illness or surgery, n= 2, leaving 42 patients for analysis.
Patients' sample size, genotype and OGTT procedure. A total of 42 patients were included in the study (19 males and 23 females). β-TDT was diagnosed using complete blood count, hemoglobin HPLC, and molecular characterization of the β-globin genotype in 22/42 patients (52.4%); in the remaining 20 patients the diagnosis was based on transfusion dependence since early childhood, hematological indices and hemoglobin HPLC.
OGTT was performed at 08:30–09:00 h following a 10-hour overnight fast. A standard 75-g oral glucose load (dissolved in 300 mL of water) was administered over 5 minutes. Patients were instructed to maintain their usual dietary carbohydrate intake (≥ 150 g/day) for 3 days preceding the test and to fast overnight for 10 hours. Venous blood samples were taken at 0, 30, 60 and 120 minutes after glucose loading for measurements of plasma glucose (PG) and insulin concentrations. After centrifugation, PG was measured on the day of sample collection by the glucose oxidase method on an automated analyzer (ADVIA XPT clinical chemistry analyzer, Siemens Healthineers) and expressed in mg/dL. Insulin was measured by chemiluminescence immunoassay and expressed in μU/mL.
Glycemic status was classified according to the 2025 criteria of the American Diabetes Association:[14] normal glucose tolerance (NGT: FPG < 100 mg/dL and 2-h PG < 140 mg/dL), impaired glucose tolerance (IGT: 2-h PG 140–199 mg/dL) and thalassemia-related diabetes mellitus (Th-RDM: 2-h PG ≥ 200 mg/dL). The ADA thresholds are derived from adult epidemiological data showing an inflection in the risk of diabetes-related retinopathy above these values.
Clinical and biochemical measurements. The following data were collected on the day of the OGTT: age, sex, anthropometric measurements (height, weight, body mass index), patient's medical history (age at first transfusion, history of splenectomy, type and dose of chelating drugs, family history of diabetes) and relevant biochemical and hematological evaluations.
Height and weight were measured according to international recommendations. Body mass index (BMI) was calculated as weight (kg) divided by the square of height (m²). BMI was classified according to WHO adult criteria as underweight (< 18.5 kg/m²), normal weight (18.5–24.9 kg/m²), overweight (25.0–29.9 kg/m²) and obesity (≥ 30 kg/m²).[15]
Standard methods were used for all biochemical parameters. Alanine aminotransferase (ALT) was determined on an automated analyzer, and iron overload (IOL) was assessed by serum ferritin (SF, μg/L). IOL was arbitrarily classified as mild (SF < 800 μg/L), moderate (SF ≥ 800 and < 1,500 μg/L), high (SF ≥ 1,500 and < 3,000 μg/L) and severe (SF ≥ 3,000 μg/L). Serum ferritin is an imperfect surrogate of tissue iron burden; liver and pancreatic T2* MRI remain the reference standard but were not uniformly available in the historical records. SF was measured by chemiluminescence immunoassay.
Calculation of variables derived from OGTT. The following basal indices of insulin secretion and sensitivity/resistance were calculated:
HOMA2-IR, HOMA2-%β, HOMA2-%S, and the fasting disposition index (HOMA2-%S/100 × HOMA2-%β/100).[16-18] All were calculated using the web-based HOMA-2 Calculator of Oxford University (HOMA Calculator version 2.2; https://www.dtu.ox.ac.uk/homacalculator/). The HOMA-2 calculator incorporates a non-linear algorithm that accounts for hepatic and peripheral insulin dynamics and is considered more physiologically accurate than the original HOMA1. Using the cut-offs proposed by Kristensen et al.,[16] an HOMA2-% β value ≥ 100% was considered normal; values < 63.6% combined with elevated HOMA2-%S defined the insulinopenic subtype, whereas HOMA2-IR > 1.5 (90th percentile for adults aged 29–59 years) combined with HOMA2-%S < 59.9 % defined the hyperinsulinemic subtype.[16-18]
Insulin sensitivity derived from the OGTT was estimated as proposed by Matsuda and DeFronzo:[19] ISI Matsuda index = 10 000/ √[fasting insulin (μU/mL) × FPG (mg/dL) × mean OGTT glucose 0–120 (mg/dL) × mean OGTT insulin 0–120 (μU/mL)]. The ISI Matsuda index combines both hepatic and peripheral tissue insulin sensitivity.[19] Despite the wide use of these models, a universal cut-off or reference range has not been established for clinical classifications of normal, insulin-resistant, prediabetic and/or type 2 diabetes mellitus.[20] A higher ISI Matsuda index indicates greater insulin sensitivity.
To account for patients’ β-cell compensation, insulin secretion (HOMA2-% β) was plotted as a function of insulin sensitivity (HOMA2-% S) using the formula: HOMA2-% S/100 × HOMA2-% β/100. The index was compared with β-cell compensation during OGTT, the so-called oral disposition index (oDI), that reflects the hyperbolic relationship between insulin secretion and insulin sensitivity, from 0 to 120 minutes, calculated by insulinogenic index (IGI: Δ Insulin 0–30/Δ Glucose 0–30) × ISI Matsuda. index 20 and to IGI/HOMA 2- IR.
Statistical analysis. Data are reported as mean ± standard deviation (SD), count, percentage (%) and 95% confidence interval (CI) for categorical variables. The Kolmogorov–Smirnov test was used to verify normality of distribution. One-way analysis of variance (ANOVA) with Tukey's post-hoc test was performed to compare means of continuous variables with normal distribution; the Mann–Whitney U test was used for continuous variables with skewed distributions. The association between categorical variables was tested using the chi-square test. Pearson linear correlation coefficient (r) was determined for normally distributed variables, whereas Spearman's rank correlation coefficient [ρ (rho)] was used for variables that remained skewed after log transformation. A correlation coefficient < 0.10 was considered negligible, 0.10 – 0.39 weak, 0.40 – 0.69 moderate, 0.70–0.89 strong and 0.90 –1.00 very strong.
Three sequential exploratory multivariable linear regression models were fitted with 2-h plasma glucose as the dependent variable. Model 1 included demographic and clinical covariates (age, sex, history of splenectomy, positive family history of diabetes type 1 or 2, BMI, ALT, type of iron chelating agent and serum ferritin). Model 2 added fasting HOMA-2 indices (HOMA2-IR, HOMA2-%β, HOMA2-%S and the fasting disposition index HOMA2-% S/100 × HOMA2-% β/100). Model 3 added dynamic OGTT-derived indices (IGI, IGI Χ ISI Matsuda index and IGI/HOMA2-IR). Beta coefficients, t-statistics and overall model significance (ANOVA F-test) are reported. Variance inflation factors were inspected to assess multicollinearity. Given the small cohort size (n = 42) and the limited number of events in the diabetic subgroup (n = 3), all regression models should be regarded as exploratory and hypothesis-generating; the number of predictors relative to the sample size raises the possibility of overfitting, and results should not be interpreted as definitive independent predictors.
Receiver operating characteristic (ROC) analysis and area under the curve (AUC-ROC) were used to assess diagnostic performance of the most significant variables An AUC-ROC value of 0.5 indicates that the test is no better than chance; values above 0.80 were considered clinically useful and above 0.90 of diagnostic value, while AUC values below 0.80 — even if statistically significant — were interpreted as fair and of limited clinical performance. The 95% confidence interval was reported for each AUC; a narrow CI indicates that the AUC value is likely accurate, a wide CI that it is less reliable. ROC analysis and Youden's index (sensitivity + specificity − 1) were used to identify the optimal cut-off maximizing both metrics. Paired ROC curves were compared using the DeLong method.
Data analysis was carried out using R version 4.2.1 (R Core Team, 2022) and Statistics Kingdom calculators; Melbourne, Australia, 2017 (http://www.statskingdom.com). Statistical tests were two-sided and a P value < 0.05 was considered statistically significant.
Ethics. All participants gave informed consent in accordance with the principles of the Declaration of Helsinki and its later amendments in 2020 (www.wma.net) after a detailed explanation of the procedures for performing the OGTT, as well as the nature and purpose of the test. In our retrospective observational study, patients underwent only routine diagnostic procedures according to current recommendations or guidelines.[21,22] No additional interventions were provided. Researchers were only allowed to access the database for analysis purposes, and the database did not contain any personal identifying information. In accordance with the Italian Data Protection Authority General Authorisation no. 9/2014,[23] given the retrospective nature of the analysis and the use of fully anonymised data the requirement of Ethics Committee was waived.
Results
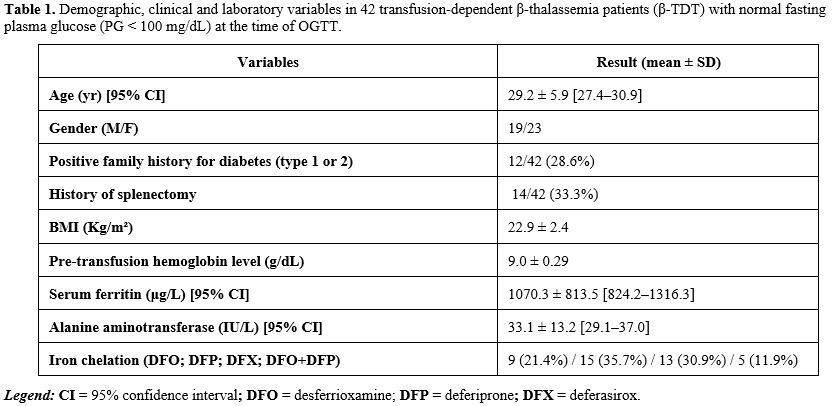
Description of the cohort. The baseline characteristics of the 42 β-TDT patients are outlined in Table 1. Their mean age was 29.2 ± 5.9 years with a BMI of 22.9 ± 2.4 Kg/m² at OGTT. Eight patients (two males and six females) were overweight (BMI 27.1 ± 1.1 kg/m², median 26.9, range 26.1–29.4 kg/m²).SF was mild (< 800 μg/L) in 26/42 (61.9%), moderate (≥ 800 and < 1,500 μg/L) in 6/42 (14.3%), high (≥ 1,500 and < 3,000 μg/L) in 9/42 (21.4%), and severe (≥ 3,000 μg/L) in 1/42 (2.4%). For the treatment of iron overload, the following chelators were used at the time of OGTT: desferrioxamine (DFO) in 9/42 (21.4%), deferiprone (DFP) in 15/42 (35.7%), deferasirox (DFX) in 13/42 (30.9%) and DFO + DFP in 5/42 (11.9%).
 |
|
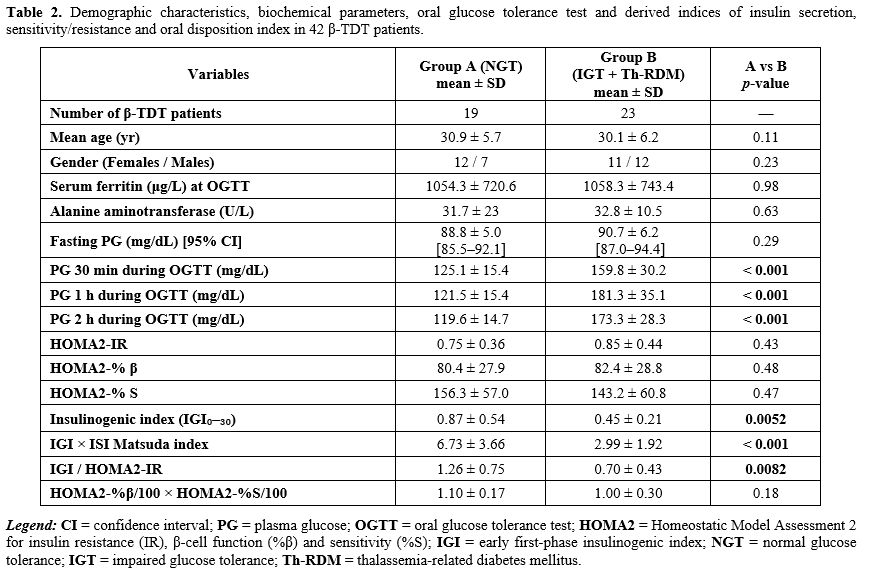
Analysis of OGTT and derived indices of insulin secretion and sensitivity/resistance. β-TDT patients with normal FPG were divided into two groups according to 2-h PG concentrations during OGTT: 19 patients had normal glucose tolerance (Group A) and 23 patients had impaired glucose tolerance or Th-RDM (Group B) (Table 2).
PG levels at 30 minutes and 1-hour after glucose load were significantly higher in Group B than in Group A (p: < 0.0001). A HOMA-2 insulinopenic subtype was present in 9/19 (47.4%) patients of Group A and 7/23 (30.4%) of Group B (χ2: 1.245; p: 0.26). The hyperinsulinemic subtype was present in 1/19 (5.2%) patients of Group A and 3/23 (13.0%) of Group B (χ2: 0.721; p: 0.39).
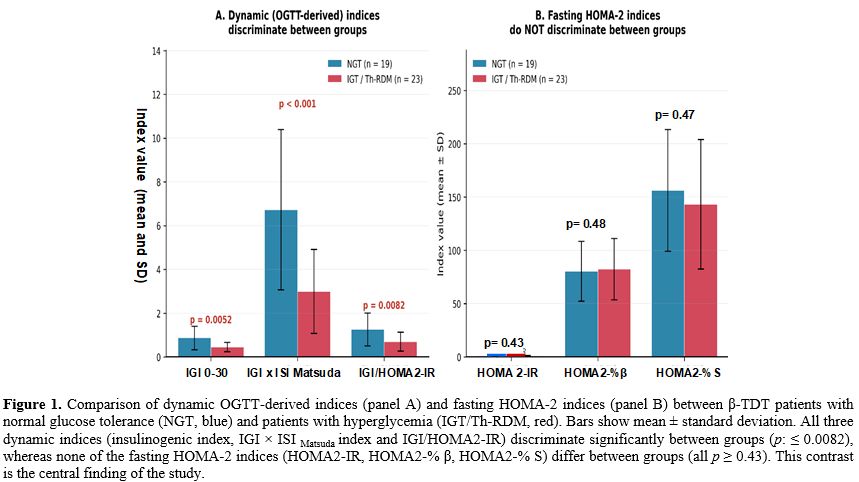
The most relevant differences between Group A and Group B were related to the 30-min and 1-h PG and the dynamic surrogate indices of early-phase insulin secretion, sensitivity/resistance and oDI (IGI × ISI Matsuda index and IGI/HOMA2-IR (Table 2). HOMA2-%β was not different between the two groups, probably because this index relies on fasting insulin, whereas β-TDT patients mostly present with stimulated-insulin secretion abnormalities; a fasting-based index may, therefore, not accurately estimate the reduced early-phase insulin secretion observed in β-TDT.
 |
|
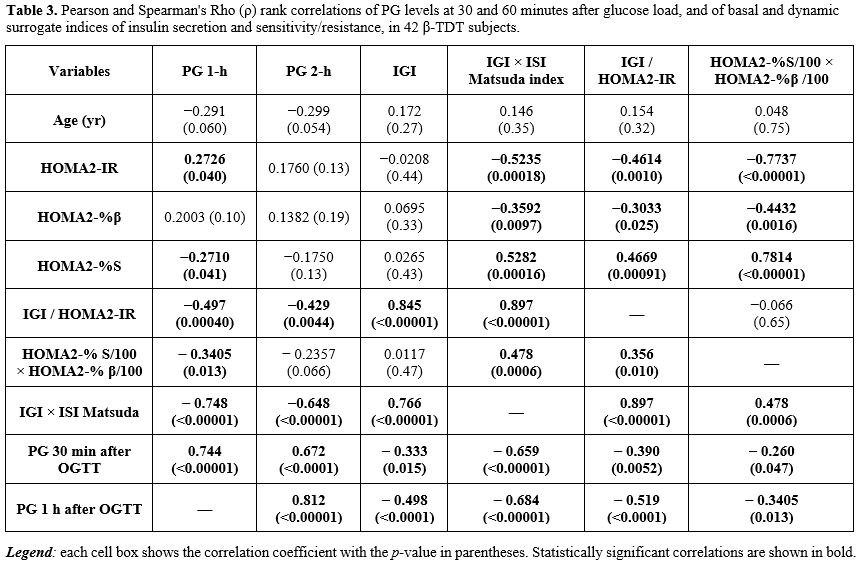
Correlations and diagnostic performance of predictors of dysglycemia in the total group of 42 β-TDT patients. A statistically significant inverse correlation was observed between patient age and SF level (r = −0.404; p = 0.0078), but not with BMI or ALT.
No correlation was present between FPG and 2-h PG after glucose load (r = 0.1505; p = 0.34) in the total group of 42 patients.
The significant correlations of the fasting indices HOMA2-IR, HOMA2-% β, HOMA2-% S and the fasting disposition index (HOMA2-%S/100 × HOMA2-% β/100) with 2-h PG and other variables are reported in bold in Table 3. HOMA2-% S/100 × HOMA2-% β/100 was negatively correlated with 1-h PG and positively correlated with the two dynamic oral disposition indices (IGI/HOMA2-IR and ISI Matsuda index).
 |
|
A moderate or strong positive correlation, using Pearson or Spearman's rho, was found between 30-min and 1-h PG versus 2-h PG after glucose load, while an inverse correlation was present with the early first-phase insulin response (IGI) (Table 3). IGI was inversely correlated with 2-h PG after glucose load (r= - 0.66; p= 0.000002).
Moreover, IGI × ISI Matsuda index and IGI/HOMA2-IR were negatively correlated with 2-h PG (Table 3 and Figure 1). Both dynamic disposition indices were also strongly positively correlated with the insulinogenic index (IGI).
 |
|
Interestingly, in the subgroup of 23 β-TDT patients with hyperglycemia, the fasting disposition index was inversely correlated with plasma glucose at all OGTT time points: 0 min (ρ = −0.56, p = 0.005), 30 min (ρ = −0.44, p: 0.035), 60 min (ρ = −0.44, p: 0.034) and 120 min (ρ = −0.47, p :0.023).
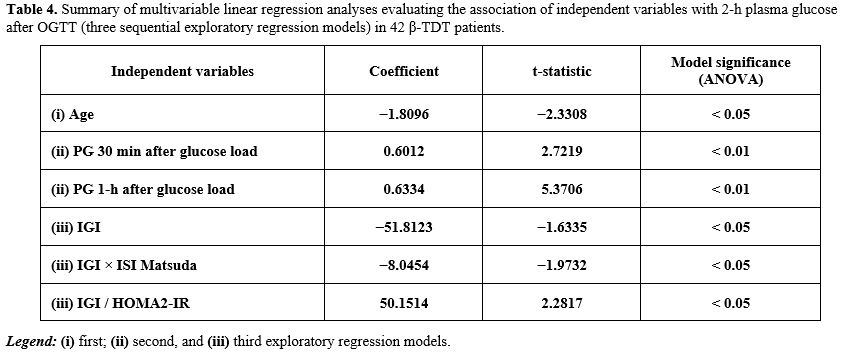
The multivariable regression analyses (Table 4) highlighted three findings relevant to dysglycemia risk: (i) age was inversely associated with 2-h PG; (ii) 30-min and 1-h PG levels during OGTT were strong positive predictors of 2-h PG; (iii) the insulinogenic index and its combination with insulin sensitivity (IGI × ISI Matsuda index) or fasting insulin resistance (IGI/HOMA2-IR) were independent predictors, confirming the pivotal role of β-cell compensation normalized to insulin sensitivity (oral disposition index).
 |
|
The areas under the receiver operating characteristic curves (AUC-ROC) used to compare the power of 30-min and 1-h PG, IGI × ISI Matsuda and IGI/HOMA2-IR as predictors of dysglycemia are illustrated in Figures 2 and 3.
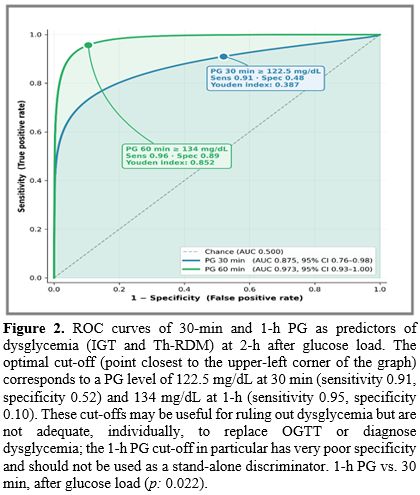 |
Figure 2.
ROC curves of 30-min and 1-h PG as predictors of dysglycemia (IGT and
Th-RDM) at 2-h after glucose load. The optimal cut-off (point closest
to the upper-left corner of the graph) corresponds to a PG level of
122.5 mg/dL at 30 min (sensitivity 0.91, specificity 0.52) and 134
mg/dL at 1-h (sensitivity 0.95, specificity 0.10). These cut-offs may
be useful for ruling out dysglycemia but are not adequate,
individually, to replace OGTT or diagnose dysglycemia; the 1-h PG
cut-off in particular has very poor specificity and should not be used
as a stand-alone discriminator. 1-h PG vs. 30 min, after glucose load (p: 0.022). |
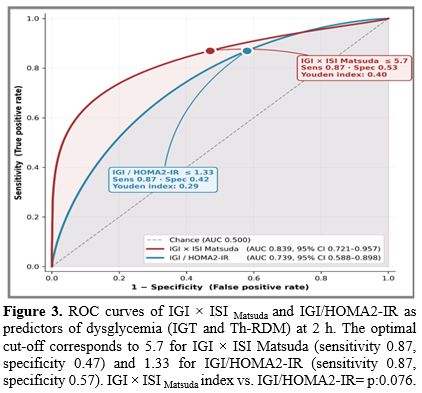 |
Figure 3. ROC curves of IGI × ISI Matsuda and IGI/HOMA2-IR as predictors of dysglycemia (IGT and Th-RDM) at 2 h. The optimal cut-off corresponds to 5.7 for IGI × ISI Matsuda (sensitivity 0.87, specificity 0.47) and 1.33 for IGI/HOMA2-IR (sensitivity 0.87, specificity 0.57). IGI × ISI Matsuda index vs. IGI/HOMA2-IR= p:0.076. |
Discussion
The development of dysglycemia in β-TDT patients is often asymptomatic, begins insidiously and remains undetected for a long time. Fasting hyperglycemia usually emerges in the late stages of dysglycemia, while ketoacidosis is a rare occurrence.[2-4] Therefore, early identification of dysglycemia through routine OGTT screening is of great value.[4,5] The OGTT is the standard approach to assess glucose metabolism and the reference standard for diagnosing diabetes mellitus.The utility of the OGTT has been further extended by introducing models to estimate insulin secretion and activity. Several surrogate indices of insulin secretion and sensitivity/resistance have been proposed based on measurable parameters obtained in the fasting state or after glucose load.[24,25] The major value of fasting surrogate indexes is their simplicity, as they require only the measurement of glucose and insulin after 8 to 10 hours of fasting.
Although the HOMA model is the most widely used surrogate index for assessing insulin resistance and β-cell function in clinical and epidemiological studies, to our knowledge this is the first study that comprehensively assessed the fasting indices of HOMA-2 as predictors of dysglycemia risk in patients with β-TDT. We tested the performance of HOMA-2 [HOMA2-IR, β-cell function (HOMA2-% β) and insulin sensitivity (HOMA2-% S)] in 42 β-TDT patients with normal fasting plasma glucose and at different stages of glucose-insulin metabolism and compared the results with dynamic measures assessed during OGTT.[2-4]
HOMA-2 is derived from a computer-solved model that assumes defined relationships between basal plasma glucose and insulin concentration. The calculation accounts for hepatic and peripheral glucose resistance variations and insulin secretion in the presence of higher plasma glucose concentrations. The index has been used extensively to predict progression to type 2 diabetes and has been validated against the euglycemic-hyperinsulinemic clamp.[26]
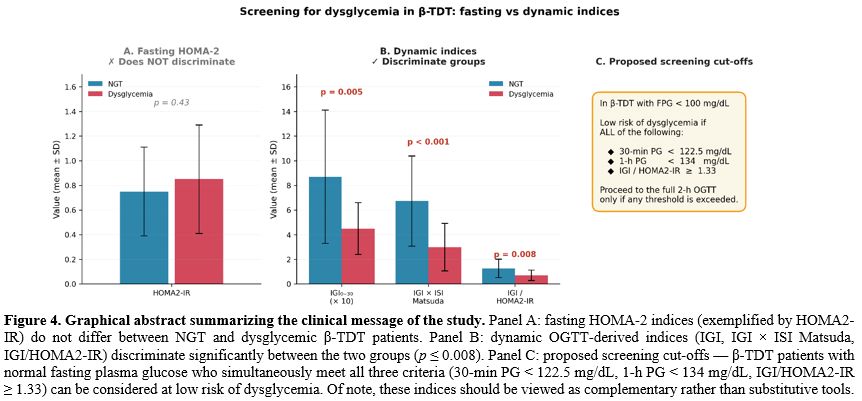
In this single-centre retrospective analysis of 42 young adult β-TDT patients with normal fasting plasma glucose, we observed three variables of potential clinical relevance. Firstly, fasting HOMA-2 indices (HOMA2-IR, HOMA2-%β, HOMA2-%S) did not discriminate between normal and impaired glucose tolerance; secondly, the fasting disposition index (HOMA2-%S/100 × HOMA2-%β/100) was correlated with 1-h PG in the whole cohort and with all post-load time points in the hyperglycemic subgroup, and thirdly, the combined IGI/HOMA2-IR ratio improved predictive performance. The Youden-optimal cut-off for IGI/HOMA2-IR as a predictor of dysglycemia (IGT and Th-RDM) was 1.33. These cut-offs are, however, hypothesis-generating given the small cohort size and the very limited number of patients with Th-RDM (n. = 3); they should not be regarded as clinically actionable screening thresholds pending prospective multicenter validation.
These findings suggest deficient insulin secretion as the main pathophysiological process of dysglycemia, while insulin resistance makes a minor contribution. The vulnerability of early-phase insulin secretion in β-TDT is consistent with evidence that pancreatic β-cells are an early target of iron-mediated oxidative damage, with iron preferentially accumulating in islet cells before fasting hyperglycemia becomes manifest.[27] Fasting HOMA-2 indices, which integrate hepatic insulin clearance and basal secretion, therefore remain in the normal range long after the dynamic β-cell reserve begins to decline; this explains the poor predictive value in our cohort and reinforces the need for provocative testing.
In essence, our data do not support the use of fasting HOMA-2 indices, individually, as reliable predictors of dysglycemia — or as sufficient tools to rule it out — in β-TDT patients with normal fasting glucose. However, model performance improved substantially when fasting insulin resistance was combined with the early-phase insulin response during the OGTT.
The multivariable regression analyses, performed using three sequential exploratory models to determine the association with the dependent variable 2-h PG after OGTT in the total group of patients, underline the importance of 3 key findings: (i) a significant inverse correlation of age with iron overload, assessed by serum ferritin; (ii) the critical role of early-phase insulin secretion post glucose load, as documented by the performance of IGI and PG levels at 30 min and 1-h after OGTT; and (iii) the pivotal role of the oral disposition index as a quantitative measure of β-cell function normalized to the degree of insulin sensitivity.
Our data reinforce the continued clinical importance of effective iron chelation. The inverse correlation we observed between patient age and serum ferritin (r = −0.404, p = 0.008) most likely reflects the cumulative benefit of prolonged chelation in well compliant adult patients.[28] Nevertheless, real-world adherence to daily oral chelation therapy remains suboptimal (with few exceptions); this is an issue that any screening strategy for dysglycemia must be pragmatic enough to accept. Patients' age, lifelong duration of chelation and the absence of short-term benefits are considered the major factors responsible for suboptimal compliance. Higher PG levels at 30 min and 1-h PG, as a proxy for first-phase insulin, strongly correlated with the 2-h post-challenge PG. These observations could represent a promising indicator for the follow-up of patients with dysglycemia.[29,30]
We acknowledge the limitations of the present study. Firstly, we did not recruit a control group and cohort size was small, which may minimize the generalization of our results. Future studies with larger cohorts and diverse subpopulations are needed validate the findings of this study and explore additional factors that may be associated with dysglycemia. Secondly, the diagnosis of dysglycemia was based on a single OGTT that might impact the classification of glycemic status; however, our results reflect real-life practice, where chances of repeated OGTT are limited. Thirdly, the role and cut-offs for mid-OGTT glucose levels need to be further studied in other populations. Fourthly, the data are retrospective and cross-sectional, and we did not capture the overall progression of dysglycemia in high-risk patients. Fifthly, with only 3 patients in the Th-RDM category, our multivariable models approach the lower limit of statistical reliability (events-per-variable ≈ 3–4), and the cut-offs we report should be regarded as hypothesis-generating rather than definitive. Sixthly, pancreatic iron content was estimated indirectly from serum ferritin; since pancreatic iron is biologically central to β-cell dysfunction in thalassemia, this is an important limitation that must be emphasized. Serum ferritin is an imperfect surrogate for pancreatic iron burden and should not be overinterpreted in this context. Pancreatic T2* MRI — the reference standard — was not available for all patients during the study period, and its incorporation in future prospective work would allow direct linkage between pancreatic iron load and dynamic β-cell indices. Finally, our data derive from a single Italian centre and ethnic and environmental variability may limit generalizability.
The main clinical messages of the study are summarized in Figure 4.
 |
|
Conclusions
In β-TDT patients with normal fasting plasma glucose, fasting HOMA-2 indices alone are insufficient to identify patients at high risk of glucose dysregulation. A screening protocol, incorporating a short 1-hour version of OGTT and the combination of IGI/HOMA2-IR, may identify patients at low risk of dysglycemia and offer an adjunctive rather than standalone tool to reduce the annual frequency of OGTT. Prospective, multicentre validation of reported thresholds is the logical next step, ideally coupled with pancreatic T2* MRI.Author contributions
Conceptualization: VDS. Methodology: VDS, SD, PT, ATS and MF. Formal analysis: IE, VDS. Investigation and data collection: VDS. Writing — original draft: VDS and ATS. Writing — review and editing: SD, PT, IE, MF and CK. Supervision: SD, PT, ATS, MF and CK. All authors have read and approved the final version of the manuscript and accept responsibility for its content.Acknowledgements
We are indebted to our colleagues for their help in facilitating this study.References
- De Sanctis V, Daar S, Tzoulis P, Soliman AT, Modeva
I, Savvidou I, Kattamis A, Delaporta P, Faranoush M, Saki F, Karimi M,
Salvo A, Al Rahbi S, Wali Y, Al Yaarubi S, Yassin MA, Kottahachchi D,
Kurtoğlu E, Gorar S, Unal S, Ay Tuncel D, Canatan D, Kattamis C. A
descriptive preanalytical survey of procedures followed for the
screening of glucose dysregulation in thalassemia Centers: Implications
for clinical practice and call for harmonization. Mediterr J Hematol
Infect Dis 2026;18(1):e2026035. https://doi.org/10.4084/MJHID.2026.035
- De
Sanctis V, Soliman A, Tzoulis P, Daar S, Karimi M, Yassin MA, Pozzobon
G, Kattamis C. The clinical characteristics, biochemical parameters and
insulin response to oral glucose tolerance test (OGTT) in 25
transfusion dependent β-thalassemia (TDT) patients recently diagnosed
with diabetes mellitus (DM). Acta Biomed. 2022;92(6):e2021488.
- Tzoulis
P, Yavropoulou MP, Banchev A, Modeva I, Daar S, De Sanctis V. Recent
advancements in glucose dysregulation and pharmacological management of
osteoporosis in transfusion-dependent thalassemia (TDT): an update of
ICET-A (International Network of Clinicians for Endocrinopathies in
Thalassemia and Adolescence Medicine). Acta Biomed. 2023;94(3):e2023178.
- De
Sanctis V, Soliman AT, Tzoulis P, Daar S, Di Maio S, Fiscina B,
Kattamis C. Glucose Metabolism and Insulin Response to Oral Glucose
Tolerance Test (OGTT) in Prepubertal Patients with
Transfusion-Dependent β-thalassemia (TDT): A Long-Term Retrospective
Analysis. Mediterr J Hematol Infect Dis. 2021;13(1):e2021051. https://doi.org/10.4084/MJHID.2021.051 PMid:34527203 PMCid:PMC8425353
- De
Sanctis V, Canatan D, Daar S, Kattamis C, Banchev A, Modeva I, Savvidou
I, Christou S, Kattamis A, Delaporta P, Kostaridou-Nikolopoulou S,
Karimi M, Saki F, Faranoush M, Campisi S, Fortugno C, Gigliotti F, Wali
Y, Al Yaarubi S, Yassin MA, Soliman AT, Kottahachchi D, Kurtoğlu E,
Gorar S, Turkkahraman D, Unal S, Oymak Y, Ay Tuncel D, Karakas Z, Gül
N, Yildiz M, Elhakim I, Tzoulis P. A Multicenter ICET-A Survey on
Adherence to Annual Oral Glucose Tolerance Test (OGTT) Screening in
Transfusion-Dependent Thalassemia (TDT) Patients - The Expert
Clinicians' Opinion on Factors Influencing the Adherence and on
Alternative Strategies for Adherence Optimization. Mediterr J Hematol
Infect Dis. 2025;17(1):e2025008. https://doi.org/10.4084/MJHID.2025.008 PMid:39830799 PMCid:PMC11740908
- Arjunan
D, Ghosh J, Kaur V, Dutta A, Dutta P. The Utility of HbA1c and
Fructosamine in Evaluating the Glucose Tolerance in Adult Patients with
Transfusion-Dependent Beta-Thalassemia. Indian J Endocrinol Metab.
2025;29(6):645-651. https://doi.org/10.4103/ijem.ijem_265_25 PMid:41497290 PMCid:PMC12768318
- Candrarukmi
D, Moelyo AG, Riza M. Glycated Albumin as Marker for Early
Hyperglycemia Detection in Adolescent with β-Thalassemia Major. Indones
Biomed J. 2021;13(3):281-288. https://doi.org/10.18585/inabj.v13i3.1546
- Soliman
AT, Yasin M, El-Awwa A, De Sanctis V. Detection of glycemic
abnormalities in adolescents with beta-thalassemia using continuous
glucose monitoring and oral glucose tolerance in adolescents and young
adults with β-thalassemia major: pilot study. Indian J Endocrinol
Metab. 2013;17(3):490-5. https://doi.org/10.4103/2230-8210.111647 PMid:23869308 PMCid:PMC3712382
- Pepe
A, Pistoia L, Gamberini MR, Cuccia L, Peluso A, Messina G, Spasiano A,
Allò M, Bisconte MG, Putti MC, Casini T, Dello Iacono N, Celli M,
Vitucci A, Giuliano P, Peritore G, Renne S, Righi R, Positano V, De
Sanctis V, Meloni A. The Close Link of Pancreatic Iron With Glucose
Metabolism and With Cardiac Complications in Thalassemia Major: A
Large, Multicenter Observational Study. Diabetes Care.
2020;43(11):2830-2839. https://doi.org/10.2337/dc20-0908 PMid:32887708
- De
Sanctis V, Saki F, Karimi M, Faranoush M, Elhakim I, Soliman AT, Daar
S, Tzoulis P. Fasting Plasma Glucose Levels within the High Normal
Range are Associated with a Significantly Increased Risk of Future
Dysglycemia in Transfusion-Dependent β-Thalassemia: A Decade-Long
Multicenter Retrospective Analysis. Mediterr J Hematol Infect Dis.
2025;17(1):e2025072. https://doi.org/10.4084/MJHID.2025.072 PMid:41235033 PMCid:PMC12611354
- Dritsa
M, Economou M, Perifanis V, Teli A, Christoforidis A. Retrospective
evaluation of oral glucose tolerance test in young patients with
transfusion-dependent beta-thalassemia. Acta Haematol. 2022;1-6. https://doi.org/10.1159/000523874 PMid:35235930
- Sung
KC, Reaven GM, Kim SH. Utility of homeostasis model assessment of
beta-cell function in predicting diabetes in 12,924 healthy Koreans.
Diabetes Care. 2010;33(1):200-2. https://doi.org/10.2337/dc09-1070 PMid:19808927 PMCid:PMC2797973
- Song
YS, Hwang YC, Ahn HY, Park CY. Comparison of the Usefulness of the
Updated Homeostasis Model Assessment (HOMA2) with the Original HOMA1 in
the Prediction of Type 2 Diabetes Mellitus in Koreans. Diabetes Metab
J. 2016;40(4):318-25. https://doi.org/10.4093/dmj.2016.40.4.318 PMid:27273908 PMCid:PMC4995187
- American
Diabetes Association Professional Practice Committee. Diagnosis and
Classification of Diabetes: Standards of Care in Diabetes-2025.
Diabetes Care. 2025;48(Suppl 1):S27-S49. https://doi.org/10.2337/dc25-S002 PMid:39651986 PMCid:PMC11635041
- World
Health Organization. Obesity: preventing and managing the global
epidemic. WHO Technical Report Series 894. Geneva: WHO, 2000.
- Kristensen
FPB, Christensen DH, Callaghan BC, Stidsen JV, Nielsen JS, Højlund K,
Beck-Nielsen H, Jensen TS, Andersen H, Vestergaard P, Jessen N, Olsen
MH, Hansen T, Brøns C, Vaag A, Sørensen HT. The Prevalence of
Polyneuropathy in Type 2 Diabetes Subgroups Based on HOMA2 Indices of
β-Cell Function and Insulin Sensitivity. Diabetes Care.
2023;46(8):1546-1555. https://doi.org/10.2337/dc23-0079 PMid:37335990
- Hammel
MC, Stein R, Kratzsch J, Vogel M, Eckert AJ, Triatin RD, Colombo M,
Meigen C, Baber R, Stanik J, Spielau U, Stoltze A, Wirkner K, Tönjes A,
Snieder H, Holl RW, Stumvoll M, Blüher M, Kiess W, Körner A. Fasting
indices of glucose-insulin-metabolism across life span and prediction
of glycemic deterioration in children with obesity from new diagnostic
cut-offs. Lancet Reg Health Eur.2023;30100652. https://doi.org/10.1016/j.lanepe.2023.100652 PMid:37465325 PMCid:PMC10350850
- Buccini
GS, Wolfthal DL. Valores de corte para índices de insulinorresistencia,
insulinosensibilidad e insulinosecreción derivados de la fórmula HOMA y
del programa HOMA2: Interpretación de los datos. Rev Argent Endocrinol
Metab. 2008;45(1):3-21. ISSN 1851-3034
- Matsuda
M, DeFronzo RA. Insulin sensitivity indices obtained from oral glucose
tolerance testing: comparison with the euglycemic insulin clamp.
Diabetes Care. 1999;22(9):1462-1470. https://doi.org/10.2337/diacare.22.9.1462 PMid:10480510
- De
Sanctis V, Soliman AT, Daar S, Tzoulis P, Karimi M, Saki F, Di Maio S,
Kattamis C. A prospective guide for clinical implementation of selected
OGTT-derived surrogate indices for the evaluation of β-cell function
and insulin sensitivity in patients with transfusion-dependent
β-thalassaemia. Acta Biomed. 2023;94(6):e2023221.
- Farmakis
D, Porter J, Taher A, Cappellini MD, Angastiniotis M, Eleftheriou A.
2021 Thalassaemia International Federation guidelines for the
management of transfusion-dependent thalassemia. Hemasphere.
2022;6(8):e732. https://doi.org/10.1097/HS9.0000000000000732 PMid:35928543 PMCid:PMC9345633
- De
Sanctis V, Soliman AT, Elsedfy H, Yaarubi SA, Skordis N, Khater D, El
Kholy M, Stoeva I, Fiscina B, Angastiniotis M, Daar S, Kattamis C. The
ICET-A Recommendations for the Diagnosis and Management of Disturbances
of Glucose Homeostasis in Thalassemia Major Patients. Mediterr J
Hematol Infect Dis. 2016;8(1):e2016058. https://doi.org/10.4084/mjhid.2016.058 PMid:27872738 PMCid:PMC5111521
- The
Italian Data Protection Authority. Authorisation no. 9/2014 - General
authorisation to process personal data for scientific research
purposes. Available at: https://www.garanteprivacy.it/web/guest/home/docweb/-/docweb-display/docweb/3786078 (accessed on 1 April 2026)
- Stefanovski
D, Smiley DD, Punjabi NM, Umpierrez GE, Vellanki P. Estimation of
Glucose Absorption, Insulin Sensitivity, and Glucose Effectiveness From
the Oral Glucose Tolerance Test. J Clin Endocrinol Metab.
2025;110(4):e1108-e1115. https://doi.org/10.1210/clinem/dgae308 PMid:38739548 PMCid:PMC11913079
- De
Sanctis V, Daar S, Soliman AT, Tzoulis P, Karimi M, Di Maio S, Kattamis
C. Screening for glucose dysregulation in β-thalassemia major (β-TM):
An update of current evidences and personal experience. Acta Biomed.
2022;93(1): e2022158.: Acta Biomed. 2024;95(6): e2024187
- Tam
CS, Xie W, Johnson WD, Cefalu WT, Redman LM, Ravussin E. Defining
insulin resistance from hyperinsulinemic-euglycemic clamps. Diabetes
Care. 2012;35(7):1605-1610. https://doi.org/10.2337/dc11-2339 PMid:22511259 PMCid:PMC3379600
- Noetzli
LJ, Mittelman SD, Watanabe RM, Coates TD, Wood JC. Pancreatic iron and
glucose dysregulation in thalassemia major. Am J Hematol.
2012;87(2):155-160. https://doi.org/10.1002/ajh.22223 PMid:22120775
- Wang
LE, Muttar S, Badawy SM. The challenges of iron chelation therapy in
thalassemia: how do we overcome them? Expert Rev Hematol.
2025;18(5):351-357. https://doi.org/10.1080/17474086.2025.2489562 PMid:40181584 PMCid:PMC12125653
- De
Sanctis V, Soliman A, Tzoulis P, Daar S, Pozzobon GC, Kattamis C. A
study of isolated hyperglycemia (blood glucose ≥155 mg/dL) at 1-hour of
oral glucose tolerance test (OGTT) in patients with β-transfusion
dependent thalassemia (β-TDT) followed for 12 years. Acta Biomed.
2021;92(4):e2021322. https://doi.org/10.23750/abm.v92i4.11105
- De
Sanctis V, Soliman AT, Daar S, Tzoulis P, Kattamis C. Isolated increase
of plasma glucose levels at 30 minutes during oral glucose tolerance
test (OGTT) in young adult patients with transfusion-dependent
β-thalassemia (β-TDT): A possible predictor marker for early
development of glucose dysregulation (GD). Acta Biomed.
2025;96(2):16957. https://doi.org/10.23750/abm.v96i2.16957